![[Visual][guide] sentiment analysis home page](http://images.ctfassets.net/gwbpo1m641r7/5Ambj2K5EYDaS0tiOWyuZz/e923f90fb57af8a30a7d8f5e626ff9ea/sentiment-analysis-team-work.jpeg?w=3840&q=100&fit=fill&fm=avif)
If you’ve come here to learn more about Google Analytics heatmaps, we have good and bad news for you.
The bad news 😥: Google deprecated its free heatmap add-on in 2017. Recent reviews confirm it no longer works and is not compatible with GA4.
The good news 🤗: there's another (easier!) way to generate a free heatmap that we guarantee will work.
Here’s how:
What is a Google Analytics heatmap?
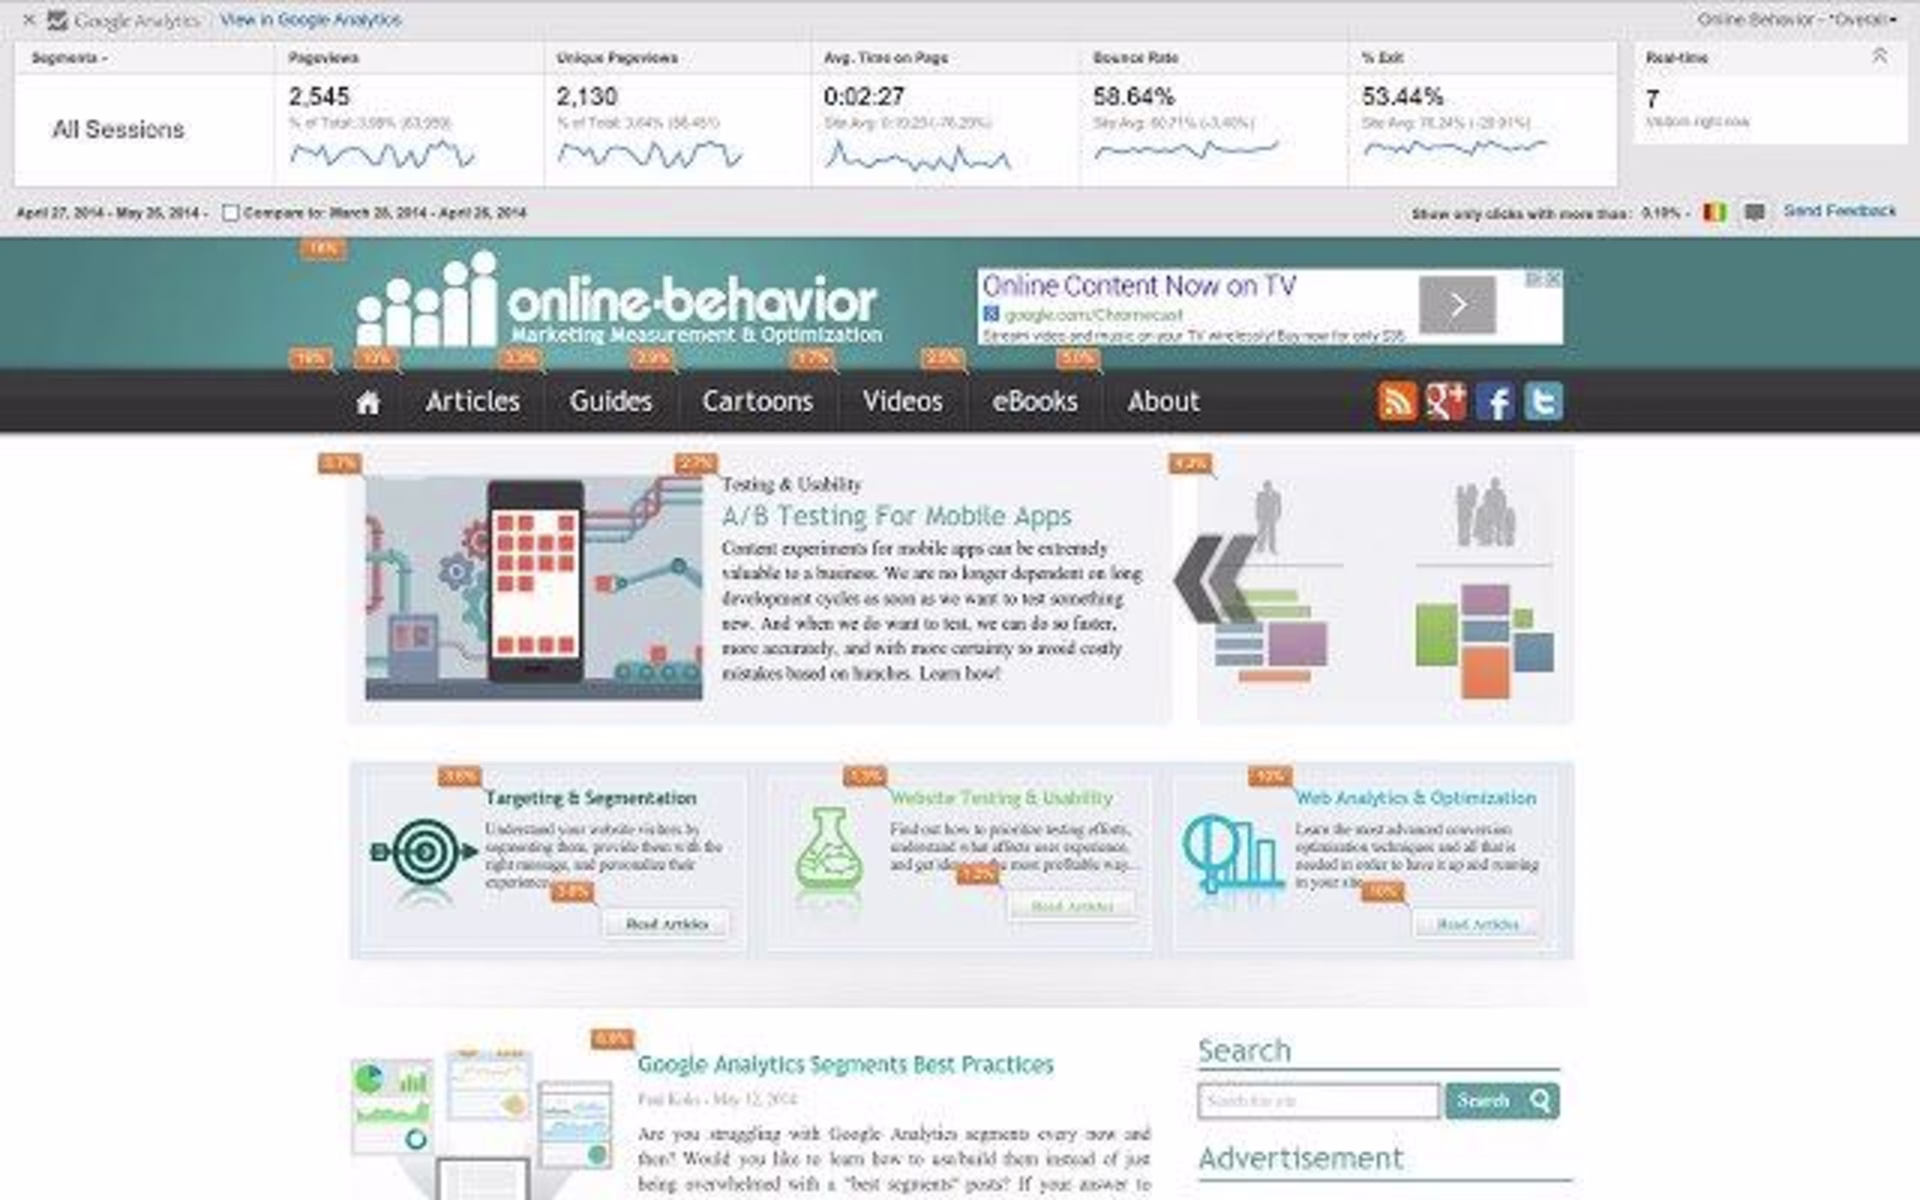
A former Google Analytics heatmap (now retired) in action—the orange tags show click percentages
A Google Analytics (GA) heatmap was a visual representation of where visitors click on your website. It was powered by data GA collected through its tracking code snippet.
Prior to 2019, GA users could generate a free heatmap using Google's heatmap extension, Page Analytics (by Google).
Unfortunately, Page Analytics (by Google) was deprecated in 2017 and hasn’t been updated since 2019. There’s no support for GA4, and many users (including us!) struggle to get it to work, leading to several one-star reviews on the Chrome web store.
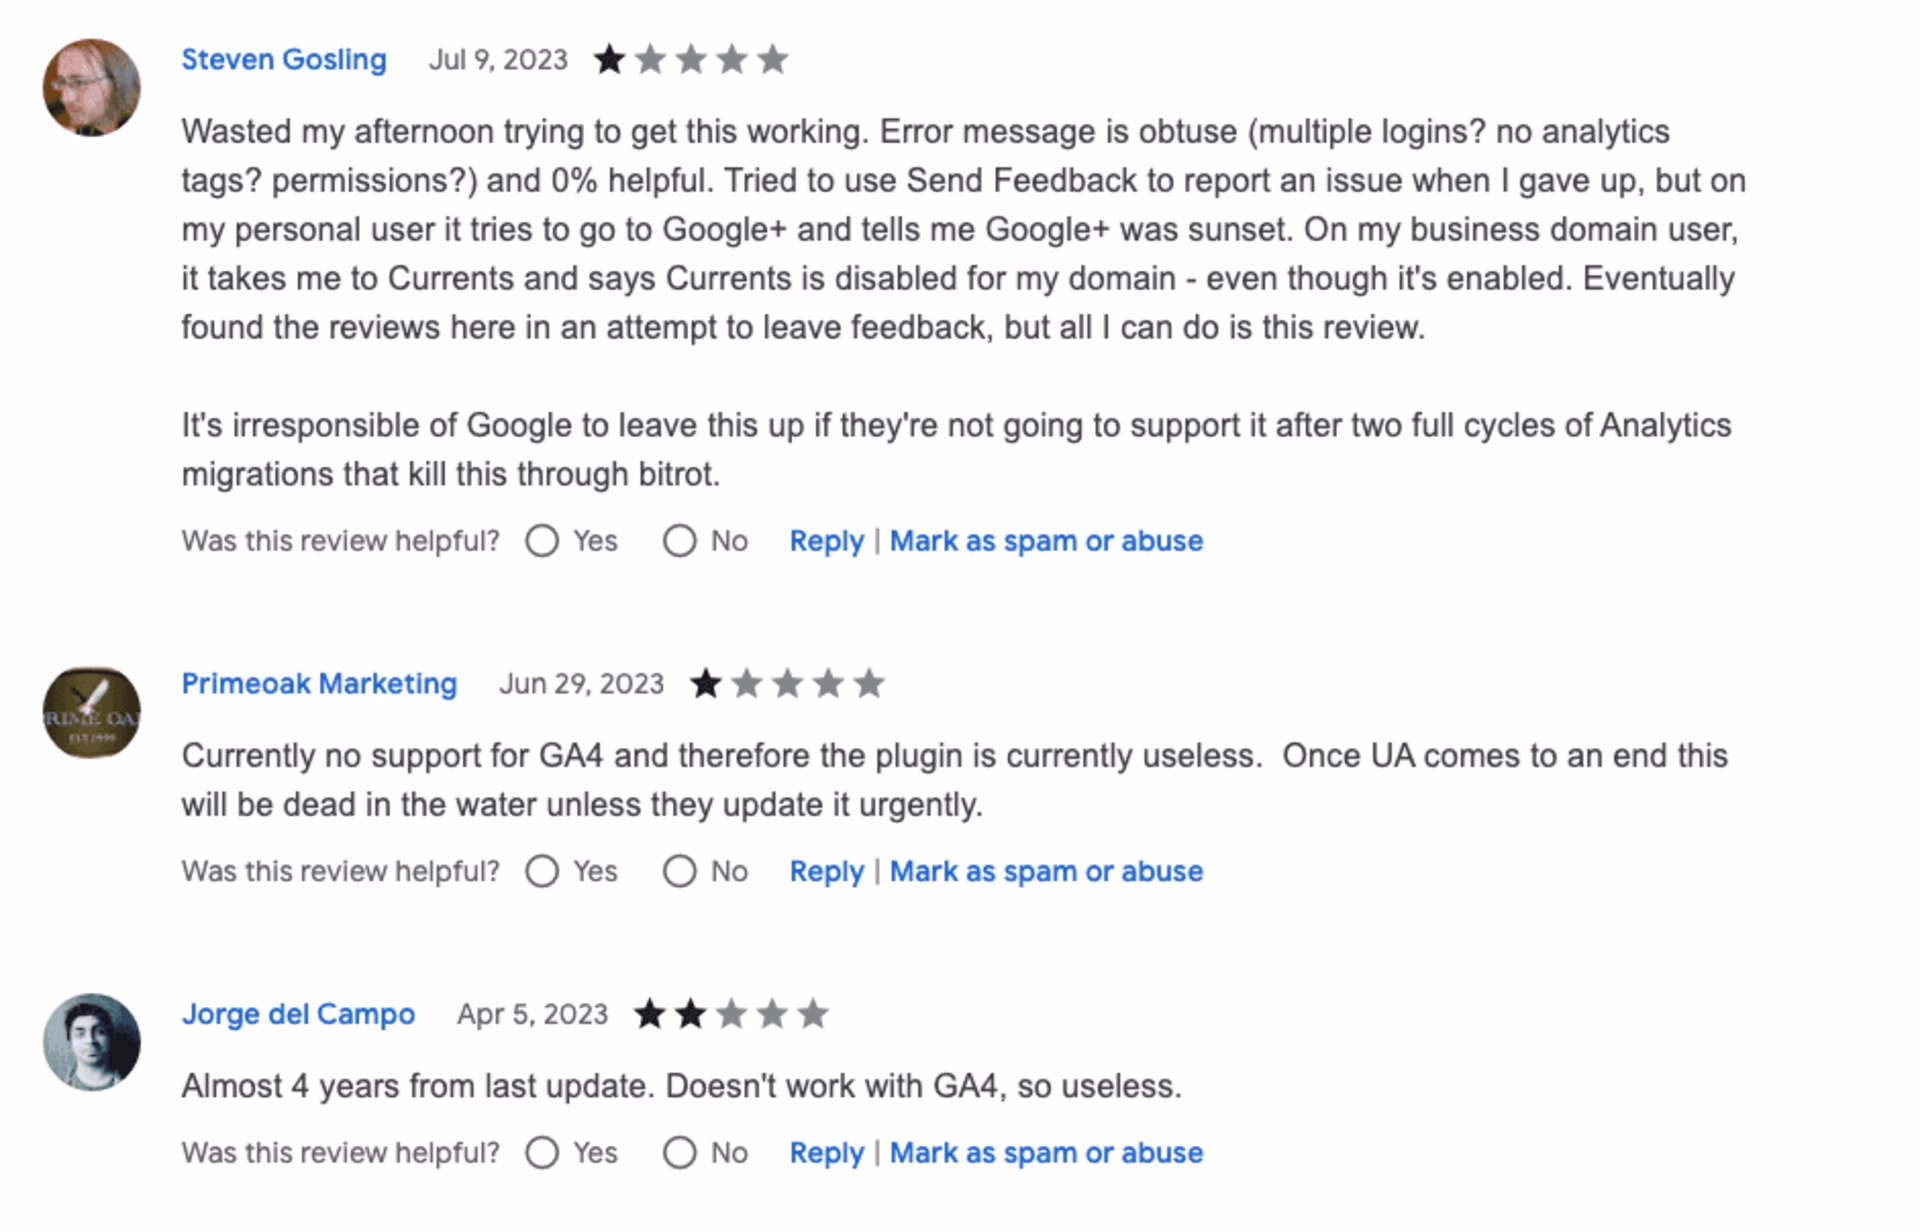
Reviews of the Google Analytics heatmap Chrome extension
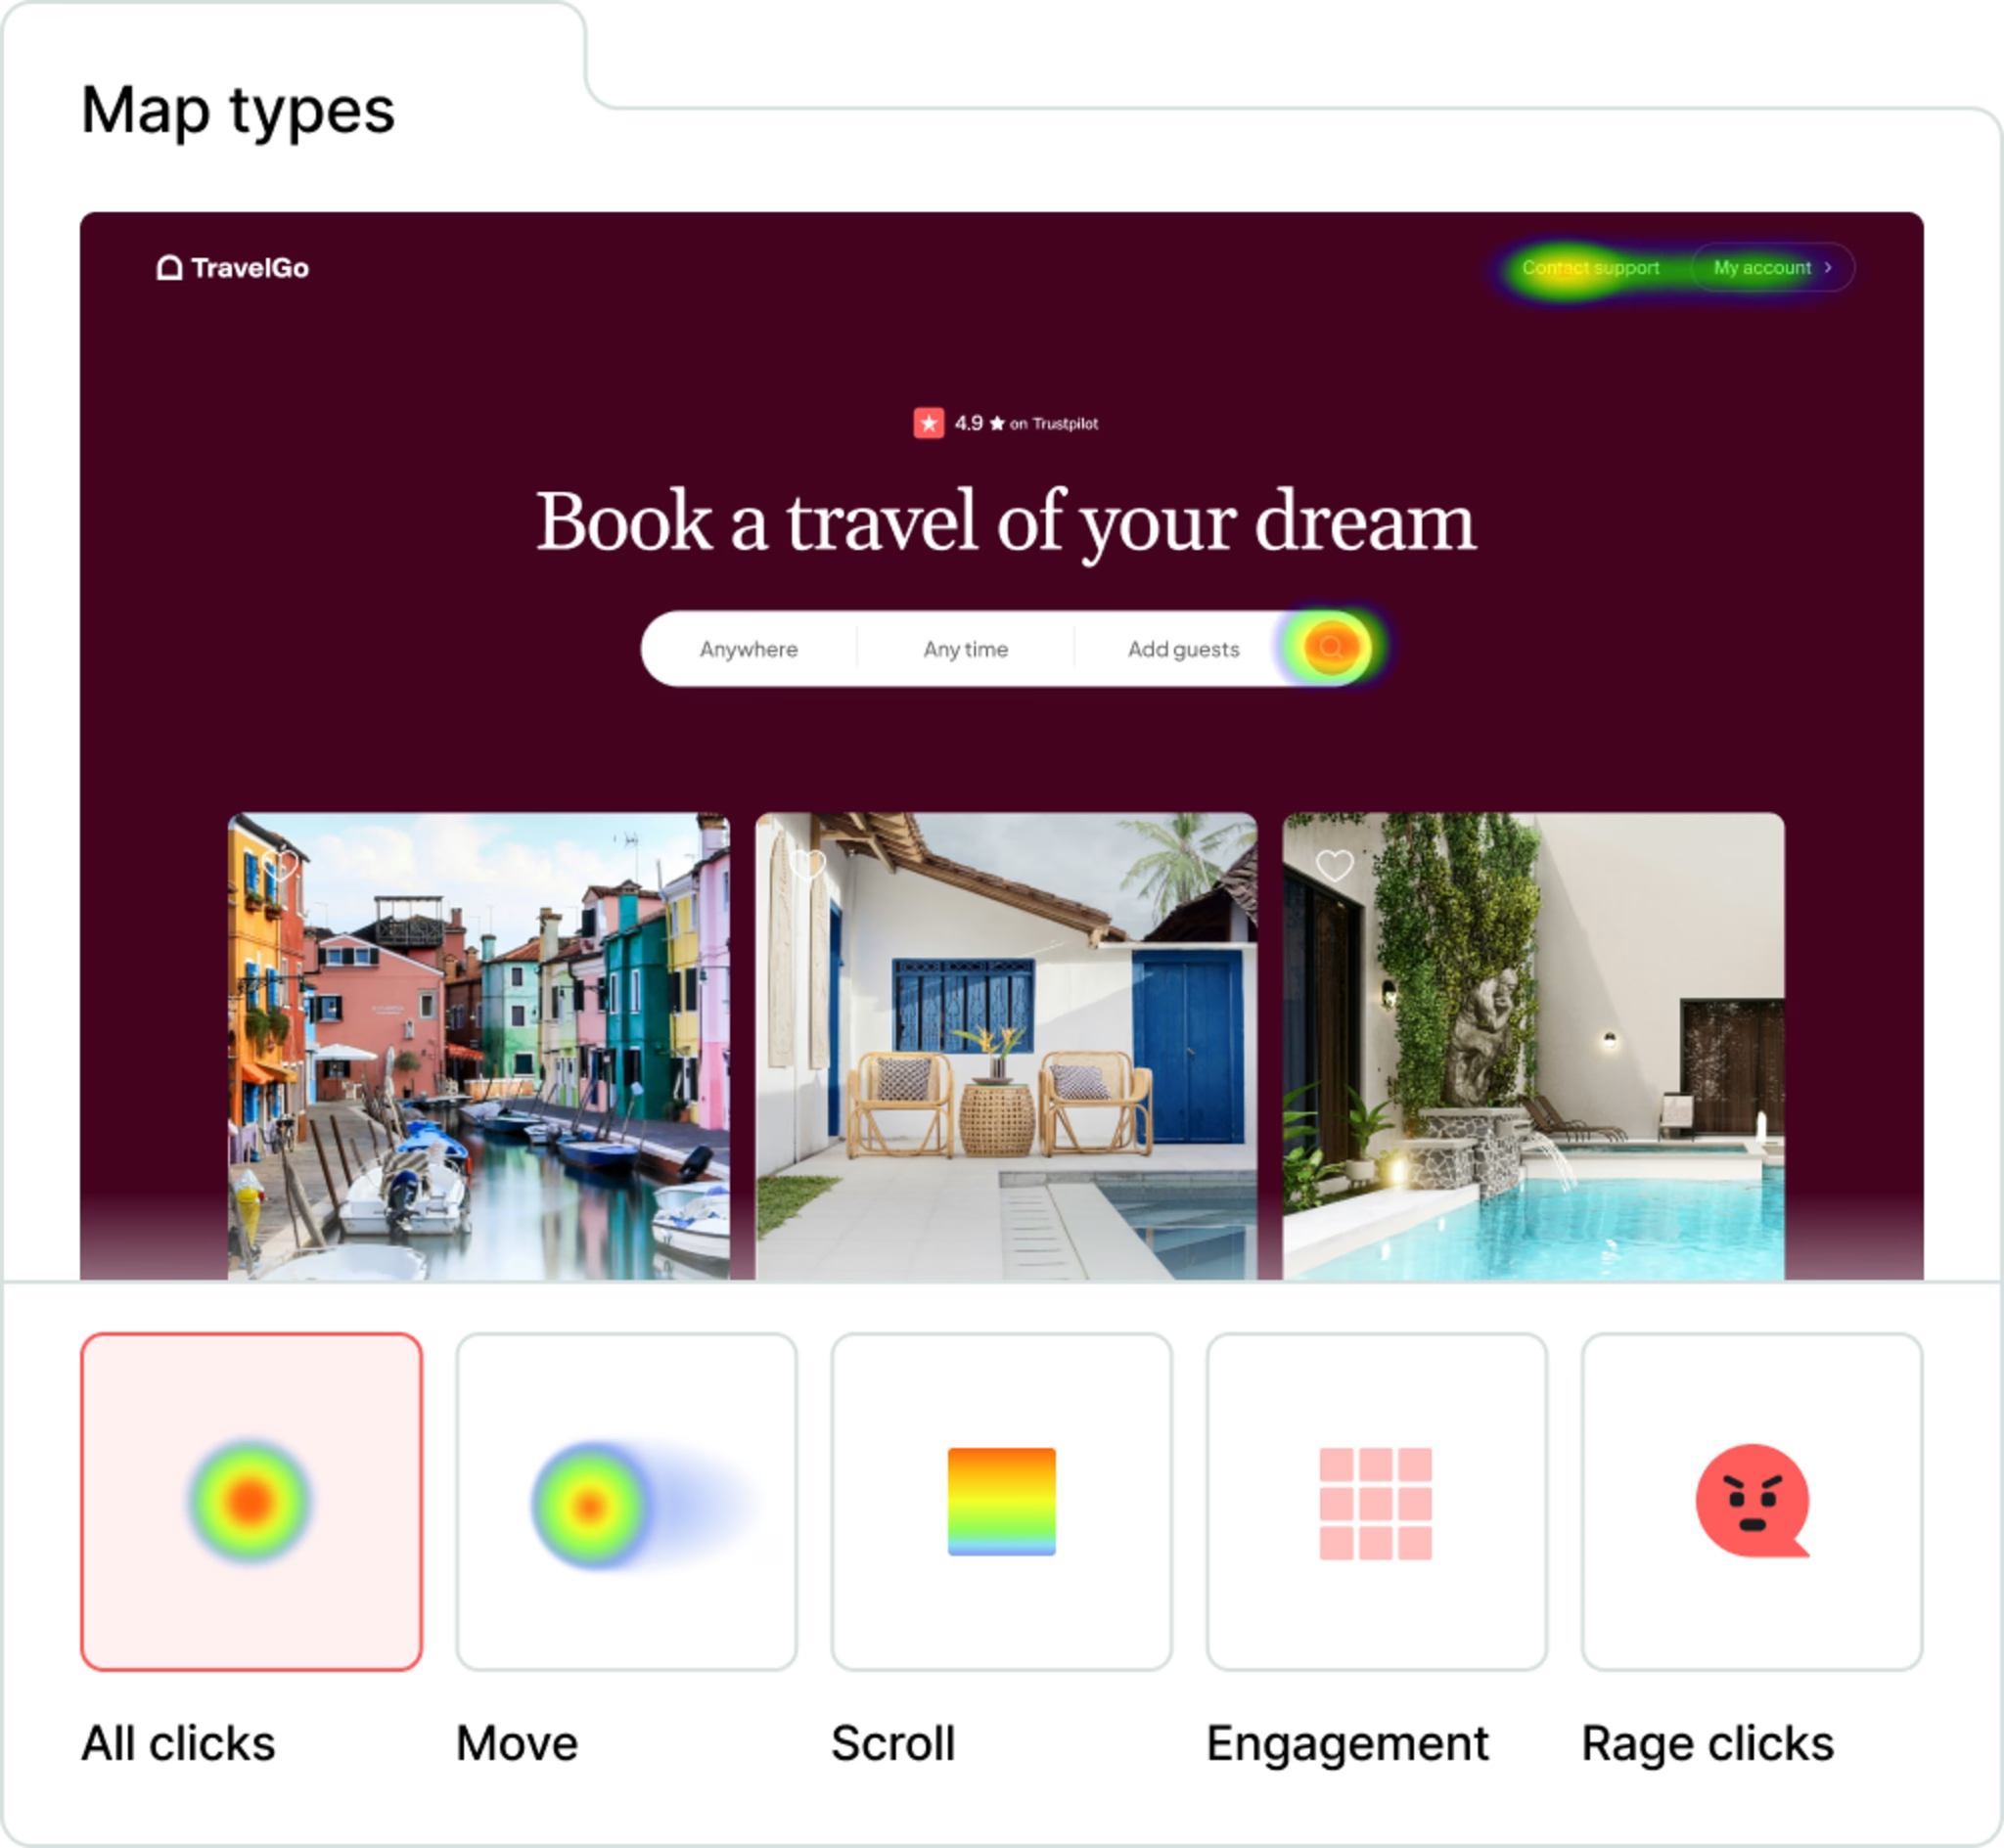
Even if you do get it to work (good luck! 😮💨), GA heatmaps have limited functionality—you’d only get a basic click map with percentages, not the colorful data visualization you might be expecting.
The difference between a dry Google Analytics heatmap (L) and a colorful move map (R)
Why do GA users want to view heatmaps, anyway?

Aside from being fun to look at, heatmaps give you a shareable and easy-to-understand visual overview of any website page’s performance. However you create them, heatmaps help you
Quickly visualize user behavior
See what users click on (and ignore)
Identify page areas with high engagement
View how far users scroll down the page
Find and fix bugs and broken page elements
Get stakeholder buy-in for website optimizations
Showcase results to managers and clients
Generate ideas for conversion rate optimization (CRO)
Analyze A/B testing results and iterate improvements
Luckily, the end of Google Analytics heatmaps doesn’t mean you have to miss out on these brilliant heatmap benefits. Contentsquare Heatmaps is one of the world’s best-loved heatmap tools—and we let you generate as many heatmaps as you want, for free. Read on to find out how. 👇
How to set up a free website heatmap in Contentsquare
Different types of heatmaps available to Contentsquare users
Contentsquare (that’s us, 👋 hello!) is a best-in-class experience intelligence platform used on over 1 million websites. Aside from our advanced plans for growing businesses, Contentsquare also offers a free plan with unlimited heatmaps. You read that right: unlimited heatmaps.
By using Contentsquare Heatmaps instead of Google’s old heatmap tool, you’ll be able to do the following:
Automatically generate multiple types of heatmap at once. These include
Click maps: visualize the number of clicks on any element
Scroll maps: see how far down the page visitors scroll
Move maps: see how users move and hover their mouse as they browse
Rage click maps: quickly find broken or confusing elements
Zone-based heatmaps (available for Pro and Enterprise accounts): break your website into different zones and see detailed metrics—like revenue—assigned to each zone
Mobile heatmaps: visualize how users tap, move, and scroll on mobile devices
View heatmaps segmented by visitor data like country, device, and traffic source
Share a link to any heatmap with your colleagues, stakeholders, and clients
Download and export heatmap data as a .PNG file
Click through to view session replays of individual user browsing journeys
Ready to get started? Here’s how to set up a Contentsquare heatmap in five steps.
Step 1: sign up for Contentsquare
Sign up with your Google account or email address. Contentsquare offers free and premium plans based on your needs.
Step 2: add Contentsquare’s tracking code to your website
Contentsquare tracks your website visitors in a similar way to Google Analytics. You can install Contentsquare’s tracking code in several ways (we put together a useful setup guide to help you get started).
After installing and configuring the tracking code, you’re ready to move onto the next step.
Step 3: open the Heatmaps tool
Head into your Contentsquare dashboard and click into the ‘Heatmaps’ tool. Then click ‘New heatmap’.
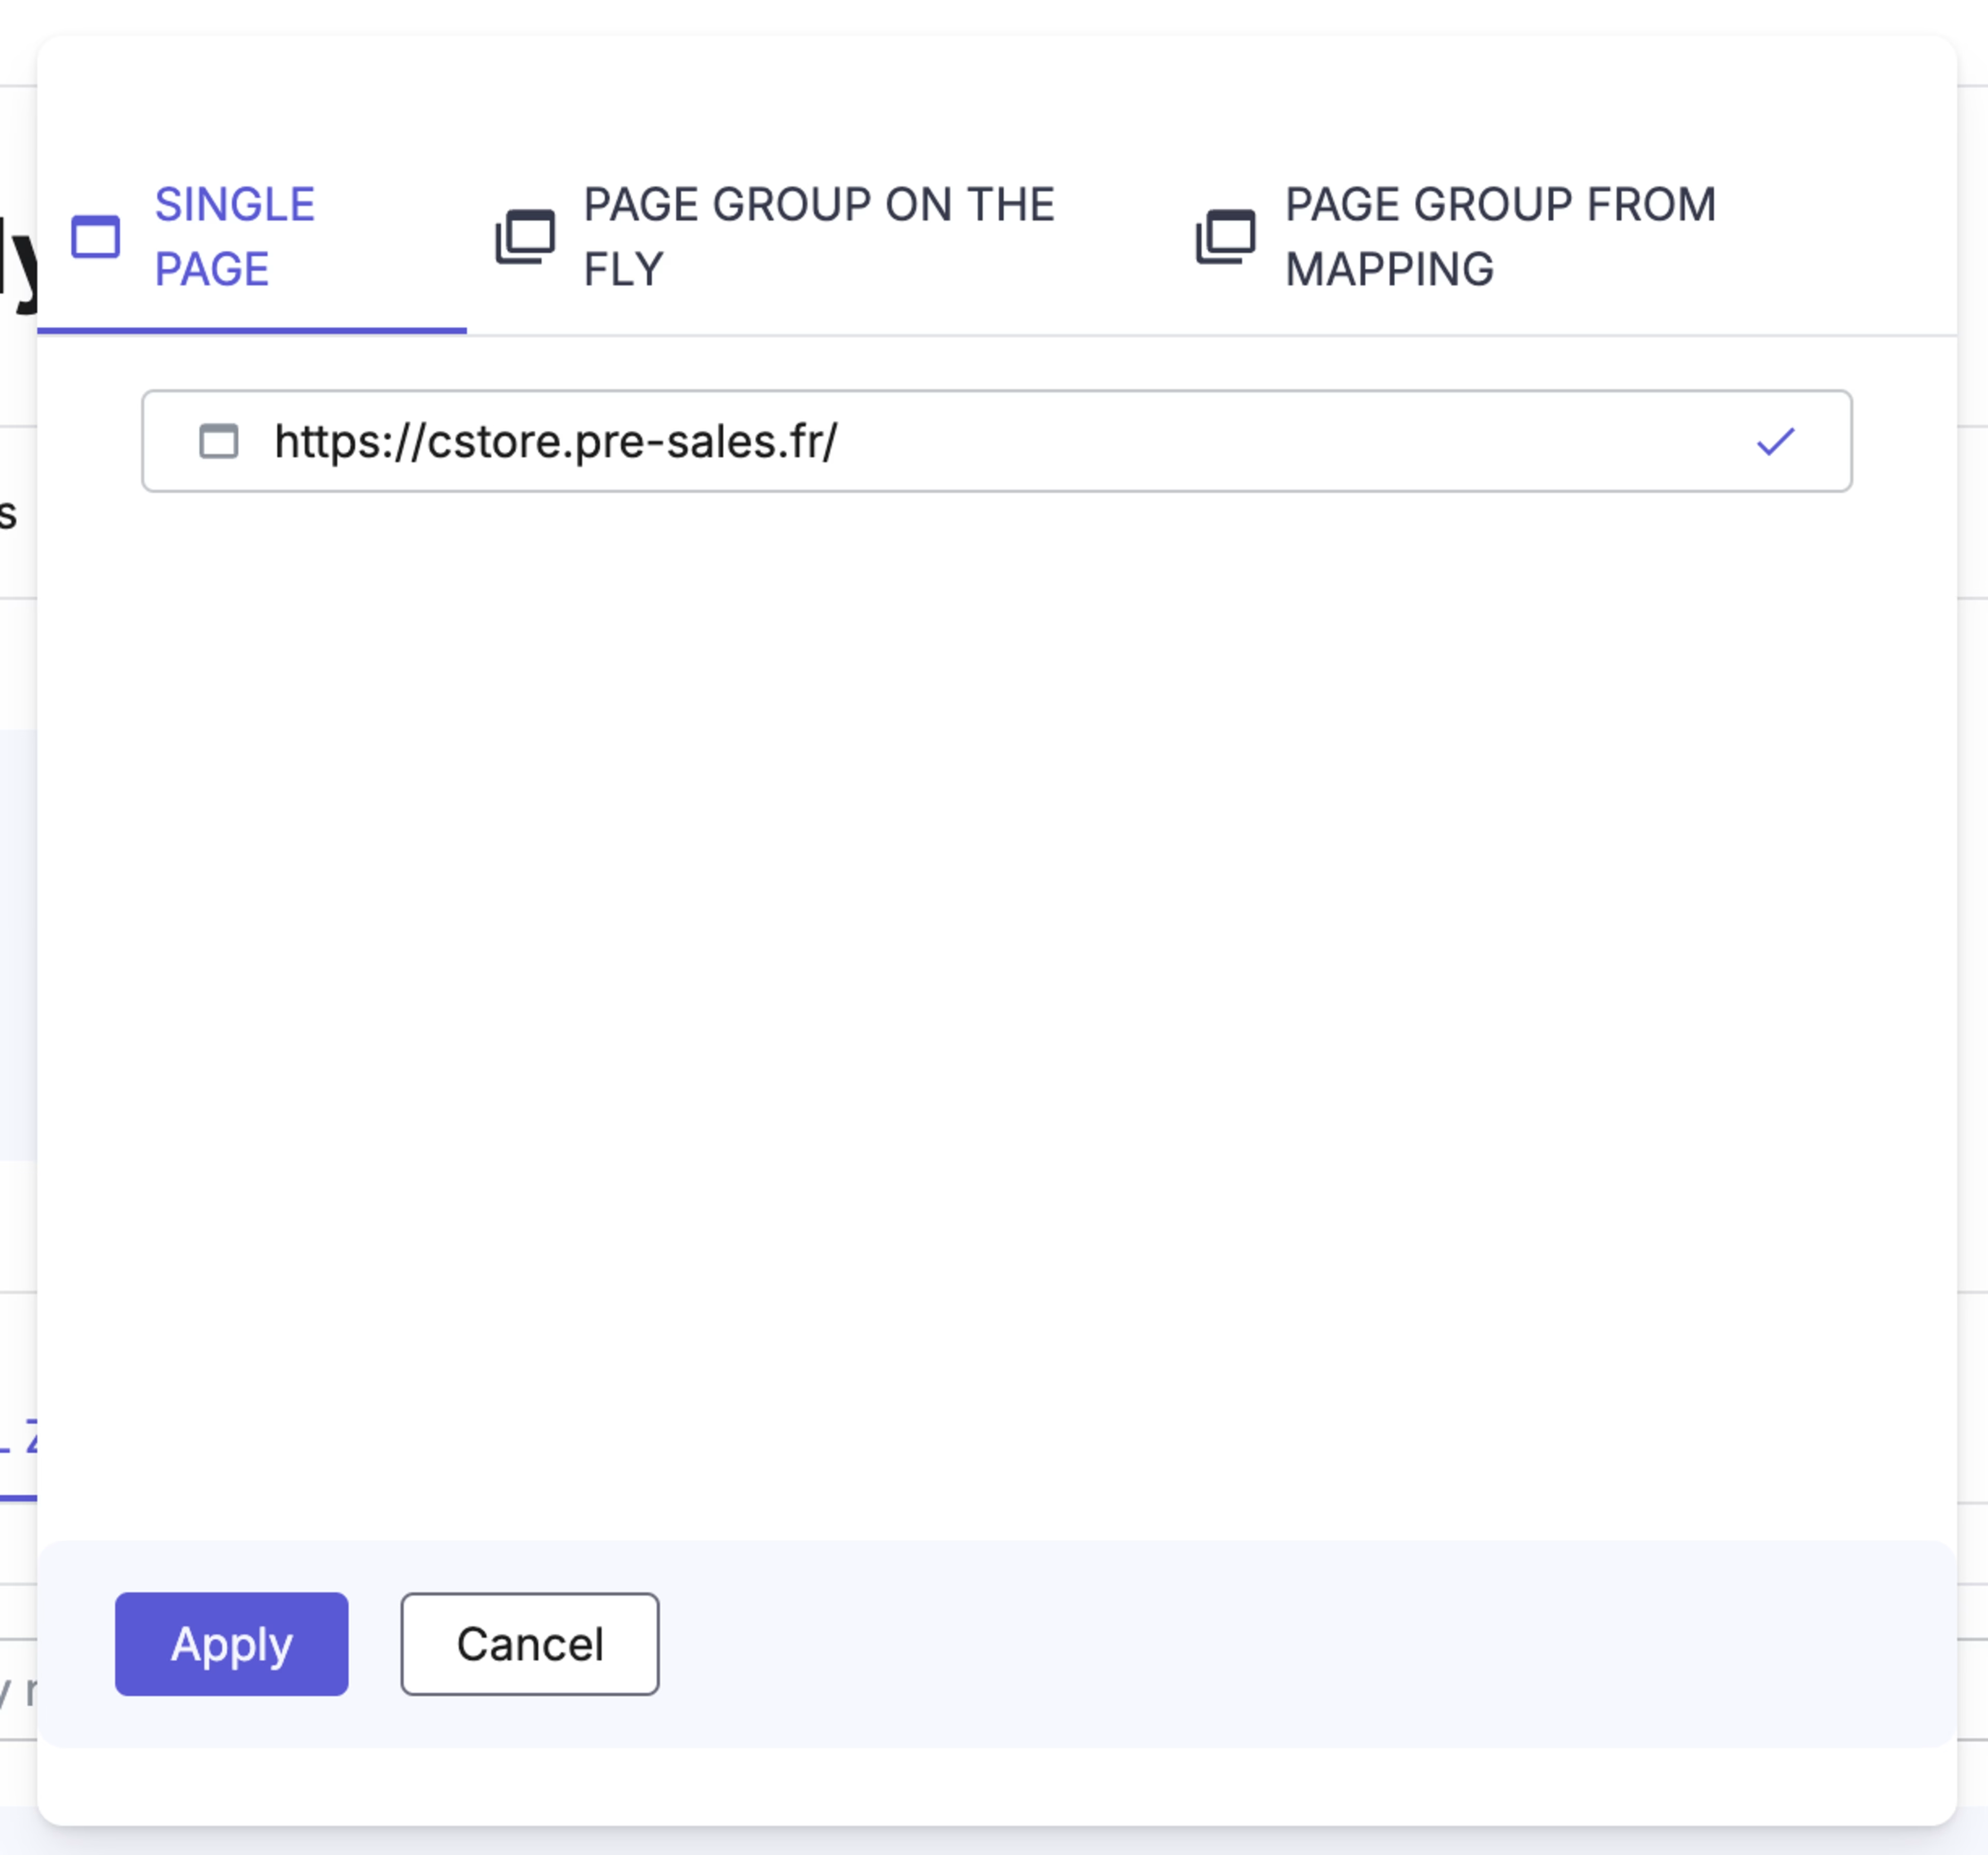
Step 4: enter the URL of your heatmap or select from the popular pages list
Enter the page(s) you want to create heatmaps for.
Here are the different URL options available:
URL is
URL is exactly
URL contains
URL starts with
URL ends with
URL matches regex
Enterprise and Pro plans also have the ability to select page groups.
After entering your page(s), click ‘Apply’.
Contentsquare will get to work and start collecting data for your heatmaps.
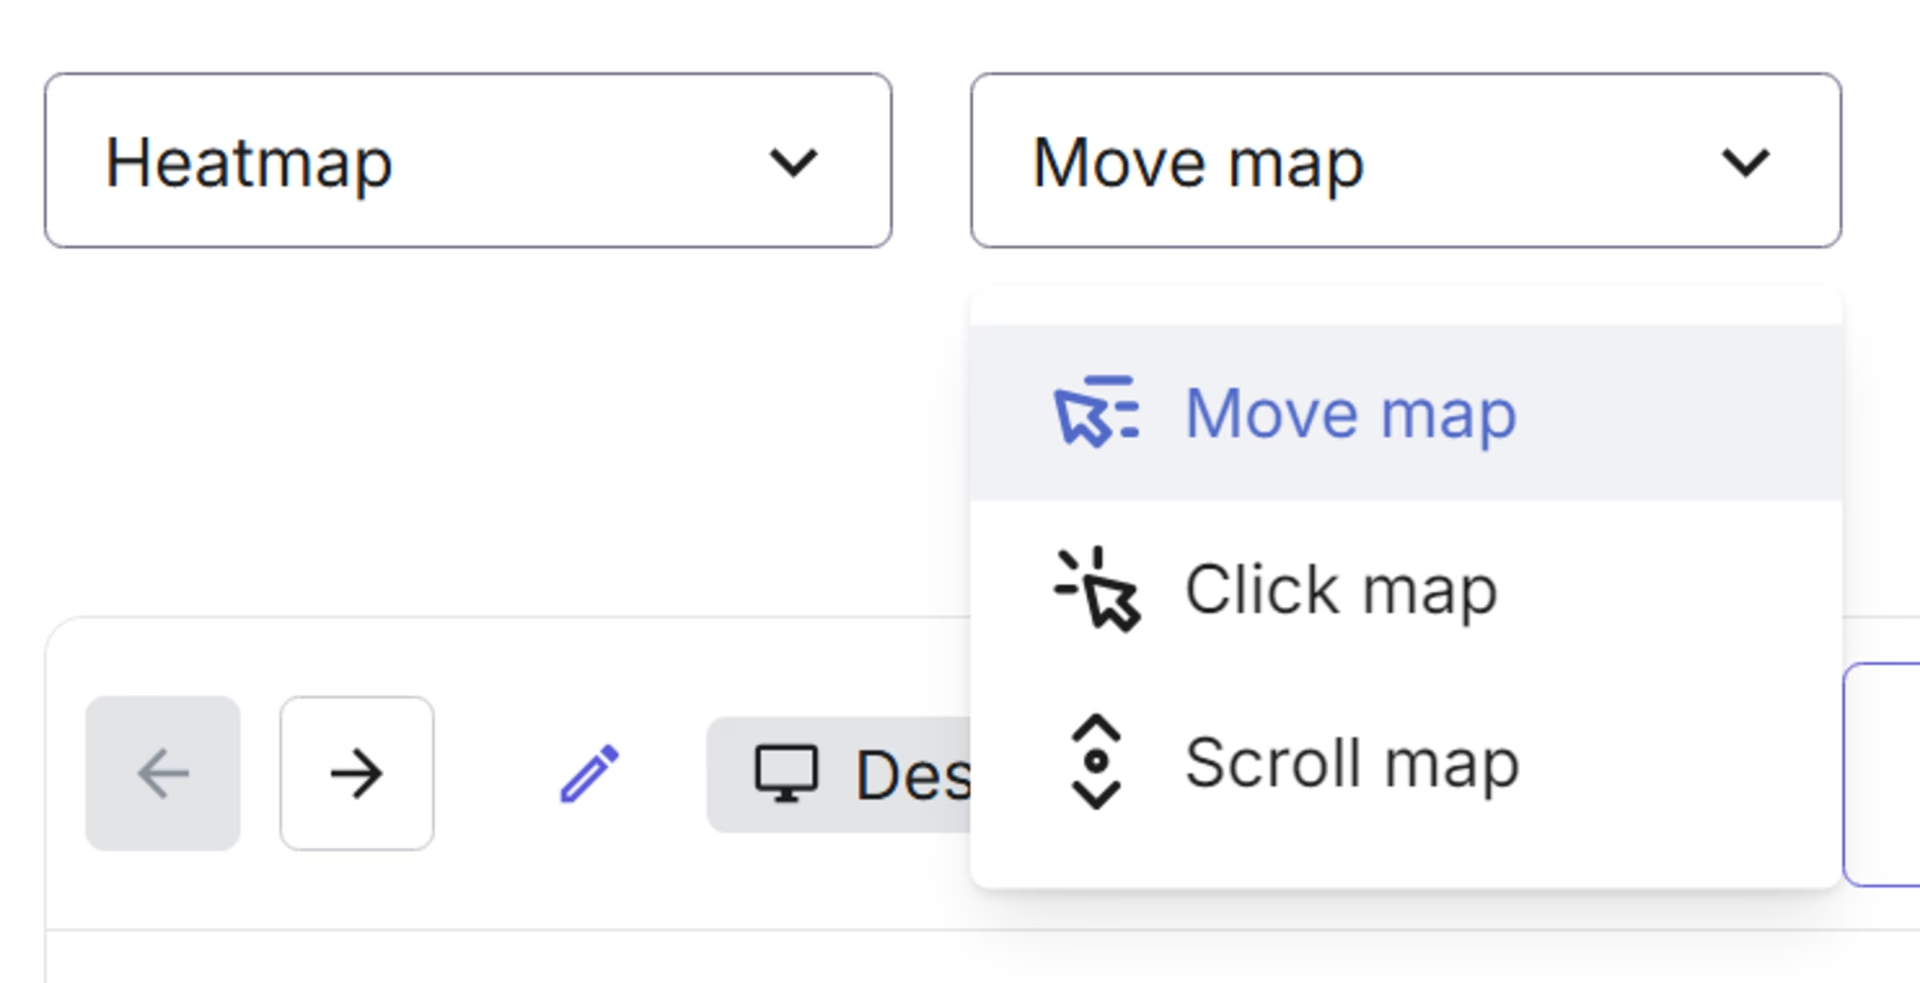
Step 5: toggle between different heatmap types and use filters to view different traffic segments
Use the dropdown to view different types of heatmaps, like move maps, click/tap maps, and scroll maps.
You can also use filters to drill down into specific audiences. Here are some examples:
Filter by ‘time spent on page’ to see how users interact with the page who spend a considerable amount of time versus those who bounce right away
Filter by conversions and goals to see which page elements are helping people move towards their destination
Filter by ‘rage clicks’ to see which elements are causing users the most frustration
Which pages should I generate a heatmap for?

An ecommerce purchase report in Google Analytics showing a product with high unique page views but no purchases
This is where GA comes in handy when used alongside Contentsquare: log into your Google Analytics account and look for areas of low performance—for example, pages with a high bounce rate or exit rate and low conversion rates.
Then in Contentsquare, generate heatmaps on these pages to see what confuses users and causes them to leave: are they rage-clicking on broken elements? Not scrolling far enough to see calls to action (CTAs)?
On the flip side, a heatmap on your best-converting web pages shows you which elements attract attention, so you can do more of what works.
Add qualitative insights to your heatmaps and GA website data
Using heatmaps alongside Google Analytics helps you identify what’s needed to improve your site’s user experience.
However, quantitative metrics like bounce rate, clicks, and time on page alone don’t reveal what truly motivates your customers to choose, stay loyal to, and recommend your products.
To get a complete picture, combine GA and heatmaps with additional Contentsquare tools like session replays, surveys, and user interviews—all accessible within the Contentsquare platform. These tools provide deeper insights into your audience and empower you to make data-driven decisions that optimize your site and drive revenue growth.

![[Visual] Competitive product analysis](http://images.ctfassets.net/gwbpo1m641r7/5KKQOOjvDBCQtGIQCFnGgE/1c07d3d5527db0fe1c5f6c5476a8beb1/AdobeStock_846417258__1_.png?w=1920&q=100&fit=fill&fm=avif)
![[Guide] [Website analytics] Homepage](http://images.ctfassets.net/gwbpo1m641r7/2UZ27P5MaxkUlKktO6d0Bn/0fdd8ddfb9a959efef0664b86ad56a34/Guide_-_website_analytics_-_homepage_.jpeg?w=1920&q=100&fit=fill&fm=avif)