![[Visual] AI analytics home - stock](http://images.ctfassets.net/gwbpo1m641r7/64i3HakmQ9aHWYWEEqpFUM/f1d5d2a41b5c7d7a523a34b58bd50ece/AdobeStock_634961399.png?w=3840&q=100&fit=fill&fm=avif)
Without warning, your website conversion rate drops 15% overnight. But no one can explain why it happened. Was it a technical glitch? A design change? Without answers, you’re left making educated guesses—and hoping your fixes work.
This is where diagnostic analysis comes in. Instead of just sweating the problem, you find out what’s causing it. It’s the difference between just knowing your conversion rate tanked and discovering that a form field error is blocking 2,000 users from completing their purchases.
In this guide, discover what diagnostic analytics is, why it matters, and how it differs from other types of analytics. Plus, we show you the practical techniques digital teams use to diagnose performance issues—helping you fix problems faster and make more informed decisions.
Key insights
Diagnostic analytics is your bridge from symptoms to solutions, giving you the clarity to fix problems instead of guessing
Following a systematic process—and using an all-in-one experience intelligence platform like Contentsquare—helps you diagnose problems faster and more accurately
From automatic anomaly detection to natural language querying, AI-powered tools like Sense help accelerate the entire diagnostic process
What is diagnostic analytics?
Diagnostic analytics is the process of examining your data to find the root causes behind trends, patterns, and anomalies. While descriptive analytics tells you what happened in your data, diagnostic analytics digs deeper to explain why it happened—making it essential for product and customer experience (CX) optimization.
Some of the types of questions that diagnostic analytics help you answer include
Why did conversion rates drop 23% yesterday?
Why is mobile engagement 40% lower than desktop?
Why did checkout abandonment spike between 2 and 4 pm?
Why are users from paid search bouncing faster than organic traffic?
Why did form completions suddenly decline after our latest release?
Why diagnostic analytics matters for digital teams
Every digital team has been there: staring at a dashboard that shows something went wrong, but offers zero clues about how to fix it. That’s the frustration that diagnostic analytics eliminates—and why it’s become essential for product, UX, and marketing teams who need to move fast.
Here are 3 big benefits of diagnostic analytics for your team:
1. Faster troubleshooting
Forget spending days manually comparing reports and testing theories—diagnostic analytics helps you pinpoint the cause in minutes. When your checkout flow breaks, you don’t have to guess which of the 37 changes you shipped last week caused the problem. Instead, you learn exactly what the issue is and get to work fixing it.
2. Less guesswork
With diagnostic analytics, you can stop running expensive A/B tests based on hunches. Instead of just wondering if users don’t like a new blue button, you can find out that 78% of mobile users can’t tap the button because it’s hidden behind a banner ad. And when you make changes based on evidence, not assumptions, you see fewer failed experiments and faster wins.
3. Better decision-making
When you understand why something happened, you make smarter choices about what steps to take next. If you see bounce rates increase, diagnostic analytics might reveal that a bug is slowing page load time by 4 seconds—so you know exactly the kind of fix you need to deploy.
🔥 How Charles Sturt University increased revenue by $6.7M with diagnostic analytics
Australia’s Charles Sturt University faced a major issue: nearly 30% of prospective students were abandoning their application process on the login page. But they didn’t know why.
Using Contentsquare’s diagnostic analytics tools, including Journey Analysis and Heatmaps, they uncovered the hidden friction points. The data showed that on mobile devices, only 54% scrolled far enough down to see the ‘Register’ button, and only 1.27% of users saw the ‘Login’ button.
Based on these insights, the team redesigned the pages with a mobile-first approach: repositioning the CTAs, simplifying content, and improving the visual hierarchy. The results? A 58% increase in successful logins, a 10.6% lift in account creation clicks on mobile, and a projected $6.7 million AUD annual revenue boost.
Diagnostic vs. descriptive vs. predictive vs. prescriptive analytics
These types of analytics work together to give you a complete picture of your website’s or product’s performance. All 4 are essential, but diagnostic analytics is often the missing link between identifying problems and actually solving them.
1. Descriptive analytics: what happened?
Descriptive analytics is your foundation—it shows you the facts. This is where you track metrics like traffic, conversion rates, and revenue.
⚒️ Tools you might use: Contentsquare’s Dashboards help you monitor your key metrics in one place, helping you spot trends and anomalies at a glance. For example, create customized views of your most important metrics, filter by specific user segments, or click through from high-level data directly into heatmaps or session replays to investigate further.
👉 Example: ‘Mobile traffic increased 30% last month.’
That’s a great starting point, but you still need to understand why to make that data actionable.
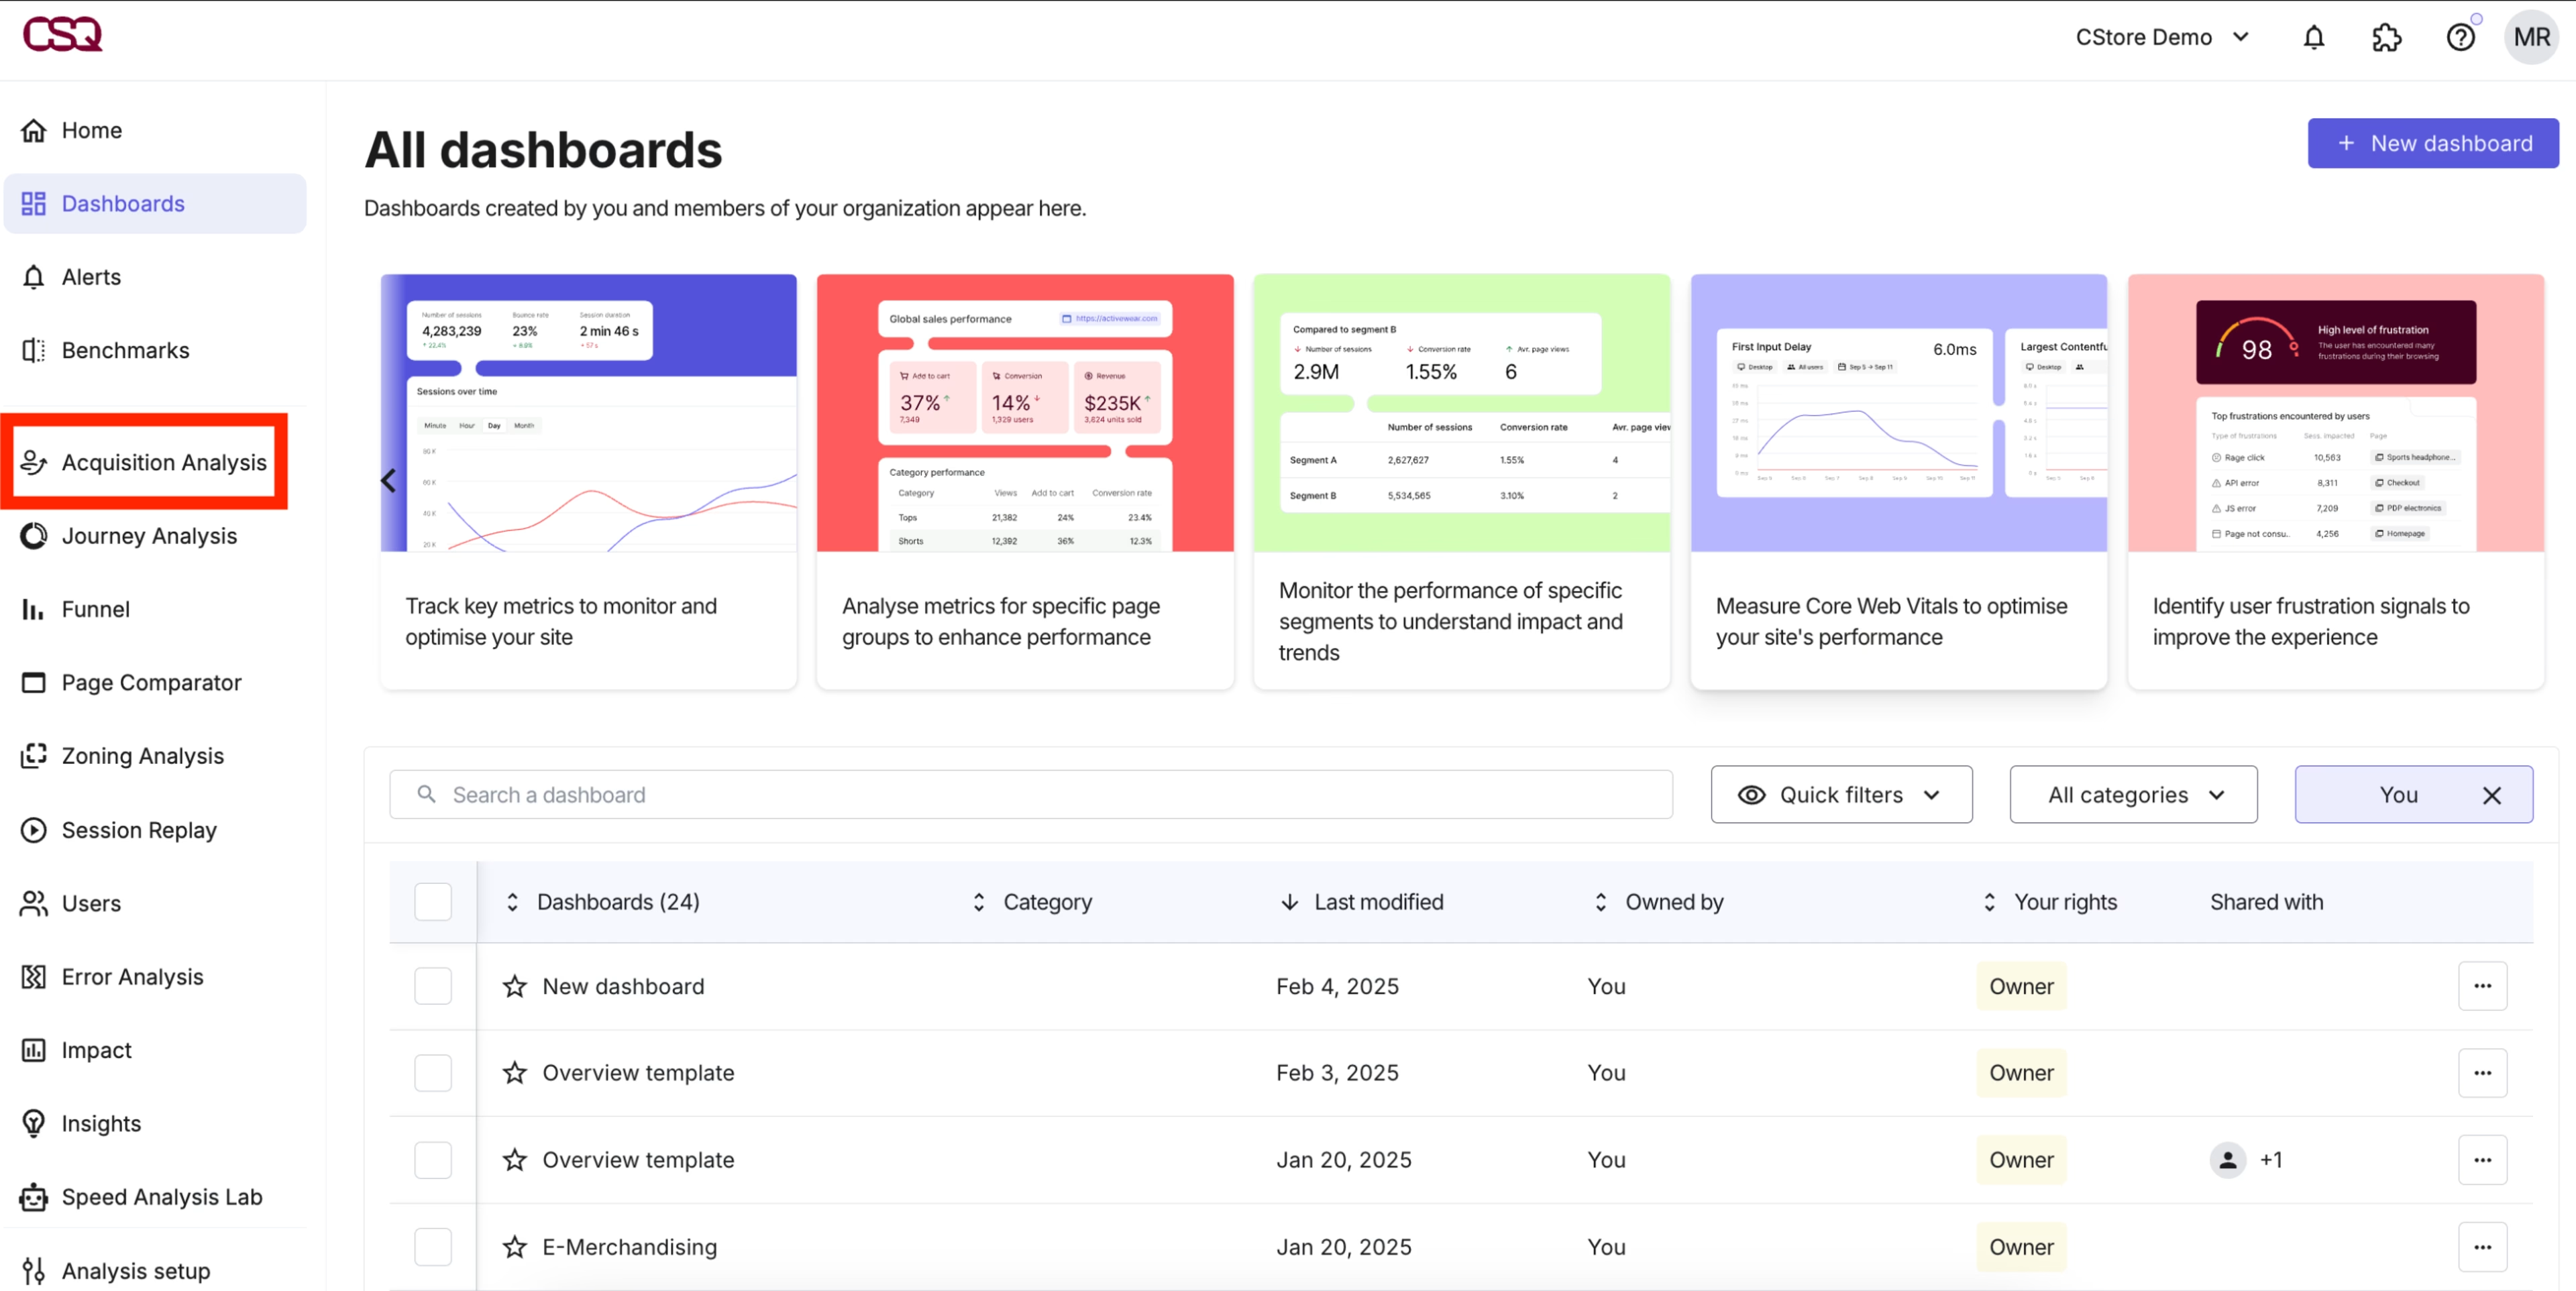
Contentsquare’s Dashboards tool lets you organize your top metrics and charts, starting from a template
2. Diagnostic analytics: why did it happen?
This is where things get interesting. The diagnostic analytics process involves investigating the reasons behind your data, using techniques like customer segmentation to identify trends in audience groups, correlation analysis to see how variables relate to each other, or root-cause analysis to find the reason behind a problem.
⚒️ Tools you might use: our Session Replay tool lets you watch real user sessions to see exactly where and why users struggle. Heatmaps show you which on-page elements drive or block engagement, revealing patterns that raw numbers can’t.
👉 Example: ‘While mobile traffic increased 30%, conversions dropped because the mobile checkout flow has too much friction—users are abandoning when forced to create an account.’
Now you understand both the problem and the opportunity. You know what to fix and why it matters.
![[Visual] Heatmaps types](http://images.ctfassets.net/gwbpo1m641r7/44qPX6Nyu2v2i9pGM8JdIE/e1ccfd573959295483bb4b867ca7e57f/Heatmaps___Engagements__3_.png?w=2048&q=100&fit=fill&fm=avif)
Contentsquare’s heatmaps are data visualizations that show how users engage with your site
3. Predictive analytics: what will happen?
Predictive analytics uses historical data, machine learning, AI algorithms, and statistical modeling to forecast future outcomes. It helps you prepare for what’s coming—whether that’s traffic spikes or churn risk.
⚒️ Tools you might use: Contentsquare’s Data Connect lets you send structured behavioral data to your data warehouse, where you can run predictive models to forecast customer churn or identify at-risk users. Other tools like Dataiku or Altair AI Studio are helpful for everything from data processing to building predictive analytics models.
👉Example: ‘Based on current trends and last year’s customer data, we’ll see a 14% jump in holiday season traffic.’
With this actionable insight, you can prepare your infrastructure, staff up customer support, or launch proactive campaigns before the rush hits.
![[Visual] Data-connect-warehouses](http://images.ctfassets.net/gwbpo1m641r7/7I3BUMjz9UdK66mvBkLZNl/327db6b3de02d490f7561b5f1836f86a/Data-connect-warehouses.png?w=3840&q=100&fit=fill&fm=avif)
Data Connect makes it easy to bring clean, structured behavioral data to your data warehouse for further analysis or predictive analytics
4. Prescriptive analytics: what should we do?
After running descriptive and predictive analytics, prescriptive analytics uses mathematical models and optimization to recommend specific actions you should take. Instead of just showing you problems or predictions, it tells you what to do about them.
⚒️ Tools you might use: Contentsquare’s AI agent Sense Analyst automatically analyzes your behavioral data, compares journeys, identifies root causes, and surfaces actionable recommendations. It’s like having a team of analysts working overnight to surface your most important optimizations, so you understand what to fix and why it matters.
👉 Example: ‘Simplify the mobile checkout flow by removing the account creation requirement. This change could increase mobile conversion by around 7%.’
This gives you clear action with a projected outcome—so you can prioritize what to work on next.
Sense saves me hours of analysis—it's like having an analyst on the team that can quickly serve insights, answer my queries, and even speak our company’s own language. With our previous analytics tool, I’d spend nearly a full day pulling insights for a single use case, and now I have answers in minutes. It’s honestly incredible, and I'm excited for what's next.
The diagnostic analytics process in 5 steps
Now that you understand where diagnostic analytics fits into the bigger picture, let’s talk about how to actually do it. The difference between finding answers quickly and getting lost in data chaos is having a systematic process.
Many teams approach diagnostic analytics reactively—clicking through dashboards, pulling random reports, and hoping something interesting jumps out. If that sounds familiar, we get it—it can be hard to know the best way to get started. But following a structured approach gets you from ‘something’s wrong’ to ‘here’s exactly what to fix’ in a fraction of the time.
Here’s a 5-step process that works:
Identify the issue or question: start by looking for unusual patterns or anomalies in your data—a sudden drop in conversions, for example, or declining engagement on a key page. Once you find something, frame it as a specific question to answer: ‘Why did form submissions drop 22% on Tuesday?’’
Gather relevant data: collect data points about the issue from multiple sources. This could include product analytics, technical error logs, or customer behavior data from Contentsquare’s Journey Analysis or Frustration Scoring. Cast a wide net initially—you’ll narrow it down in the next step.
Segment and filter: break down your datasets to isolate where the problem is occurring. Using user segmentation, filter by device type, geographic location, or user type (such as new vs. returning). This is where patterns start to emerge.
Analyze patterns and connections: look for correlations between the anomaly and other variables through data analytics. Did the issue start at a specific time? Does it only affect certain user segments? Are technical errors occurring? Remember that effective analysis draws on both qualitative and quantitative data. Quantitative data analysis includes investigating metrics like session duration and page views, while qualitative data analysis reviews descriptive insights from surveys or interviews that provide essential context.
Validate and quantify the findings: confirm your hypothesis by checking multiple data sources and measuring the actual business impact to determine what it’s costing you. Contentsquare’s Impact Quantification helps you translate UX friction, inefficiencies, and bottlenecks into concrete metrics to help you prioritize fixes and prove return on investment (ROI).
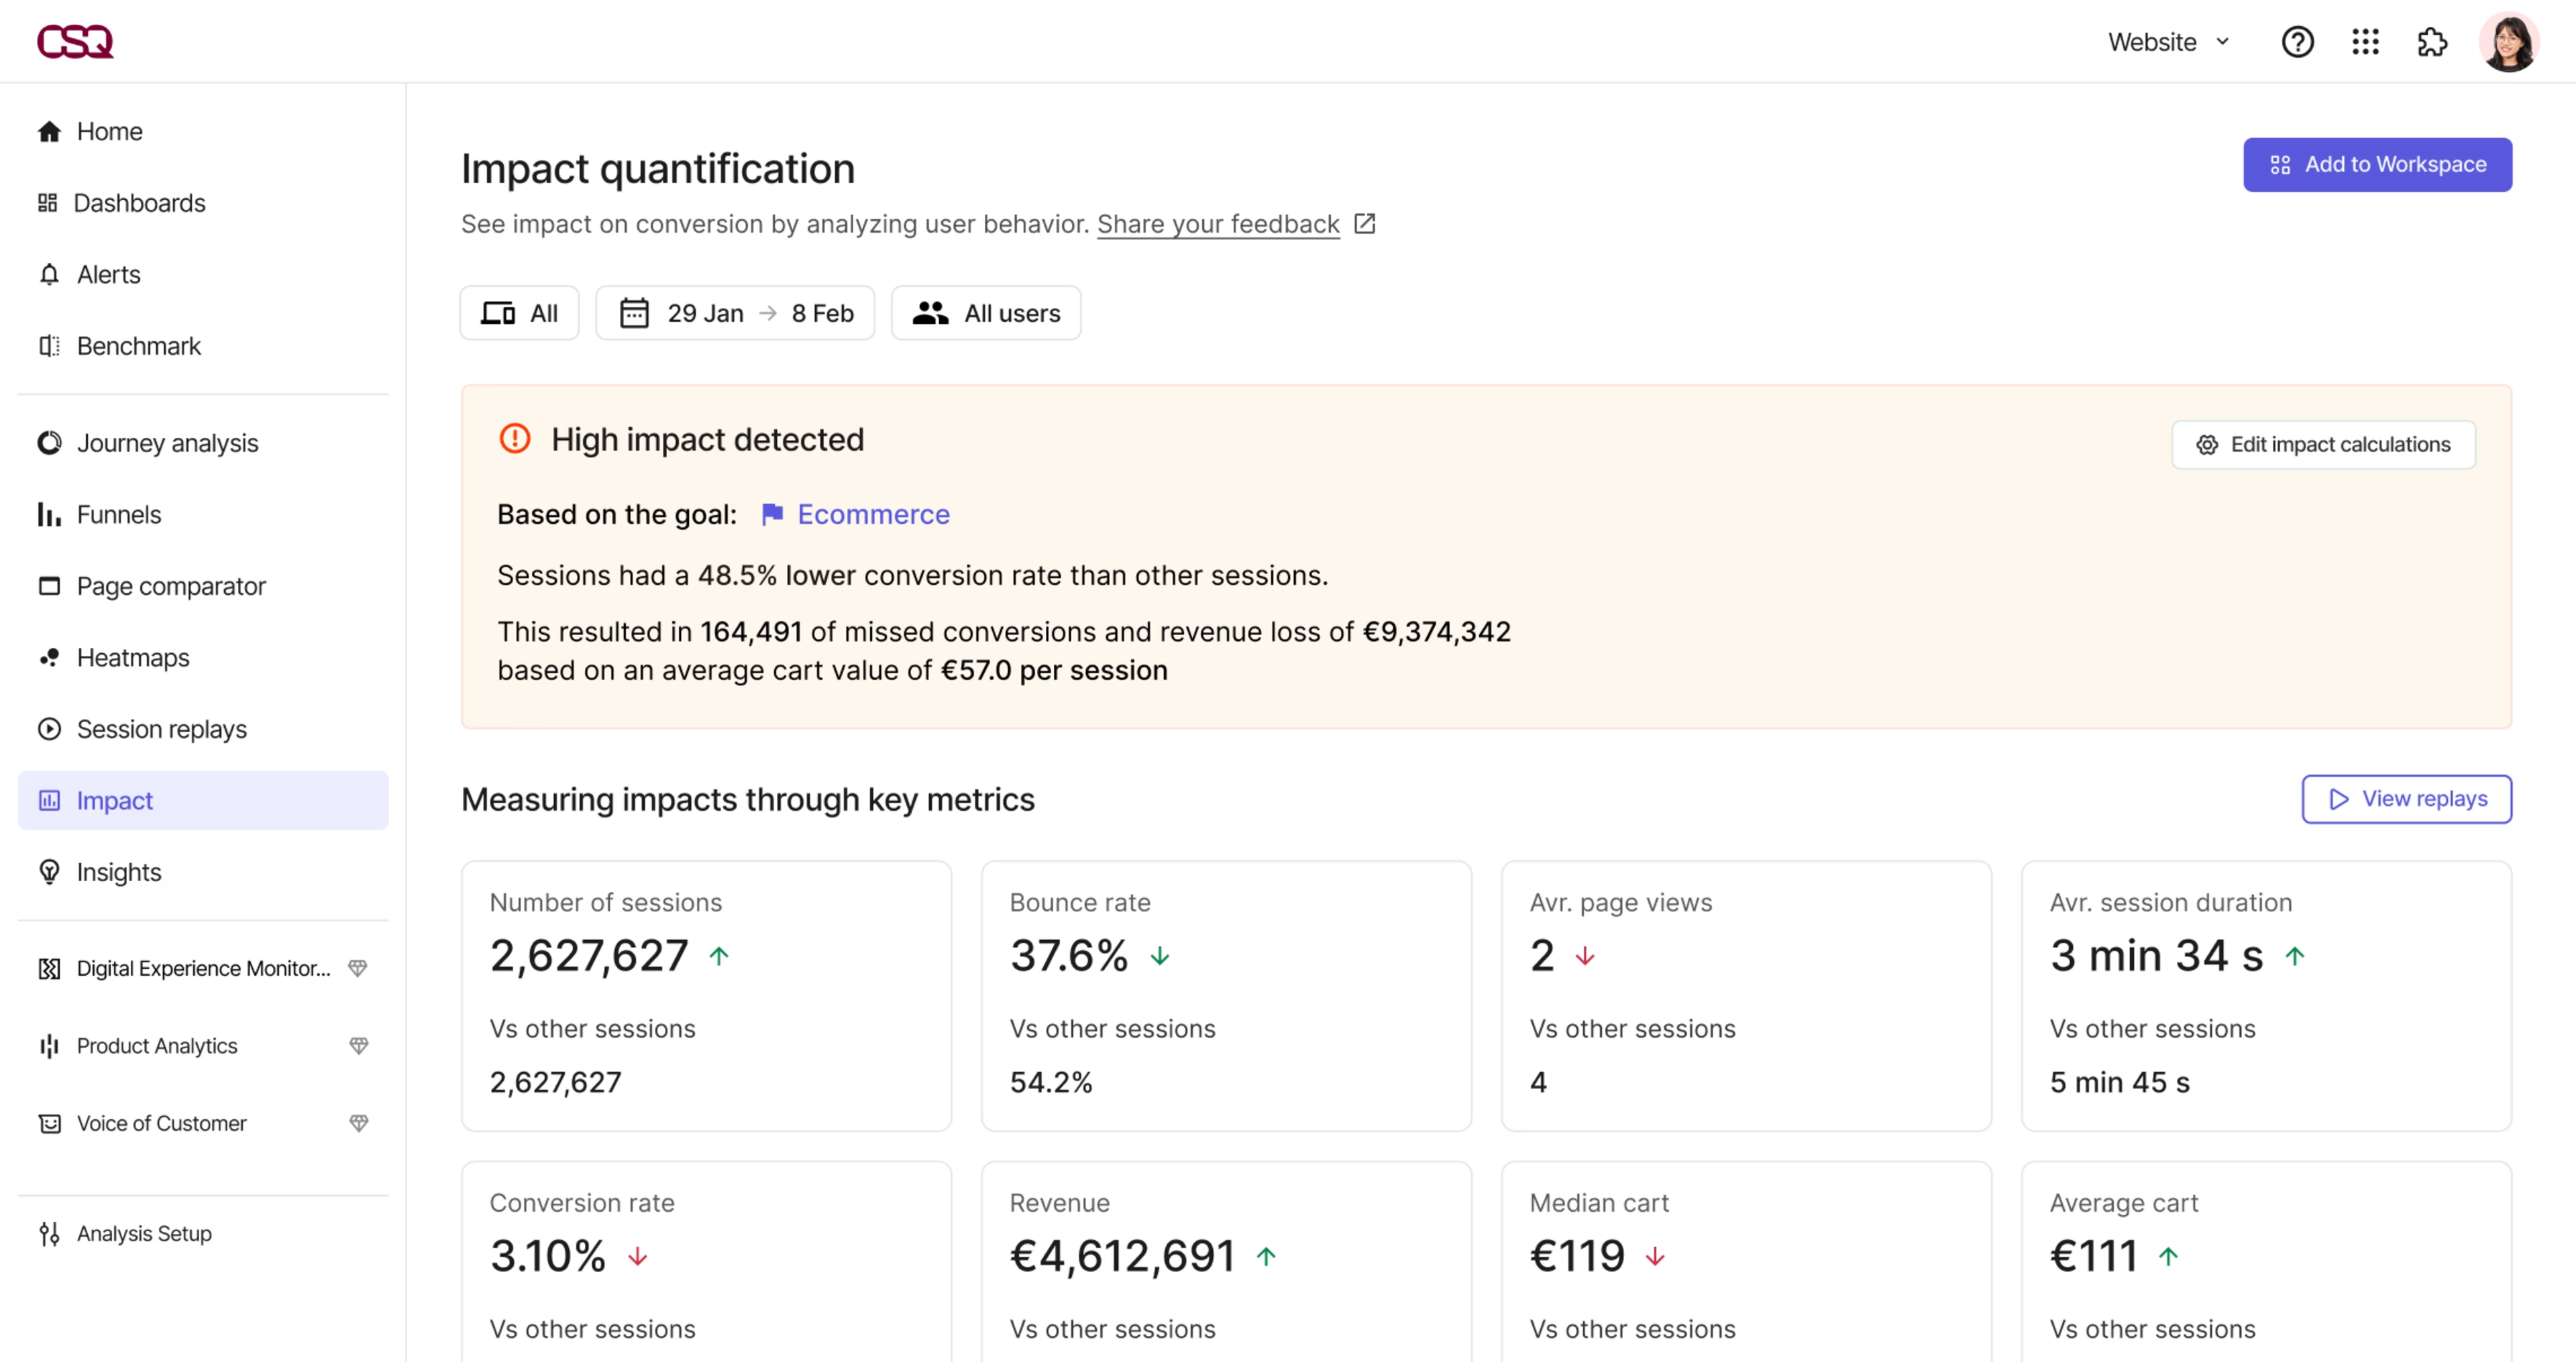
Impact Quantification puts a numerical value on your missed conversions and revenue loss from UX issues, helping you decide what to fix first
2 real-world examples of diagnostic analytics in action
Theory is great, but it’s even better to see diagnostic analytics in action. Here are 2 scenarios that digital teams face all the time—and how diagnostic analytics helps solve them.
1. Diagnosing a sudden conversion rate drop
Say a luxury apparel retailer experiences a 15% drop in add-to-cart conversions on its product pages. Their dashboards confirm the issue, but don’t explain why it’s happening.
🩺 The diagnosis: the company uses heatmaps to see that users are clicking repeatedly on the product image gallery, seemingly trying to zoom in or view additional angles. Session replay reveals that users are tapping and pinching the images, but nothing happens—the zoom functionality isn’t working. Frustrated users then scroll down, hesitate, and leave without adding items to their cart.
💡 The insight: a recent update broke the image zoom feature on mobile devices. Users can’t examine the product details closely, which is especially problematic for higher-priced items, where customers want to see quality before buying. Without that confidence, they abandon the page.
⭐ The result: the dev team fixes the zoom functionality and adds a subtle animation to indicate that images are tappable. Add-to-cart conversions recover and exceed the previous baseline by 8%.
2. Understanding form abandonment
Imagine a banking app sees 40% of users abandoning their account opening form at the exact same step. As a result, new customer acquisition suffers, but the team can’t figure out what’s wrong.
🩺 The diagnosis: our Session Replay tool shows users repeatedly clicking on a dropdown field that isn’t responding. Contentsquare’s Error Analysis tool, which helps you find and fix technical and non-technical errors on your sites and apps, confirms that JavaScript errors are occurring specifically for users on certain browser versions.
💡 The insight: a browser compatibility issue is breaking the form functionality for a big portion of their audience. Users think the app is frozen, so they give up and leave.
⭐ The result: the dev team patches the bug within 24 hours of identifying the underlying cause. Form completion jumps by 27%, and new account openings increase accordingly.
![Error Analysis - Features - Error Reporting [Fall Launch Update]](http://images.ctfassets.net/gwbpo1m641r7/5gRt3ajZ5OtGqgeJR9ZARh/4a169edcc964c064c96f434748fbe876/Error_Analysis_-_Features_-_Error_Reporting.png?w=3840&q=100&fit=fill&fm=avif)
Contentsquare’s Error Analysis helps you prioritize errors by missed opportunities
Stop guessing, start diagnosing
Diagnostic analytics transforms how digital teams work. Instead of reacting to problems with guesswork and hoping your fixes land, you identify root causes with confidence and measure the impact of every issue. But understanding the high-level concept of diagnostic analytics is just one piece of the puzzle. To get the full picture, you need to understand
Diagnostic analytics techniques: the specific methods you use to uncover insights
Diagnostic analytics tools: the capabilities to look for in your analytics stack to help you diagnose UX and performance issues
FAQs about diagnostic analytics
Diagnostic analytics is the process of analyzing your data to discover why problems or trends occurred. While descriptive analytics tells you what happened (‘bounce rates increased 19%’), diagnostic analytics explains why it happened (‘a pop-up is annoying users and preventing them from interacting with the page’). It helps you fix problems and optimize the user experience.

![[Visual] Contentsquare's Content Team](http://images.ctfassets.net/gwbpo1m641r7/3IVEUbRzFIoC9mf5EJ2qHY/f25ccd2131dfd63f5c63b5b92cc4ba20/Copy_of_Copy_of_BLOG-icp-8117438.jpeg?w=1920&q=100&fit=fill&fm=avif)