Compare Analytics Platforms and understand why Contentsquare stands apart
Most teams hit the same ceiling with: constant tagging maintenance, siloed tools, and insights that stop short of revenue impact. Here's an honest look at how Contentsquare compares and why 3,000 enterprise brands and 1.3+ million websites trust us.

✅ See the whole digital experience—end to end Capture what users do and why it happens with Journey Analytics, Session Replay, Heatmaps, Surveys, Feedback and Conversation Intelligence in one platform. Turn friction into clear actions that improve conversion, retention, and revenue.
✅ Retroactive analysis without the tracking headache Ask new questions after the fact with flexible exploration and high-quality capture. Reduce reliance on constant tagging changes and avoid blind spots when products and pages evolve.
✅ Enterprise-grade insights you can trust Built for scale with strong privacy controls and governance, reliable data quality, and collaboration workflows that help teams align and move faster—from product to UX to marketing.
Competition
❌ Fragmented view across point solutions
Many stacks split analytics, replay, and feedback across multiple tools—creating silos, duplicated effort, and slower time to insight.
❌ More setup, ongoing maintenance
Event schemas, tagging plans, and constant instrumentation updates can delay answers and make reporting harder to keep consistent over time.
❌ Harder to move from insight to impact
Insights can live in dashboards without clear next steps. Limited context, weak collaboration, or missing qualitative signals often slow prioritization and experimentation.
Tableau comparatif
Fonctionnalités | |  |  |  |  |  |  |
Replays de session |  | | | ⚠️ (variable) | | | |
Real User Monitoring (RUM) & Synthetic Monitoring | | ⚠️ (limité) | ⚠️ (limité) |  | | | ⚠️ (limité) |
Heatmaps | | | | ⚠️ (variable) | | ⚠️ (variable) | ⚠️ (variable) |
Journey Analysis | | | ⚠️ (limité) | ⚠️ (limité) | ⚠️ (limité) | ⚠️ (variable) | |
Funnels | | | (basique) | | | | |
Segments / cohortes | | | | | | | |
Analyse rétrospective (sans taggage préalable strict) | | | | ⚠️ | ⚠️ | | |
Product analytics (basé sur les événements) | | | ⚠️ | | | ⚠️ | ⚠️ |
Accent sur l'analyse de l'expérience digitale | | ⚠️ | | ⚠️ | ⚠️ | | |
Surveys et Feedback | | | ⚠️ (partenaires) | | | | |
Signaux de friction (rage clicks, dead clicks) | | | | ⚠️ | | | |
Impact des erreurs techniques sur les revenus (crashs, JS, API, etc.) | | ⚠️ | ⚠️ | | | | |
Session Replay pour application mobile | | | | ⚠️ | | | |
Contrôles de confidentialité et de masquage | | | | | | | |
Gouvernance d'entreprise et collaboration | | | | | | | |
Comprendre les comportements digitaux et agir rapidement
Visualisez les interactions utilisateurs et améliorez vos contenus pour maximiser l’engagement et les conversions.
Découvrir Experience Analytics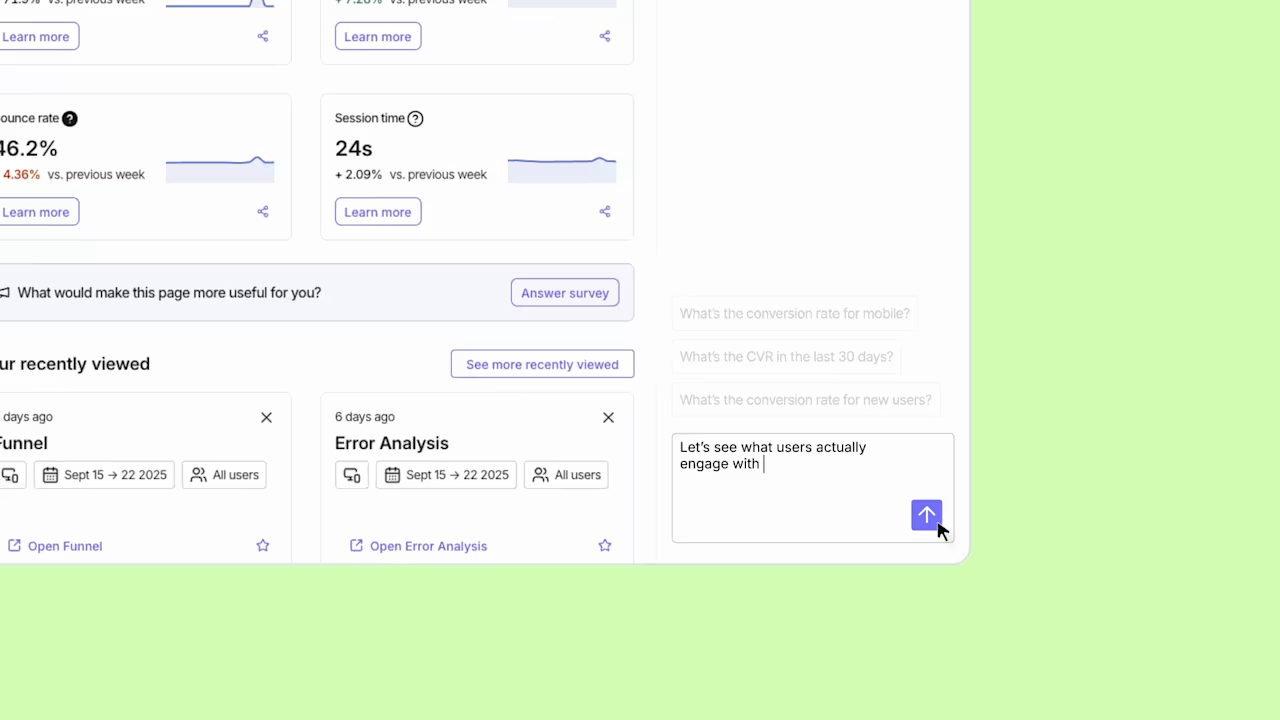


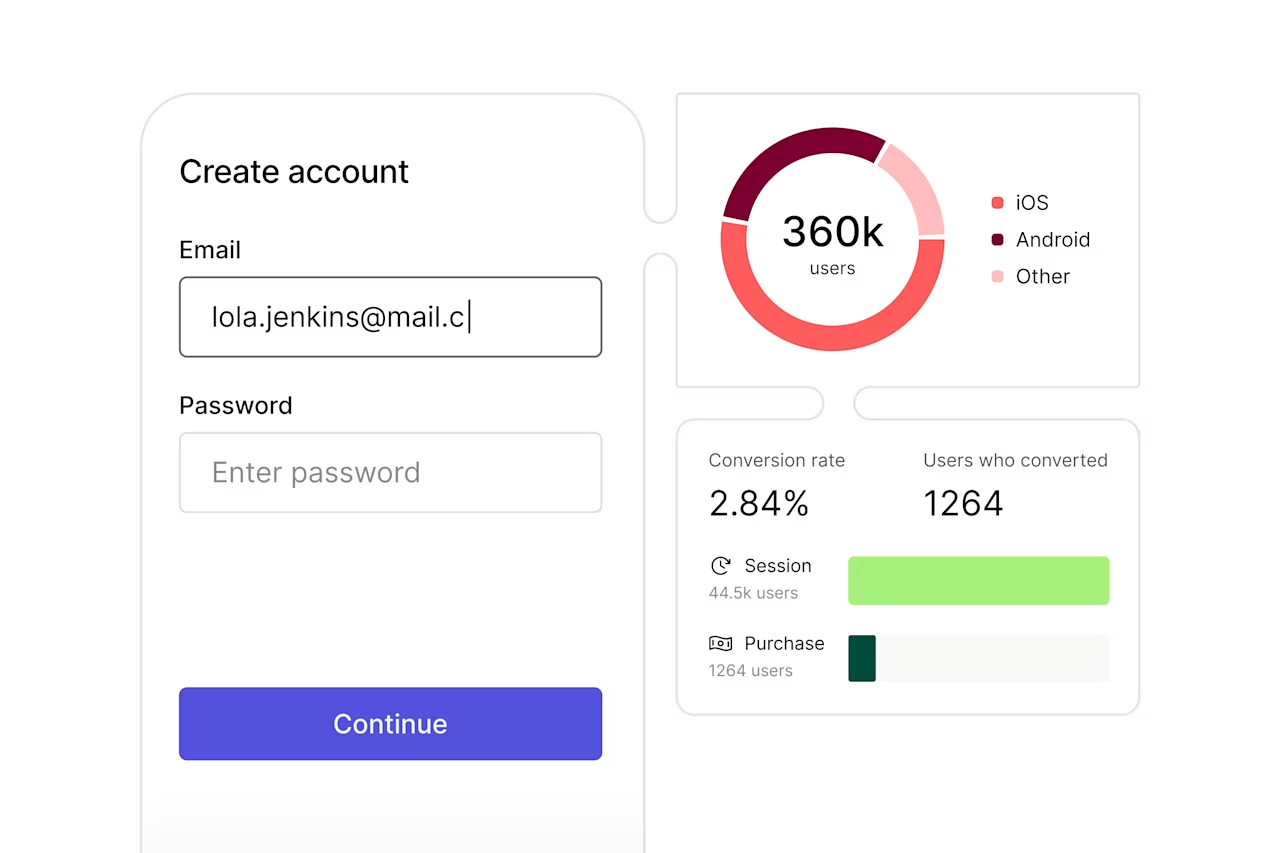


augmentation de 15 % du score d’analyse de l’assurance qualité (QA), passant de 85 % à 98 %
Frequently asked questions
Most tools tell you what happened. Contentsquare tells you why — and connects it to revenue. With autocapture, AI-powered behavioral analysis, and Impact Quantification, you get the full picture without the endless tagging work. Watch a free demo and see it for yourself!