
Key metrics
+20%
increase in website revenue
+404%
increase in landing page traffic
+138%
increase in single product revenue
The company
OLLY is an American vitamin and supplement brand with a mission to champion better well-being for all. OLLY is known for its bold branding and fun chewy gummies, which stand out from traditional supplement brands.
The ecommerce team at OLLY is responsible for driving direct-to-consumer (DTC) business growth and championing the fusion of technology and marketing to create seamless digital experiences.
The challenge
With a steady cadence of campaigns and product launches every year, Jennifer Peters, Director of DTC, Marketing Technology, and Digital Compliance at OLLY, and her team needed a way to better tailor landing pages and product detail pages (PDPs) to their customers—aligning experience with what shoppers expect, want, and need.
For Jennifer, understanding customer intent at every stage of the journey isn’t just a priority, it’s the foundation of her team’s approach.
As part of that mission, Mac Smith, Site Experience Manager at OLLY and a member of Jennifer’s team, says they needed a platform that “pulls back the curtain, giving us an exclusive look, at an elemental level, of what customers are actually doing and how they’re engaging with our DTC website.”
The solution
To better identify what truly drives value for customers, Jennifer’s team integrated Contentsquare’s Experience Analytics product directly into OLLY’s campaign and website optimization process.
They turn to Contentsquare to break down performance at a granular level, analyzing how users engage with every element on the page, including key signals such as frustration score and attractiveness rate.
One of my favorite things is the attractiveness score, which shows where we've missed out and where we've gone wrong. It’s such a great tool help us understand where the customer is on the page and what they like and don't like. Contentsquare has been a huge help for us to overcome our challenges.

By building the platform into their daily workflow, the team has gained invaluable insights that allow them to take the right actions to optimize campaign page performance.
“We leverage Contentsquare for both quick-win dopamine hits while its unique long-term data analysis makes the platform our BFF,” says Mac.
Here are 4 key examples of optimizations they’ve made using Contentsquare:
1. Increasing subscriptions on PDPs
The subscription option on OLLY’s PDPs is a key action for OLLY’s consumers to take and Jennifer’s team wanted to know more about how customers were interacting with it.
Contentsquare’s Zone-based heatmaps showed a high exposure rate (51%) on the ‘Subscribe & Save’ selection, but its tap rate was low, at just 1.15%. The tap rate on the delivery section was also low at 0.91%.
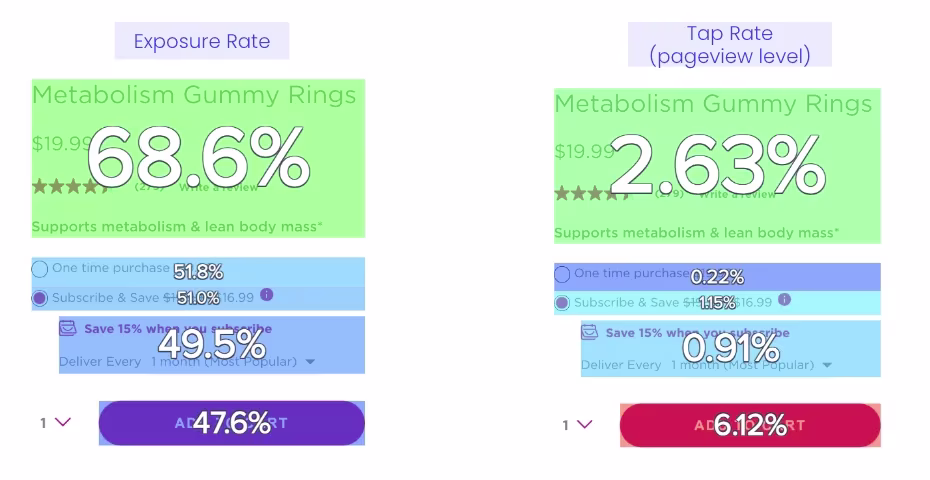
Heatmap analysis of OLLY's subscribe & save section showing exposure rate (left) and tap rate (right)
Further analysis revealed a 1.82-second hesitation time on the subscription delivery option, indicating users weren’t immediately clear on its value.
In response, the team updated the PDP copy to highlight subscription details and discounted pricing, while adding a small information icon that opens a pop-up for additional context.
This approach makes the value of subscribing clearer to the customer without cluttering the PDP or pulling users away from the path of conversion.
![[Asset] Customer story - OLLY - Sleep product page](http://images.ctfassets.net/gwbpo1m641r7/33zNDZEyYGdhJ1CWhOc3e9/5f679e0985e5f7bc57bd445cc00aa851/OLLY_Sleep_Product.png?w=512&q=85&fit=scale&fm=avif)
2. Optimizing high-conversion landing pages
Next, the team turned their attention to OLLY’s top-performing Fitness landing pages. Using Journey Analysis, they identified a high exit rate, despite these pages also delivering strong performance, with a 2.39% conversion rate.
![[Asset] Customer story — OLLY — high exit rate](http://images.ctfassets.net/gwbpo1m641r7/6YyHTqnIoySc4B6Vmnf75C/5993590a95d53413edded2f8e2cbbcae/Growing-new-product-categories-on-Fitness-landing-pages.png?w=588&q=85&fit=scale&fm=avif)
To understand what was happening at page level, they used Heatmaps to discover OLLY’s Workout gummies and Tin Deal drove the highest revenue and engagement, but had low exposure (40% or less).
![[Asset] Customer story — OLLY — Heatmap workout gummies](http://images.ctfassets.net/gwbpo1m641r7/39BFG9XKxtJ7FIxOeklcH0/85917e0463983a26142ba34bd476cc49/Growing-new-product-categories-on-Fitness-landing-pages-2.png?w=1053&q=85&fit=scale&fm=avif)
Armed with these insights, the team reorganized the page layout by moving Workout gummies and the Tin Deal higher up and introducing CTAs earlier the page to better support conversion.
Customers vote with their wallet. They vote with their behavior, and you have to be able to react to that quickly and not put your own preferences and bias ahead of what the customers are actually telling you.

3. Rethinking the homepage hero to drive impact
When OLLY launched 2 major homepage campaigns promoting Women’s Wellness and Gut Health, they turned to Contentsquare to see how these two campaigns performed with their customers.
As the brand’s hero category, Women’s Wellness occupied the primary homepage slot, with Gut Health positioned in the secondary space below.
To understand how customers were interacting with both campaigns, the team used Heatmaps to quantify engagement across the homepage experience.
While Women’s Wellness delivered the expected strong click-through performance in the hero spot, deeper analysis revealed a more surprising pattern. The attractiveness metric, which measures click behavior across pageviews and sessions and click distribution and rate, showed Gut Health was generating strong engagement.
![[Asset] Customer story - OLLY - Women’s Wellness and Gut Health](http://images.ctfassets.net/gwbpo1m641r7/IdCXfknPy8iNbQENXtXky/ac2bb67b237ed9791ac74547049f653c/OLLY_page.png?w=512&q=85&fit=scale&fm=avif)
This insight prompted the team to ask: what would happen if they promoted Gut Health to the primary hero position? They swapped the homepage hierarchy around and the impact was immediate:
+404% increase in traffic to the gut health landing page (compared to previous 2 weeks)
+167% increase in related PDPs sessions on Big 10 Probiotic, a product featured in the Gut Health collection page
+138% increase in revenue for their Supergood Superfoods product, which was shifted higher due to higher engagement
Without Contentsquare’s real-time insight, this would have been a missed opportunity to speak to our Customers’ actual vs perceived needs and dynamically optimize their shopping experience.
![[Asset] Customer story - OLLY - Mac Smith Headshot](http://images.ctfassets.net/gwbpo1m641r7/1rTjSr9okiJSQpdSb8RVdu/d37e7059ed06dc2deaace121a47f36f2/Smith.jpg?w=72&q=85&fit=scale&fm=avif)
4. Using behavioral data to launch and optimize a new product range
OLLY recently expanded its product offering into Personal Care, introducing a new category of 10 unique products.
As a new launch, the team needed real-time visibility into how each PDP was performing, with a focus on what was attracting and frustrating customers.
To do this, they used Contentsquare’s Site Performance dashboards template to:
Monitor performance across the new PDPs
Track behavior across mobile and desktop
Identify which products and scents were driving the strongest engagement
Track traffic, bounce rate, conversion, and revenue performance from advertising channels
Keep close eye on page load times, given the large volume of information at PDP level
These insights all fed into a week-on-week performance report that directly informed the product strategy: the most-clicked and most-purchased items were shifted to the top of the collection page to ensure the experience reflected customer demand.
Ultimately, Contentsquare builds a full picture and answers a vital question: What are customers actually doing vs. what we anticipate they’ll do? This analysis and insight helps us be nimble, adjusting and optimizing strategy immediately and over time.
The results
With Contentsquare, the brand has been able to improve its user experience, seeing a significant boost in business results, including:
+20% website increase revenue (month over month)
+3% increase in average order value (AOV)
+404% increase in landing page traffic and a +138% increase in individual product revenue due to homepage optimization
Beyond the numbers, Contentsquare enables OLLY to turn customer insights into optimization opportunities for both quick wins and long-term strategies. It empowers the team to move faster, make data-driven decisions, and deliver experiences that reflect what their customers want.