
![[Asset] Hotjar/heap/Contentsquare](http://images.ctfassets.net/gwbpo1m641r7/1ueoMEqNMJT9VRlSe3YiYb/c25abf4ed3f67bb861c60203465689fe/CSQ_-_CoBrand_-_Desktop_-_Light_Mode.png?w=3840&q=100&fit=fill&fm=avif)
This customer story was originally published on Hotjar.com and reflects the customer’s experience with its product offering. Following Hotjar's integration under the Contentsquare legal group, this customer story has been migrated to this site [Contentsquare.com] as part of our unified content experience.
When you notice a change in conversions, where do you start looking for clues? How do you figure out what’s wrong so you can fix it?
For eShopWorld, the first step is to study user feedback submitted through Surveys. Then they dig even deeper...
How eShopWorld enables global e-commerce brands to maximize conversions
E-commerce companies face all kinds of challenges when growing their business internationally (with customs, currency exchange, fraud prevention, and more), and eShopWorld helps them overcome those barriers... but that’s not all they do!
eShopWorld also helps their clients with Conversion Rate Optimization (CRO), and Noelle Smith is the Conversion Analyst on the front lines. When she notices a change in conversion for one of their clients, she turns to Hotjar by Contentsquare.
Before they began using the platform, however, eShopWorld had one major concern: would the platform actually do what it’s supposed to do?
Functionality was the top concern for Noelle and the Product Management team at eShopWorld. Hotjar by Contentsquare made some bold claims, but could they deliver? In the end, Surveys, Heatmaps, and Session Replay delivered the results that Noelle and her colleagues were hoping to see.
"Once we were happy that Hotjar by Contentsquare could meet our requirements, and we had sought and received agreement from our partners, there was no obstacle that precluded our use of the system," says Noelle.
How eShopWorld typically assesses conversion fluctuations (in 4 steps)
Step #1: study data from Surveys
Surveys lets you comfortably place a feedback collection button in the margins of any webpage. This allows website users to leave open-ended comments about their experience.
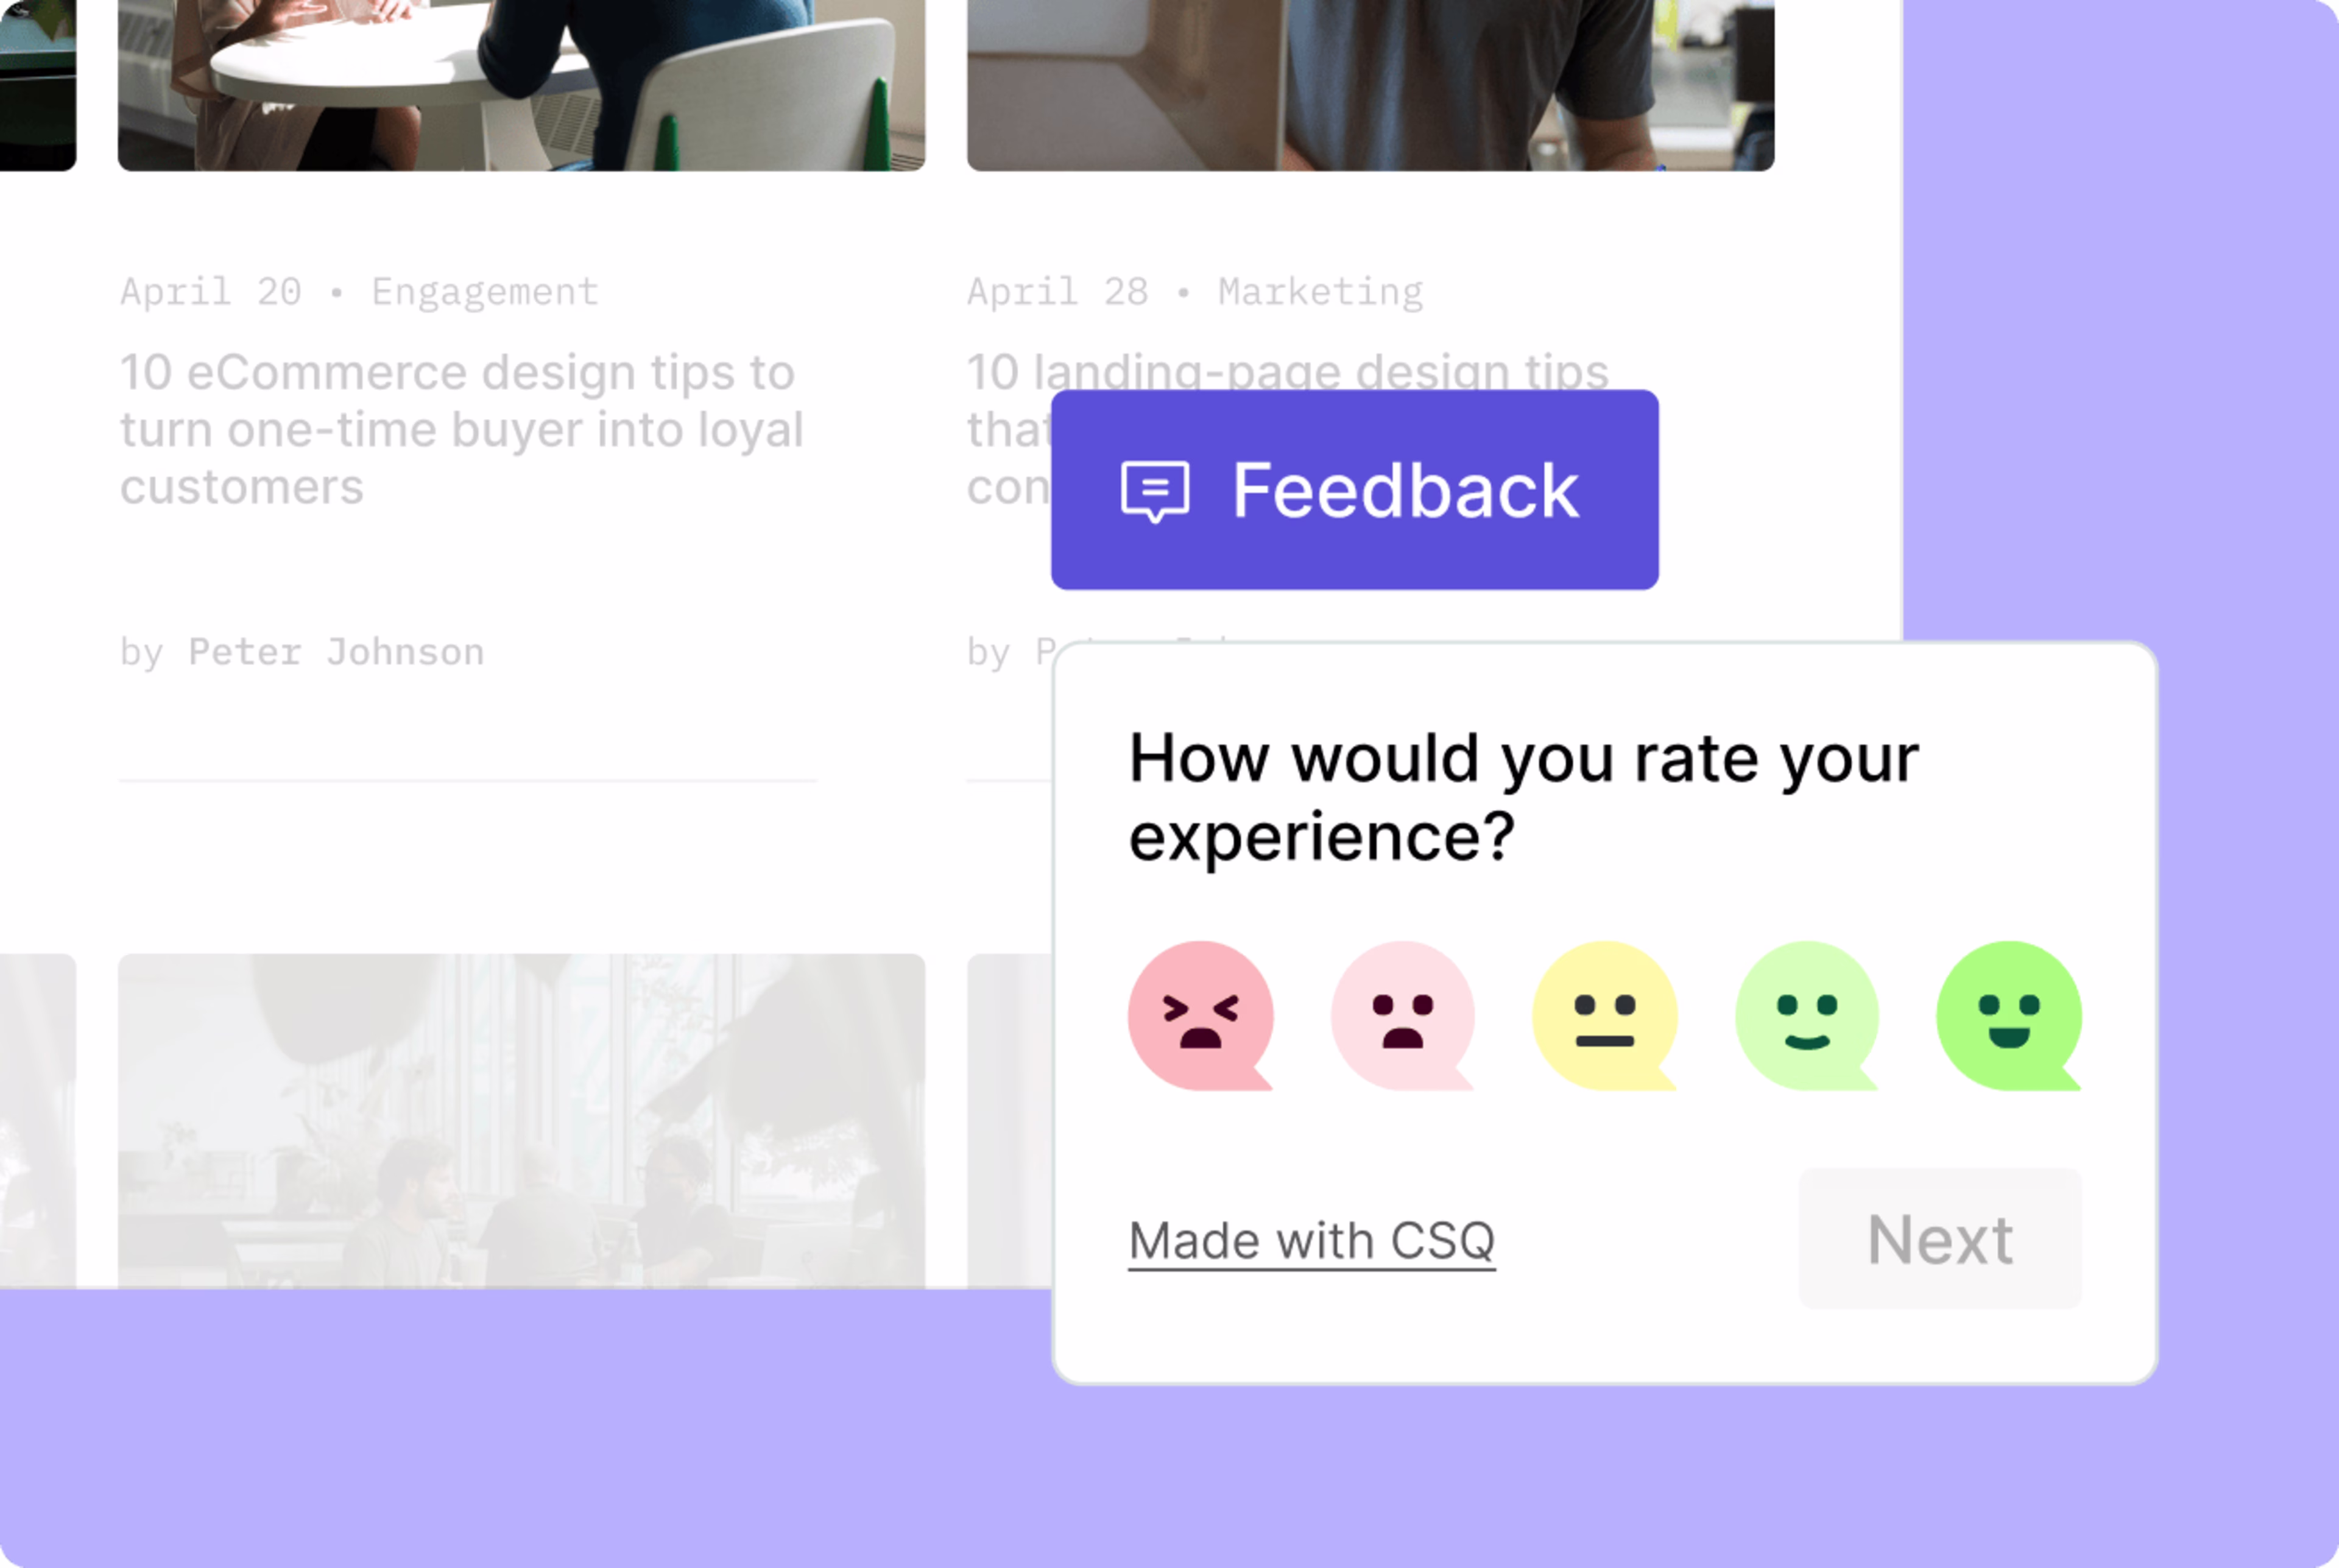
We love Surveys because it gives us instant feedback from shoppers. It doesn’t interrupt the checkout flow, and it allows us to fully understand our shopper’s experience, in real-time. This helps us study performance trends and identify shopper concerns.
Step #2: study Google Analytics + Session Replay
If Noelle sees a trend of comments from users highlighting an issue, she digs deeper, using Google Analytics and Session Replay to figure out what’s going on.
First, the team looks at the aggregate data in Google Analytics to pinpoint which customer segments are affected (e.g., customers from certain countries, those using certain browsers, those using specific mobile devices).Then, once they’ve identified which users segments are in play, they look at individual session replays and see how shoppers behaved. Where did they click? Where did they not? Where was the point of friction?
When I narrow down the issue to a specific device, browser, or version, I can go into Hotjar by Contentsquare and look at the Session Replay. From here, I can see what our shoppers are doing in order to completely understand the point of friction.
Step #3: study Heatmaps + make changes
Heatmaps provide further insight into aggregate customer behavior at the checkout, and they help Noelle articulate any changes she submits to the Product team for testing. By seeing the aggregate scrolls and clicks, she can easily demonstrate the nature and magnitude of the problem.
Step #4: return to Heatmaps to see whether the changes worked
The final step is to see the effect of the changes made, so eShopWorld looks at the ‘before’ and ‘after’ picture that Heatmaps paints. If their changes aren’t having the intended effect, they investigate further.
Hotjar by Contentsquare has been a valuable tool for our analysis, and the insights we have learned about shoppers have been highly beneficial. I recommend it to anyone who cares about customer experience and values how their audience spends time on their site.
FAQ about Hotjar by Contentsquare
Hotjar is now officially part of Contentsquare. By joining forces, we’re building a single, powerful platform for experience intelligence—designed for teams of every size, across every stage of growth. Learn more here: https://contentsquare.com/hotjar/