![[Visual] Stock Website Conversions Blog](http://images.ctfassets.net/gwbpo1m641r7/2rVeNuG0ooadj9K0aBdjXD/d3d14906ef74dcdef8140c73605b46eb/AdobeStock_673731153.png?w=3840&q=100&fit=fill&fm=avif)
When you think about website conversions, you might think about percentages and averages that measure key metrics like completed orders, subscription upgrades, and click-through rates.
But what do those metrics actually tell you about your customers—the people you want to captivate, engage, and persuade?
If you don't understand what website conversion metrics mean for your business—or how to translate them into actionable steps to improve your product or service for your customers—the only purpose they’ll serve is to report isolated numbers and percentages.
To understand (and increase) website conversions, start by understanding your users: what drives them to your site or product in the first place, the blockers and pain points they experience, and the hooks that persuade them to take action.
Instead of focusing on the final outcome—the conversion itself—focus on what happens before: the user experience (UX).
What is website conversion?
A website conversion happens when a user completes a desired action on your website, like making a purchase or filling out a lead generation contact form. Every business website is built to generate conversions.
There are two types of website conversions:
Micro-conversions happen when a step toward your end goal is achieved, like subscribing to a newsletter, downloading an ebook, or watching a product video (i.e. events that occur before a macro-conversion).
Macro-conversions happen when your end goal is achieved, such as a sale, a new paid subscriber, or a completed contact form.
Some examples of how micro-conversions contribute to macro-conversions include
Macro-conversion: making a purchase
Micro-conversions: interacting with a TikTok video, downloading product information, entering card details
Macro-conversion: completing a registration of signup process
Micro-conversions: landing on the registration page, starting to fill out the form, verifying contract information
Macro-conversion: subscribing to a service
Micro-conversions: taking a free trial, reading terms and conditions, requesting more information
![[Visual] Micro-vs-macro-conversions](http://images.ctfassets.net/gwbpo1m641r7/5n3Blau76UA4gljelm4GDy/c8f1895b1e5a9196328041b4d7ac7293/Micro-vs-macro-conversions.png?w=1920&q=100&fit=fill&fm=avif)
How to calculate website conversion rate
To calculate your conversion rate, divide the number of conversions (desired actions taken) by the total number of visitors, then multiply by 100 to get a percentage.
For example, if your web page had 17 sales and 500 visitors last month, your conversion rate is 17 divided by 500, multiplied by 100 = 3.4%
What’s a good conversion rate?
Conversion rates vary depending on your
Type of industry (such as ecommerce, SaaS, information technology, consumer goods, finance)
Target audience demographics (such as age, income, occupation)
Conversion goal (such as ad clicks, checkout completions, newsletter subscriptions)
Depending on the factors above (and the sources you consult), a good conversion rate can range from 2% to 5%.
Looking up industry averages may give you a useful benchmark to start from, but you’d be much better off developing an understanding of what’s actually happening when your users interact with your website and how you can improve the user experience. If you can do this, conversions will follow.
3 steps to improve website conversions
Sometimes the secret to conversion rate optimization (CRO) is as simple as changing the colors of your call to action (CTA) button, using a larger font for main messaging, or having fewer fields in your sign-up forms.
Minor improvements to your site or product are beneficial, and those tweaks may result in a small and temporary uplift to your conversion rates—but if you want to improve your conversion rate in a more meaningful, significant way, you need to look at the big picture.
You need to discover what your users really want, and then give it to them.
You can do this in 3 steps:
1. Find what drives people to your website
To convert your website visitors, you need to understand what they want and care about, and, in particular, what drives them to your website or product in the first place. Besides looking at website traffic metrics, one of the best ways to find out is to ask visitors to describe what brought them to your site and what they’re looking for—in their own words.
Place an on-site survey on a high-traffic page: ask your visitors to introduce themselves, tell you why they’re visiting your site, and whether anything is stopping them from taking action.
💡 Pro tip: ask different survey questions at each stage in the customer journey to gain valuable insights and improve the user experience. With Surveys in Contentsquare, you can embed a survey on key pages or trigger them after specific events to capture in-the-moment feedback.
Choose from our library of over 40 pre-built survey templates, or let the AI assistant create one from scratch based on your research goal. Then, get an auto-generated report that provides key findings and sentiment analysis.
![[Visual] AI survey report](http://images.ctfassets.net/gwbpo1m641r7/33SvScLBCg3qC7XNcyS6EP/78f8e35c77f65ff511fd5459c686cfe4/Screenshot_2025-01-10_at_16.41.35.png?w=1920&q=100&fit=fill&fm=avif)
Create, launch, and analyze surveys in minutes with Contentsquare’s AI assistant
2. Find what might stop potential customers from converting
After discovering what drives people to your site, it’s time to identify the barriers that stop potential customers from converting. Use an analytics tool to review engagement metrics (like bounce rate) and identify poorly converting pages, then draw on insights gained from user behavior analytics tools like:
Heatmaps
Look at heatmaps to see how users click, tap, move, and scroll, showing you where they spend the most (and least) time on your low-converting pages. Heatmaps in Contentsquare even capture rage clicks to help you uncover points of friction—like non-clickable text or a broken page element—that stop visitors from converting.
For railway operator Thalys, using heatmaps to analyze homepage performance uncovered some major insights, highlighting low exposure rates and confusing messaging. With these insights, they were able to make data-driven improvements that delivered a 500% increase in conversion rate, going from 2.9% to 17.4%.
![[Visual] heatmaps back into action](http://images.ctfassets.net/gwbpo1m641r7/1IqiRyF8JXAyYNnXT3LMyQ/32815c373967d53f2e9e84f400e23830/CSQ-heatmaps.png?w=3840&q=100&fit=fill&fm=avif)
Heatmaps in Contentsquare give you an aggregated view of where users engage with your site—and where they don’t
Session replays
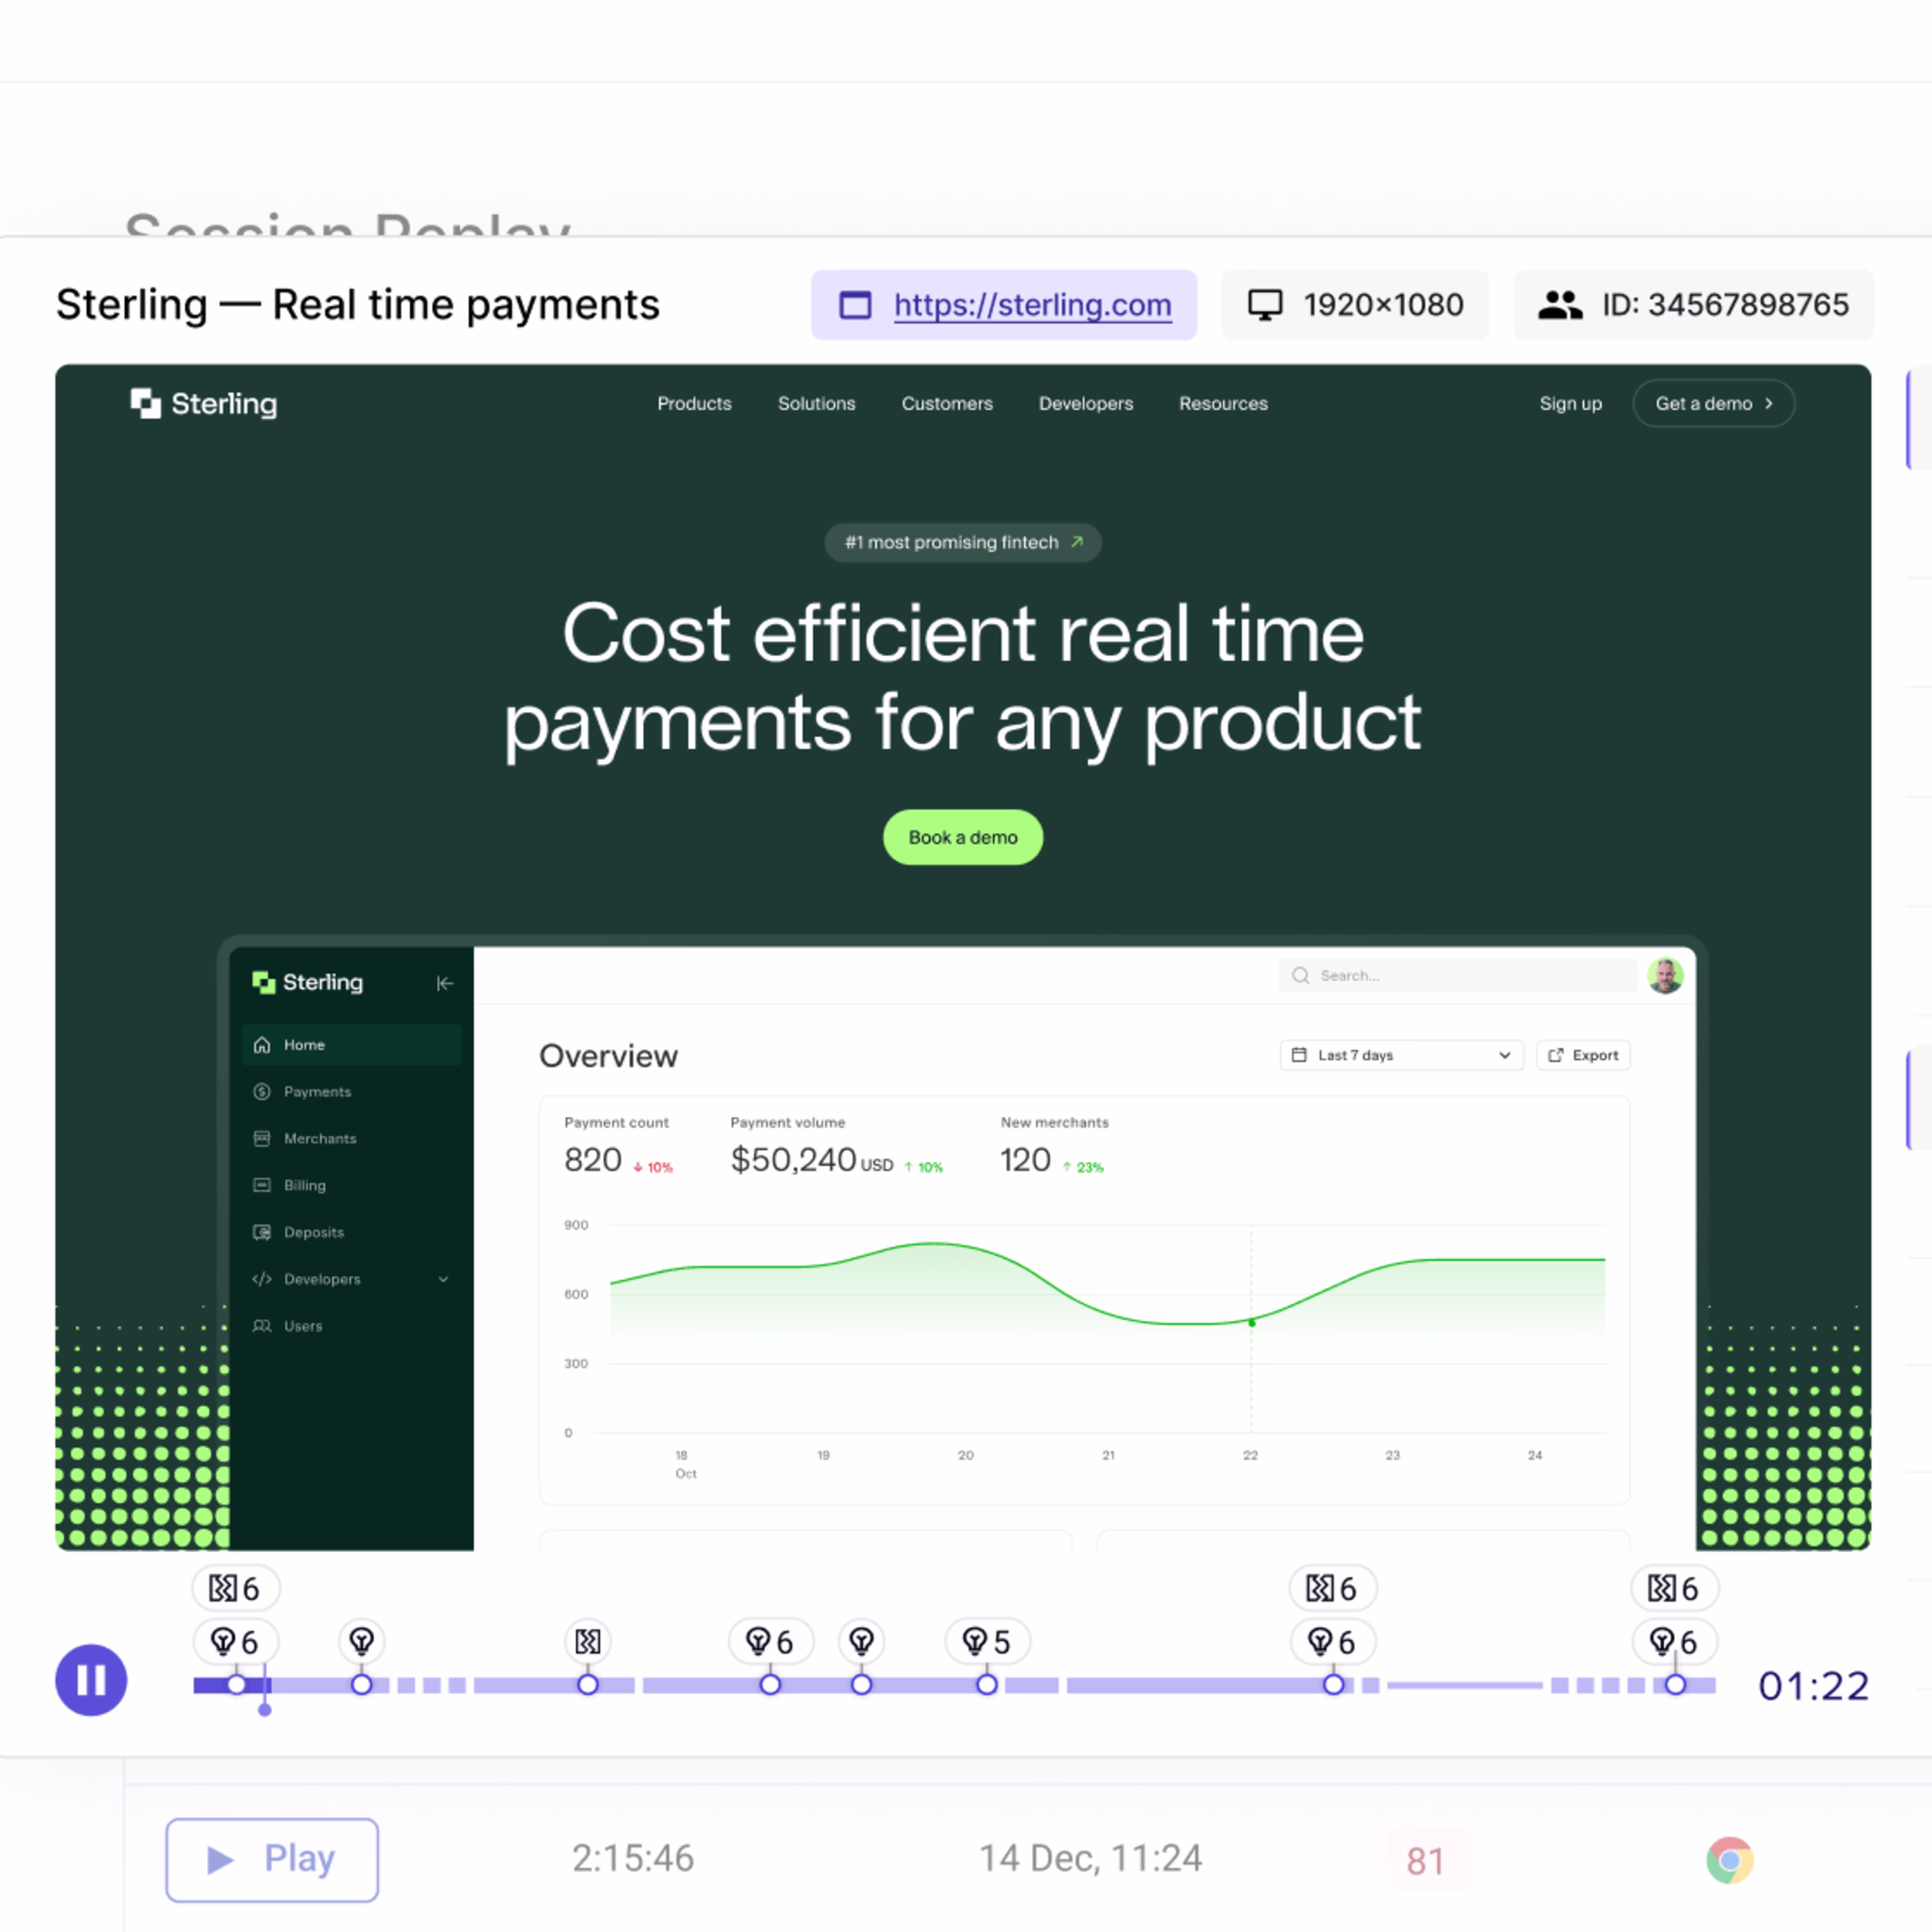
Watch session replays (also called session recordings) of under-performing pages to see how users experience and interact with your site, from homepage to product page, so you can uncover more UX design issues or blockers like website bugs. Seeing people struggle to use your site in real time helps build empathy for your customers and puts you in the right mindset for coming up with creative UX solutions.
With Session Replay in Contentsquare, you can filter your session recordings to look at specific user segments—for example, users who exit your site from a particular page, users who come from a particular country, or users who follow a specific journey.
💡 Pro tip: use Error Analysis in Contentsquare to quickly find issues that need your attention, then jump to associated session replays with a click to see exactly what happened.
Watch playbacks of users navigating your site with session replays to spot issues and see the the experience through their eyes
User feedback
Place a feedback widget on your problem pages, and let users tell you about their experience. Giving visitors an opportunity to share their feelings while interacting with your site gives you digestible, quantifiable Voice-of-Customer (VoC) feedback that you can use to lobby for new features or redesigns.
With an unobtrusive feedback widget like Contentsquare’s, visitors can rate their experience with a simple emoji, or they can go into more detail by writing a comment, highlighting specific page elements, or leaving their email address for follow-up communication.
![[Visual] Feedback button - How would you rate your experience](http://images.ctfassets.net/gwbpo1m641r7/6zpie5F6Gwd4oyqXaxBfcN/b7e9b7f3bfcc6265f47b5294d8fec319/Feedback_button.png?w=3840&q=100&fit=fill&fm=avif)
Contentsquare’s feedback widget lets you collect reactions as users browse
💡 Pro tip: if you get a juicy piece of feedback or an interesting survey response, watch the related session replay to put it into context. Want to get really in depth? In Contentsquare Voice of Customer, Surveys and Interviews are automatically connected: invite the respondent to a user interview to discuss their answers in more detail.

Follow up on feedback or survey responses by inviting the user to an interview to learn more
3. Find what persuades visitors to act
Knowing what attracts people to your site (and what drives them away) will only get you so far—you’ll also want to know what persuades visitors to go from browsing to buying.
To find out what does and doesn't work, set up a post-purchase survey to ask customers who've just converted what persuaded them—and what almost stopped them!—along the buyer’s journey. Ask questions like:
How would you rate your overall experience?
What can we do to improve the experience?
What did you love most about the experience?
What almost stopped you from completing the purchase?
You can also use a Net Promoter Score® (NPS®) survey to find out how likely they are to recommend you to a family member or friend. You can even adapt the feedback you collect into case studies or testimonials on your site to build social proof and reinforce trust in your business.
💡 Pro tip: it’s good practice to verify the opinions and suggestions collected from users before making any permanent changes to your site. Try A/B testing different sales funnel iterations based on feedback insights, then dig into data from heatmaps, session replays, and impact quantification to see which versions actually lead to more conversions.
![[Visaul] Heatmaps - Compare side-by-side split test](http://images.ctfassets.net/gwbpo1m641r7/2Ein9swgZpRQoaIyt4o6zy/150e2d37a0ff5ae370e569cca2ac4092/Heatmaps_-_Compare_side-by-side.png?w=3840&q=100&fit=fill&fm=avif)
Why should you measure conversion rate?
Conversion rates can tell you a lot about your website and product beyond just revenue: they demonstrate customer satisfaction levels and expose weak spots in your website’s performance and user experience.
To find out what your customers want and need from your business, you need to understand who they are and what they like (or don't like) about your site or product. Website conversions can help you understand both your customers and the user experience. For example:
A low conversion rate might indicate a poor user experience, so you'll need to investigate and uncover the pain points and blockers your users are experiencing: a low-converting product page could suggest that you need to further explain or clarify your product's benefits to your users.
A high conversion rate probably means you're doing something right (yay!), so you might want to try replicating that success elsewhere on your site: look at the placement, phrasing, and design of the CTA on a high-converting landing page to illustrate how you successfully persuaded your audience to convert.
Empathize with your users to increase your conversions
When you know how your customers experience your site or product and can identify what works (and what doesn't), you can prioritize changes and optimizations to better connect with your audience. Ensuring the user experience runs smoothly and meets their needs while sparking customer delight will lead to happier customers—and higher conversion rates.
FAQs about website conversion
Your conversion rate is the number of conversions you achieve divided by the total number of visitors to your website, multiplied by 100 to get a percentage.
For example, if your website generates 40 sales from 1,000 visitors, your conversion rate is 40 divided by 1,000, multiplied by 100 = 4%.
![[Visual] Contentsquare's Content Team](http://images.ctfassets.net/gwbpo1m641r7/3IVEUbRzFIoC9mf5EJ2qHY/f25ccd2131dfd63f5c63b5b92cc4ba20/Copy_of_Copy_of_BLOG-icp-8117438.jpeg?w=1920&q=100&fit=fill&fm=avif)
We’re an international team of content experts and writers with a passion for all things customer experience (CX). From best practices to the hottest trends in digital, we’ve got it covered. Explore our guides to learn everything you need to know to create experiences that your customers will love. Happy reading!