
Imagine you’re running a brick-and-mortar store. From your perch at the counter, you can see and fix any issues the customers have as they move around the shop: if they have trouble navigating the aisles, you can make adjustments and help out; when they come up to the counter, you can strike up a conversation and learn who they are and what they’re looking for.
A website doesn’t work like that. You can’t really see people as they wander through your site pages, and you can’t informally chat about their impressions during checkout. Your access to your users is limited, and you may have a hard time understanding user behavior or knowing what users want.
That’s where studying user behavior via user behavior analytics (UBA) comes in, giving you a window into the user experience you wouldn’t have otherwise.
What is user behavior?
User behavior encompasses all the actions visitors take on a website: where and what they click on, how they scroll down a page, where they stumble, and where they eventually drop off the page and leave.
Tracking user activity and conducting user behavior analysis gives you an inside look at how people interact with your site and what obstacles or hooks they experience in their journey as your customers.
What is user behavior analytics (UBA)?
User behavior analytics (UBA) is a method for collecting, combining, and analyzing quantitative and qualitative user data to understand how users interact with a product or website, and why.
When you want an answer to pressing business questions such as “Why are people coming to my website?” or “Why are they leaving?”, traditional analytics on its own can tell you what is happening, but can’t give you any of the ‘whys’. That's where user behavior analytics comes in, with tools that help you get a full picture of user needs and behavior.
Note: UBA (user behavior analytics) is sometimes confused with UEBA (user and entity behavior analytics), which focuses more on cybersecurity and data protection than conversion rate optimization; and behavior analytics is sometimes confused with behavioral analytics, which focuses more on predicting user behavior than improving the user experience (UX).
User behavior analytics tools to understand and empathize with real users
Session replays
Session replays are video-like playbacks that show you exactly how real users navigate and engage with your site. They’re invaluable for customer behavior analysis because they provide vital context that’s missing from numbers alone, showing you why users took the actions they did.
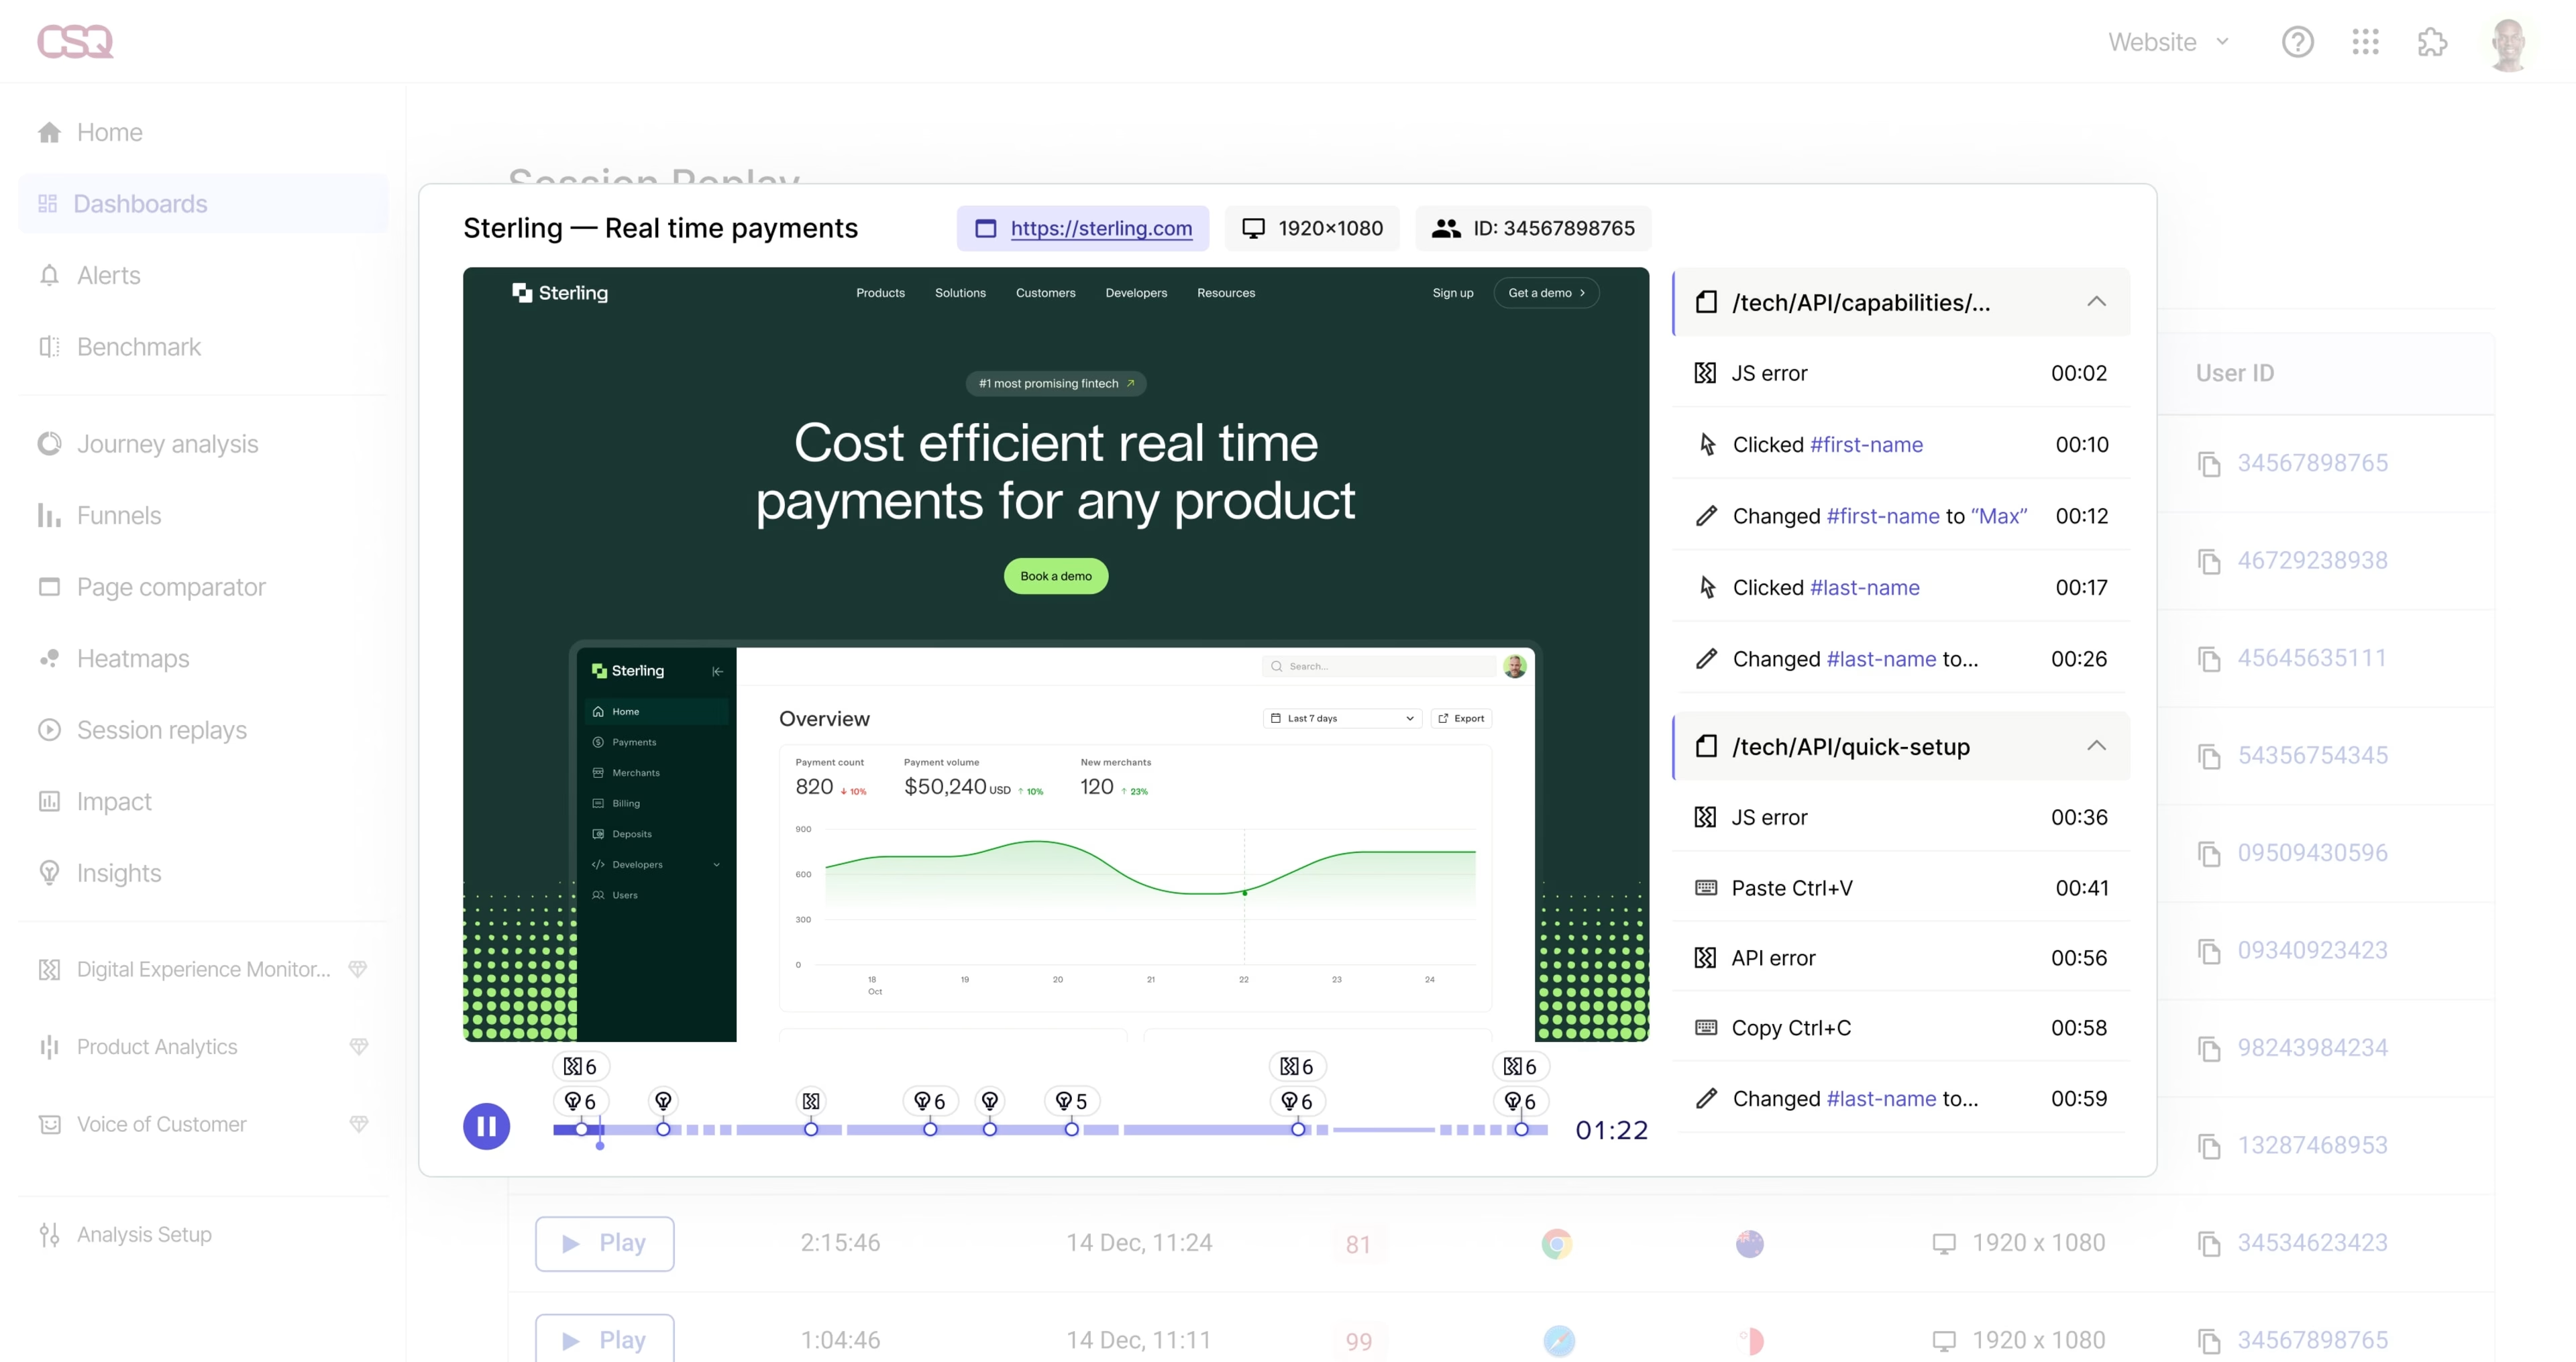
Session Replay in Contentsquare lets you watch real users navigate your site, helping you spot areas of friction and identify improvement opportunities
Heatmaps
Heatmaps are aggregated, color-coded visualizations of where users click, tap, scroll, and move to on your page. They reveal which elements catch—or lose—customers’ attention, so you can see which buttons, calls to action (CTAs), videos, and other clickable assets perform best (and which ones to improve).
![[Visual] heatmaps back into action](http://images.ctfassets.net/gwbpo1m641r7/1IqiRyF8JXAyYNnXT3LMyQ/32815c373967d53f2e9e84f400e23830/CSQ-heatmaps.png?w=3840&q=100&fit=fill&fm=avif)
Heatmaps show you which parts of your page your customers find most engaging—and which parts need an upgrade
Surveys
On-site surveys ask your users specific questions, like “What convinced you to sign up today?” or “On a scale from 0 to 10, how likely are you to recommend this product/company to a friend or colleague?” (so you can calculate your Net Promoter Score®). You can place these surveys on key pages or trigger them after specific events, helping you collect timely, personal responses from users about what’s working and what isn’t.
![[Visual] Meet up event feedback survey](http://images.ctfassets.net/gwbpo1m641r7/5AoSsLuQQl8jStGLMl7Hoz/1e6cc4070d642ec630ebfca1f33d5486/Screenshot_2024-11-06_at_11.57.20.png?w=3840&q=100&fit=fill&fm=avif)
Quickly capture and analyze user feedback with Surveys
Journeys
Get a holistic view of user behavior by visualizing their entire journey from beginning to end. Our tool Journeys reveals common customer paths from entry to exit, so you can see where they go (and what they do) before converting or bouncing. Uncover bottlenecks, find looping patterns, and work backward from the most successful journeys to find new ways to improve UX and boost conversions.
![[visual] journey analysis on reference mapping](http://images.ctfassets.net/gwbpo1m641r7/5Uhax8oBmb38B8ju0ceeSz/a521bc8814c3ab33b743a103b1d57132/CSQ-journeys.png?w=3840&q=100&fit=fill&fm=avif)
Get a big-picture understanding of user behavior by visualizing their entire journey from start to finish
💡 Pro tip: enrich your user behavior analytics by combining tools to get a 360-degree view of the customer experience.
If you’re using Contentsquare (hi, that’s us! 👋), all the above tools work together seamlessly, so you can
Jump straight from rage clicks in heatmaps to an associated session replay to see exactly what caused the frustration
Contextualize negative feedback or survey responses by watching session replays of their user journey
Track, visualize, and monitor key user behavior data using dashboards, so you can quickly identify trends, fix issues, and boost your CX
3 benefits of tracking and analyzing user behavior on your website
Using website tracking to gather data for user behavior analysis gives product and marketing teams rich insights about the usability and functionality of their site, and lets you make data-driven decisions based on real user actions.
Here are three powerful benefits of user behavior analytics:
Deeply understand and empathize with your customers
See what people are interested in, gravitating towards, or ignoring, and turn these user behavior insights into UX improvements that foreground what they care about.
Make data-driven improvements
Identify points in the customer journey where people get stuck, struggle, and leave. Prioritize fixes that enhance the customer experience and reduce your bounce rate.
Increase customer retention rates
Understand the issues that lead to customer churn, and study the behavior associated with long-term retention. Reduce the roadblocks and do more of what works to keep more happy customers, for longer.
How to analyze user behavior in a simple 3-step framework
Now that you know which user behavior analytics tools to use, you can start thinking about how you're going to use them.
To get a full picture of user behavior, you have to be strategic about the user behavior data you collect, and use it to understand 3 key things about your users:
The drivers that bring them to your website
The barriers that might stop them or make them leave
The hooks that persuade them to convert
This is a 3-step framework which relies on a combination of traditional analytics, behavior analytics, and user feedback. Here’s how it works.
Step 1: find out why people are coming to your website
To learn why users are coming to your site in the first place, you need to identify the drivers or triggers that motivate them to visit it.
There are 3 types of website users:
Just-browsing wanderers: people who are just looking around and have no intention of buying your product or signing up
Determined heroes: people who have arrived with the sole intent of buying your product, and will get to the end despite any obstacle they encounter
Undecided explorers: people who may be on the fence about whether or not to buy from you
You’re unlikely to win over the just-browsing wanderers, and you’ve already secured the determined heroes. Who you really need to focus on understanding and catering to are the undecided explorers. And to do that, you need to really get inside their heads.
So how do you find that out? Ask them.
H4. Use on-site surveys to learn user motivations
Embed surveys on your most popular landing pages using Surveys. Tailor the questions to learn who your users are and why they’re visiting your site, and gather data on their attitudes, values, and desires.
Some examples of relevant questions to ask:
What’s the main reason for your visit today?
How did you hear about us?
How often do you shop for [item that your business sells]?
Which category best describes you? [List of options, e.g. for a sportswear company it might be ‘I’m a runner’, ‘I’m a weightlifter’, ‘I’m a swimmer’, ‘I do a bit of everything’]
Once you’ve gathered a significant amount of information, you can use the data to
Create user personas that reflect your customers (follow our step-by-step guide to creating user personas)
Analyze what makes these landing pages so successful and replicate these tactics on other pages to reduce bounce rate
Follow up on juicy insights by watching their related session replays or inviting those respondents to a user interview
💡 Pro tip: make user behavior analysis effortless with AI.
Simply tell Contentsquare’s AI Survey Assistant what you want to achieve—like, “I want to understand why users are coming to my website”—and let it instantly whip up a survey targeted to your goal. When it’s time to dig into your results, automated response tagging and sentiment analysis saves you hours of manual work, making creating and analyzing your surveys a breeze.
![[Visual] AI analysis](http://images.ctfassets.net/gwbpo1m641r7/5nV26LJXbfAoK0GgB2kYnB/334ed1755fb62ae73d29f40e0a21c3e9/AI_analysis.svg?w=1920&q=100&fit=fill)
Focus on user behavior analysis, not admin, with AI-powered survey analysis
Step 2: find out what makes users leave your website
In our drivers/barriers/hook model above, barriers are the pain points that stop website visitors from becoming customers. That could be anything from the way prices are displayed to the wording on a product page to a broken form at checkout. User behavior analysis can help you understand why people are dropping out of the funnel, so you can plug those leaks and increase conversions.
Identify problem areas, then use session replays and heatmaps to investigate
Instead of performing user behavior analysis on every page of your website, focus on problematic pages first. You can identify them by looking for common exit pages in Journeys, using Error Analysis to surface high-impact issues, or filtering your session replays.
Once you’ve identified the pages you want to investigate, watch session replays to spot common problems or issues and see what users were doing before they jumped ship.
You can also use heatmaps to quickly identify where users are spending time on your pages. For example, use zone-based heatmaps to get an overview of where people click, scroll, and move on your page, or use a rage click map to spot anger-inducing areas. Then, jump straight from your heatmap of choice to a session replay of the user behavior in action.
After gathering enough information, you should be able to see exactly what users were doing, reading, looking at, or (eek) getting annoyed by before they decided to leave a page. From there, you can draw data-driven conclusions about the cause(s). Maybe your CTA is missing, or a link is broken, or your page is rendering incorrectly.
For vitamin and supplement brand OLLY, this process enabled them to find optimization opportunities that led to a +20% increase in website revenue month over month and a +3% increase in average order value (AOV).
Customers vote with their wallet. They vote with their behavior, and you have to be able to react to that quickly and not put your own preferences and bias ahead of what the customers are actually telling you.
Step 3: discover what convinces users to convert
A powerful way to increase conversions is by investigating what happens when people do convert. This is one of the most overlooked factors in user behavior analysis, because when things are going right, we’re often so busy celebrating that we forget to learn from it and apply that takeaway elsewhere.
Knowing why people convert helps you
Pinpoint the strongest selling points of your product, which you can emphasize in your marketing messaging to connect with even more right-fit customers
Figure out the most persuasive elements of your website, like a compelling banner or CTA, so you can use them on key pages
Inform your user personas, by creating a clearer picture of your ideal customer that helps you improve satisfaction (and reduce customer churn)
In order to understand the ‘hooks’ that persuade certain users to complete the checkout process, you need to find out what these users themselves all have in common. What brought them to your website? What made them overcome the ‘barriers’ listed above?
Find out what went right by collecting feedback and interviewing users
In this case, too, the most effective way to learn about your customers is by asking them. You can do this in a few different ways:
Set up a post-purchase survey on the thank-you page. Ask customers, “What convinced you to sign up/convert today?”
Ask targeted questions about your users and their decision-making process, like:
How would you rate your overall purchasing experience on a scale of 1 to 10?
Was there anything that almost stopped you from completing your purchase?
What made you choose us over a competitor?
Conduct user interviews with existing customers or members of your ideal customer profile using a user interview tool like Contentsquare to get even deeper insights
Run unmoderated user tests in which participants walk through the checkout experience in real time to get candid feedback about the process
Then, analyze the data you’ve collected to home in on what went right—and how you can maximize it throughout your site.
Start tracking user behavior right away
Tracking user behavior gives you a wealth of data that can be used to improve the customer experience in user-centric ways. With the right suite of user behavior analytics tools, it’s easy to identify opportunities, fix pitfalls, and make needle-moving changes that your users will love.
FAQs about user behavior analytics
User behavior analytics (UBA) is a method of tracking, collecting, and analyzing quantitative and qualitative user data to understand how and why users interact with a product or website.
Analyzing user behavior includes monitoring actions visitors take on a website such as where they click, how they scroll, where they encounter blockers, and where they exit from. Tracking these behaviors gives you insight into how people interact with your pages and what they experience during their customer journey so you can make decisions about how to improve your site.
![[Visual] Contentsquare's Content Team](http://images.ctfassets.net/gwbpo1m641r7/3IVEUbRzFIoC9mf5EJ2qHY/f25ccd2131dfd63f5c63b5b92cc4ba20/Copy_of_Copy_of_BLOG-icp-8117438.jpeg?w=1920&q=100&fit=fill&fm=avif)
We’re an international team of content experts and writers with a passion for all things customer experience (CX). From best practices to the hottest trends in digital, we’ve got it covered. Explore our guides to learn everything you need to know to create experiences that your customers will love. Happy reading!