
You likely have your phone on you—or nearby—right now. So do your customers.
With computers in their pockets, people can shop and browse anywhere, anytime. To make that experience as easy and enjoyable for them as possible—and maximize your share of their spending—you need to monitor mobile analytics.
But customer journeys are increasingly complex, spanning multiple devices and channels. That means capturing, accessing and understanding mobile data can feel more intimidating than ever.
In this guide, we explain everything you need to get started, including what mobile analytics is, why it’s important, and the most important metrics to track.
What is mobile analytics?
Mobile analytics is the process of gathering and analyzing data from mobile websites and apps. It encompasses a range of metrics and insights to help you understand user behavior, optimize your site’s or app’s performance and enhance the user experience (UX).
With a mobile analytics tool, you effortlessly collect information at scale. Then, you can use this data to analyze
Who visits your mobile site or app
What devices and systems they use (Android, iOS)
What pages users visit
How long they stay on those pages
Any friction they encounter
What actions users take
These insights help you understand your customers better and find areas for UX improvement, so you can increase engagement, retention and conversions.
Mobile analytics vs. web analytics
Mobile and web analytics share a common goal of understanding user behavior, but they differ due to the platforms, behaviors and metrics they monitor.
Mobile analytics | Web analytics |
|---|---|
Focuses on users engaging with mobile applications and mobile websites | Focuses on users engaging with websites or web apps |
Monitors uniquely mobile behaviors like pinch-zooming, swiping and taps | Monitors web-based behaviors like mouse movements and clicks |
Tracks metrics like app downloads and user adoption, in addition to typical web analytics metrics | Tracks metrics like bounce rates and page views |
💡 Pro tip: Look for platforms that offer mobile and web analytics.
While some analytics cater to either websites or mobile apps, you really need both. The modern customer journey is complex—users might add an item to their cart from the website, and then switch to their mobile app to complete the purchase.
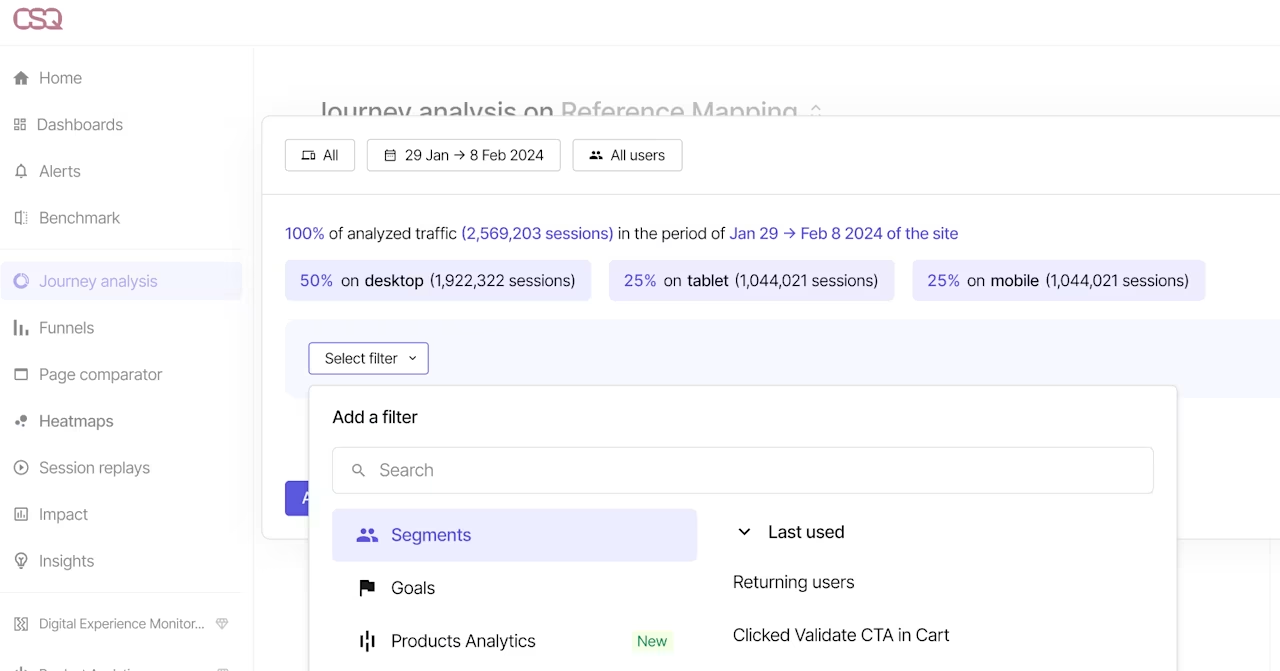
Digital experience and intelligence platforms (like Contentsquare) let you analyze the entire journey with website analytics and mobile app analytics, offering tools like:
Zone-Based Heatmaps to visualize interactions like scrolling and movement on your site or app
Journeys to understand the user journey across web and mobile so you can optimize it
Session Replay to see how individual users interact with your site, helping you pinpoint issues
Error Analysis to find and resolve technical and functional errors that harm conversions and revenue
Impact Quantification to understand which issues most affect key performance indicators (KPIs) so you can prioritize them
With tools like these, you can improve your apps, uncover app user journeys, prevent churn and uninstalls—and grow your revenue.
📖 Check out our article for a comprehensive list of mobile app analytics tools.
Why is mobile analytics important?
Mobile analytics aren’t just important—but essential. According to the 2025 Contentsquare Digital Experience Benchmark Report, mobile traffic share was 69.7% compared to the desktop traffic share of 30.3% in 2023.
To reach the majority of your users, you have to take a mobile-first—or mobile-only—approach. Understanding mobile users’ behavior helps you optimize your site and app to get benefits like:
Improved user engagement. Mobile analytics show you how users interact with your app or mobile site—and help you optimize for even better engagement.
Better decision-making. With insights from mobile analytics solutions, teams make better decisions about their app or site development, feature prioritization and strategy based on real data instead of gut feelings.
Increased retention. Analyzing behavioral data lets you see when and where users drop off—and figure out how to reverse the trend.
Boosted revenue growth. Since mobile analytics help you increase user engagement and customer retention, they also promote revenue growth.
How Hugo Boss used mobile analytics to improve UX
Apparel company Hugo Boss has two sub-brands: Hugo, which is edgy and urban, and Boss, which is sophisticated and professional.
The problem? Customers didn’t know the difference. Surveys showed that only 10% of people were aware of the distinction between brands.
Aaron Baid, Lead eCommerce Product Manager, and his team realized that part of the problem was a lack of alignment across customer touchpoints. Mobile app traffic analytics showed that 78% of new customers came from social media and paid search, meaning they needed to improve the social to on-site experience.
Guided by mobile analytics data, the company introduced a brand toggle button on mobile and used color and imagery to highlight the difference between the sub-brands visually. As a result, A/B testing showed the number of people understanding the difference between Hugo and Boss jumped to 92%.

Using the mobile brand toggle instantly reveals a color scheme difference that reflects Hugo’s boldness and Boss’s sophistication.
Which mobile analytics metrics to track
Mobile analytics offer a virtual treasure trove of data that illuminates user preferences, helping you optimize in-app performance and drive strategic decision-making. Let’s look at some examples of key metrics teams often track and how they help them achieve their goals.
Mobile analytics for UX and product teams
UX and product teams use mobile app analytics to see how users engage with their app or site to find areas for improvement.
UX and product managers track metrics like
User retention. The percentage of users who continue using your product or service over time, which indicates how satisfied they are.
Session length. The amount of time a user spends engaged with your digital platform in a single visit, which provides insights into user engagement and behavior on your mobile site or app.
User feedback. Users’ opinions about your product or service, giving teams ways to improve UX and address issues, like app crashes.
Mobile analytics for customer support teams
Customer support (CS) teams use mobile analytics to understand and eliminate problems users face.
CS teams track metrics like
Churn rate. The percentage of users who stop using your mobile app over a given period, which could indicate user dissatisfaction.
App uninstalls. The number of times users removed your mobile app from their device, which provides insight into satisfaction and retention rates.
User adoption. The rate at which users start using your mobile app, showing your success in attracting and retaining users.
Mobile analytics for marketing teams
Mobile analytics platforms let marketing teams track the success of their campaigns and monitor user acquisition and engagement.
Marketers track metrics like
Conversion rate. The percentage of people who complete a desired action out of the total number of people on your platform, which guides you in optimizing marketing campaigns and strategies.
Click-through rate (CTR). The percentage of times people click on an ad, helping you see how effective a campaign is in driving traffic to your mobile site or app.
Lifetime value (LTV). The money someone spends on your mobile app over their lifespan as a customer, which helps you decide how much to invest in acquiring and retaining users.
Get started with mobile analytics
Mobile analytics give you insights into how users interact with your mobile app or website. To get started with mobile analytics, choose a tool that lets you understand web and mobile together. You’ll get a complete view of the user journey across web and mobile so you can optimize it—improving retention, revenue and user satisfaction.
FAQs about mobile analytics
Mobile analytics is the process of gathering and analyzing data from mobile websites and apps. It encompasses a range of metrics and insights to help you understand user behavior, optimize your site’s or app’s performance and enhance the user experience (UX).
With a mobile analytics tool, you effortlessly collect information at scale. These insights help you understand your customers better and find areas for UX improvement, so you can increase engagement, retention and conversions.

![[Visual] Contentsquare's Content Team](http://images.ctfassets.net/gwbpo1m641r7/3IVEUbRzFIoC9mf5EJ2qHY/f25ccd2131dfd63f5c63b5b92cc4ba20/Copy_of_Copy_of_BLOG-icp-8117438.jpeg?w=946&q=85&fit=scale&fm=avif)