Since being introduced in 2020, the Core Web Vitals have become the key metrics for web teams to track in order to manage web performance and ensure a good experience for their users. Not only do the Core Web Vitals affect search engine ranking, but several studies have also shown a correlation between the Core Web Vitals and business metrics like abandonment rates, conversion rates, engagement and more.
In May of 2023, Google announced that Interaction to Next Paint (INP), will replace First Input Delay (FID) as the primary metric for measuring page interactivity, with this change becoming official in March of 2024. Contentsquare began collecting the INP metric for customers starting in April 2023, and we recommend organizations begin tracking it immediately to prepare for the upcoming change.
While we know INP will be important for SEO, we also wanted to understand its impact on user behavior and conversions. To do this, we aggregated data from 997 customer sites for the three months starting May 1st of 2023. We looked at user frustration, conversion rates, and bounce rates to see whether they correlated with INP.
We’ll dive into the results below, but the short version? Interaction to Next Paint matters, and it matters a lot.
One note before we go on: Correlation does not equal causation. While we can speculate as to the reasons for the correlations we found, we cannot definitively draw conclusions as to cause and effect.
Average interaction to next paint
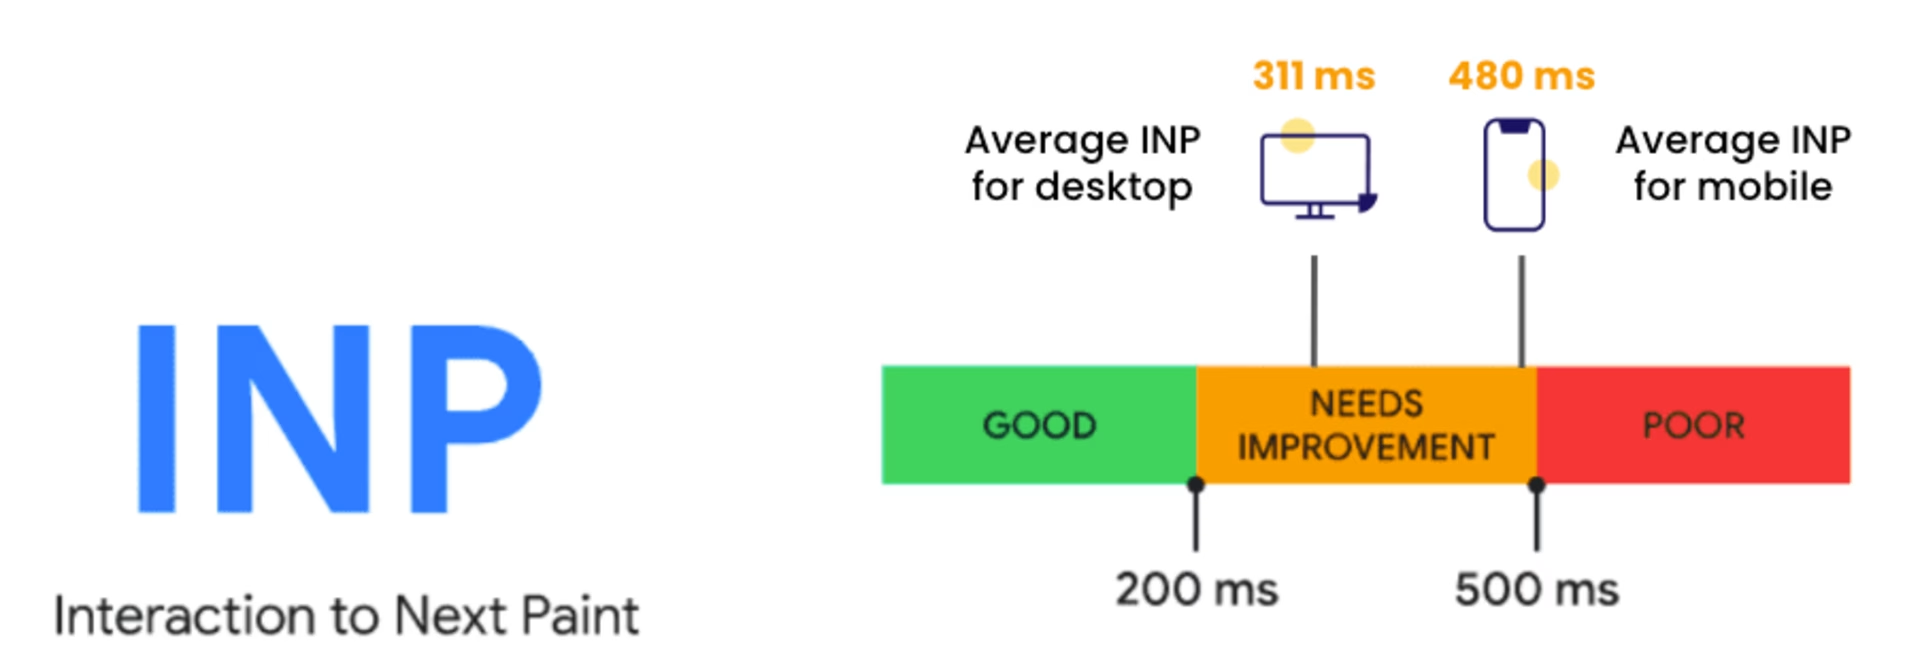
To start, we looked at averages to see how Interaction to Next Paint is looking in general terms. The news is not great. For both desktop and mobile devices, the average INP falls into the “Needs Improvement” range, with mobile INP being substantially worse than desktop INP and bordering on “Poor.” On the plus side, there is a lot of opportunity for improvement!

The most likely reason for the discrepancy between desktop and mobile is that CPUs and network latency on mobile devices are generally slower than desktop CPUs. The lesson here? When looking to improve web and app performance, focus on the worst case scenario. If you can improve performance on mobile devices, desktop performance will likely improve as well.
Interaction to next paint and user frustration
Contentsquare measures user frustration by looking at specific moments of friction detected, including:
Rage clicks: An element was clicked at least 3 times in less than 2 seconds
Multiple button interactions: A button was clicked at least 3 times
Multiple field interactions: A field was clicked at least 3 times
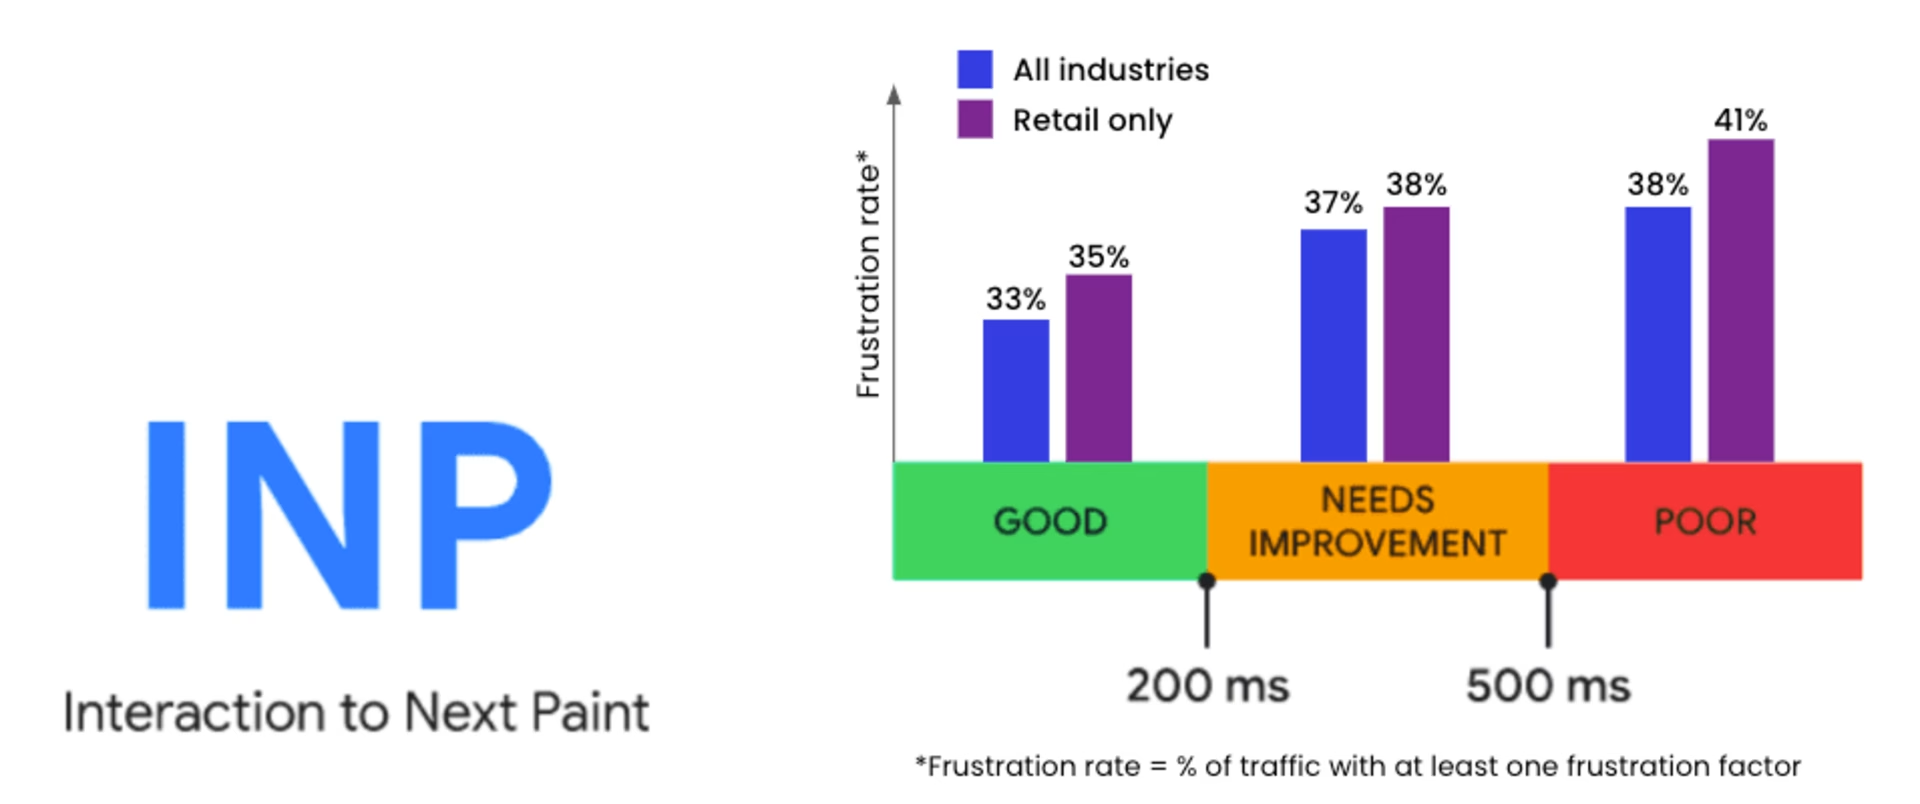
Our research found a strong correlation between Interaction to Next Paint and user frustration. Users that experience Poor INP were 15% more likely to experience frustration compared to those who had a Good INP (38% vs. 33%). The impact was more pronounced in retail, with frustration rates higher across the board and a 17% greater likelihood of frustration for those with Poor INP (41% vs. 35%).

Interaction to next paint and conversion rate
When a user is trying to hand us their money, we can’t afford for poor performance to trip them up. And while conversions are not always about purchasing, they do represent key performance indicators that are vital to our business success.
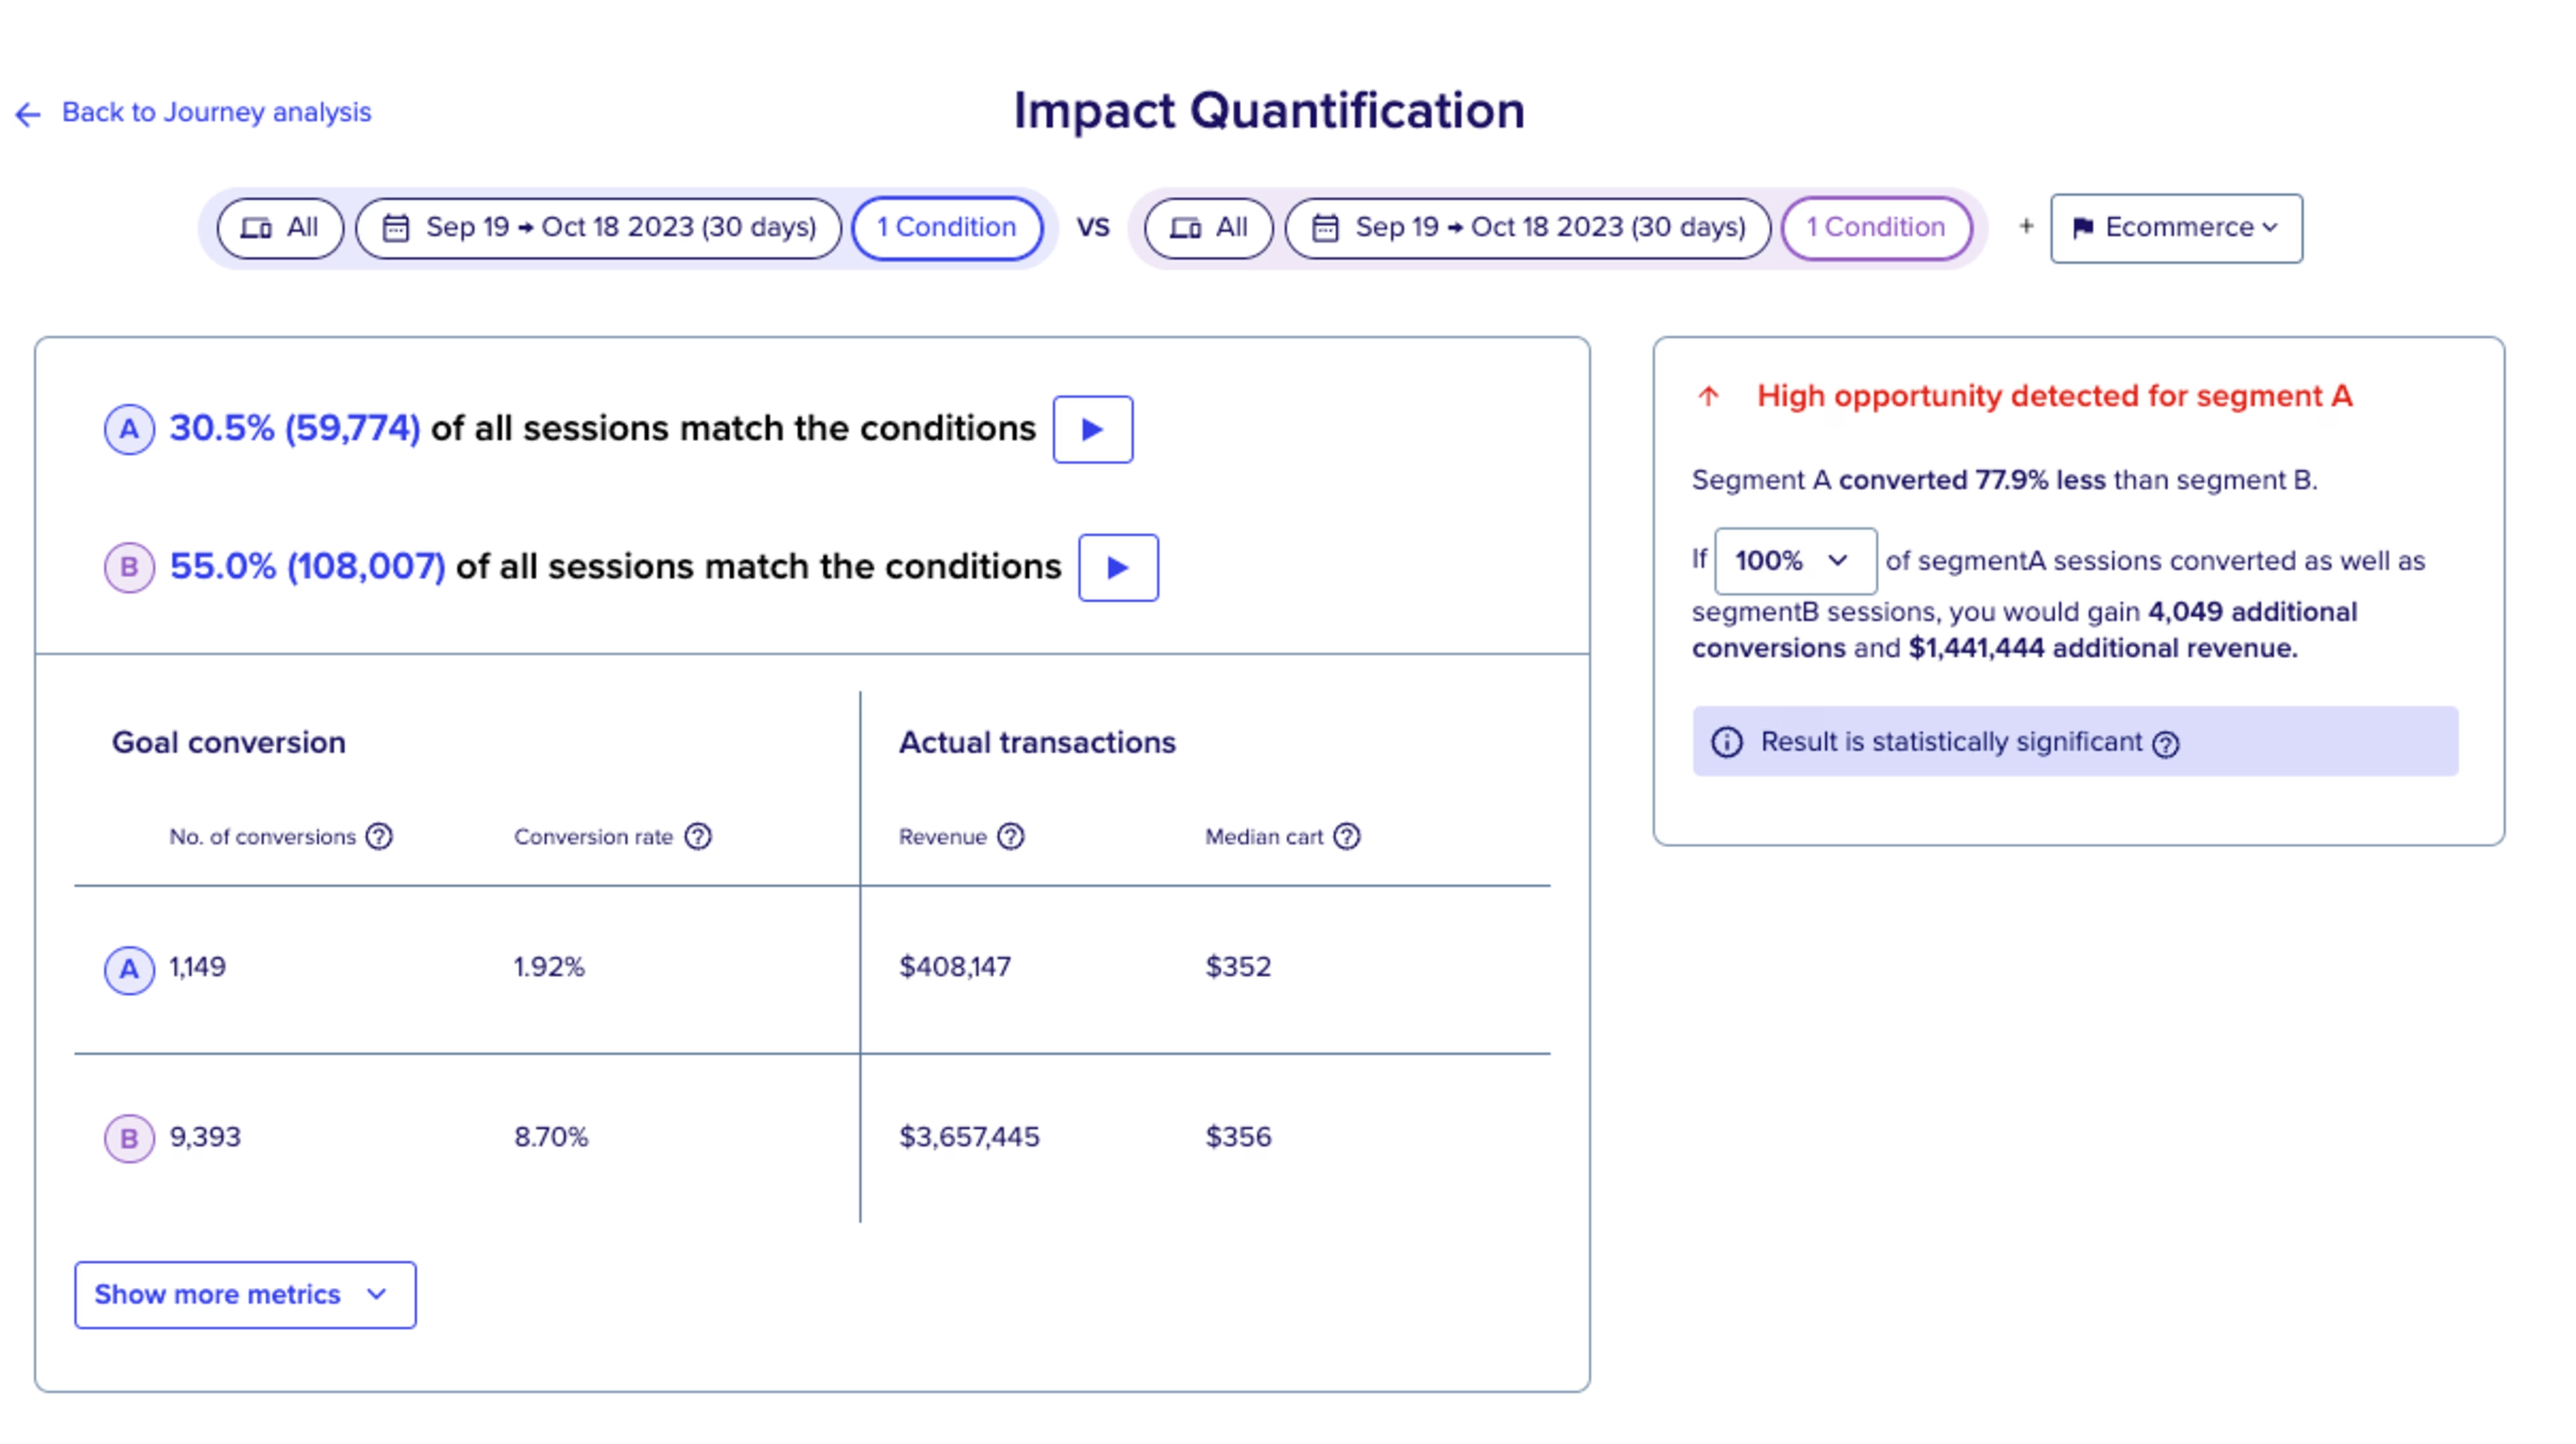
For retail companies, where conversion is most critical, our research found that conversion rates for users with Good INP averages 2.5%, while conversion rates for those in the Poor or Needs Improvement range averages 2.0%. While 0.5% may not seem like a big difference, that’s a 25% better conversion rate for users with good INP, which could equate to millions of dollars depending on your business.
The conversion rate impact was more pronounced when looking at those using desktop devices. For this segment, average conversion rate for those with Good INP was 4.2% compared to 2.9% for all others. That’s a whopping 45% difference!
For mobile users, conversion rates only varied by 11.7% (1.9% conversion rate for Good INP vs. 1.7% for others), perhaps reflecting lower expectations for mobile users when it comes to performance and interactivity. Boosting your site’s average time on page: strategies and techniques
Interaction to next paint and bounce rate
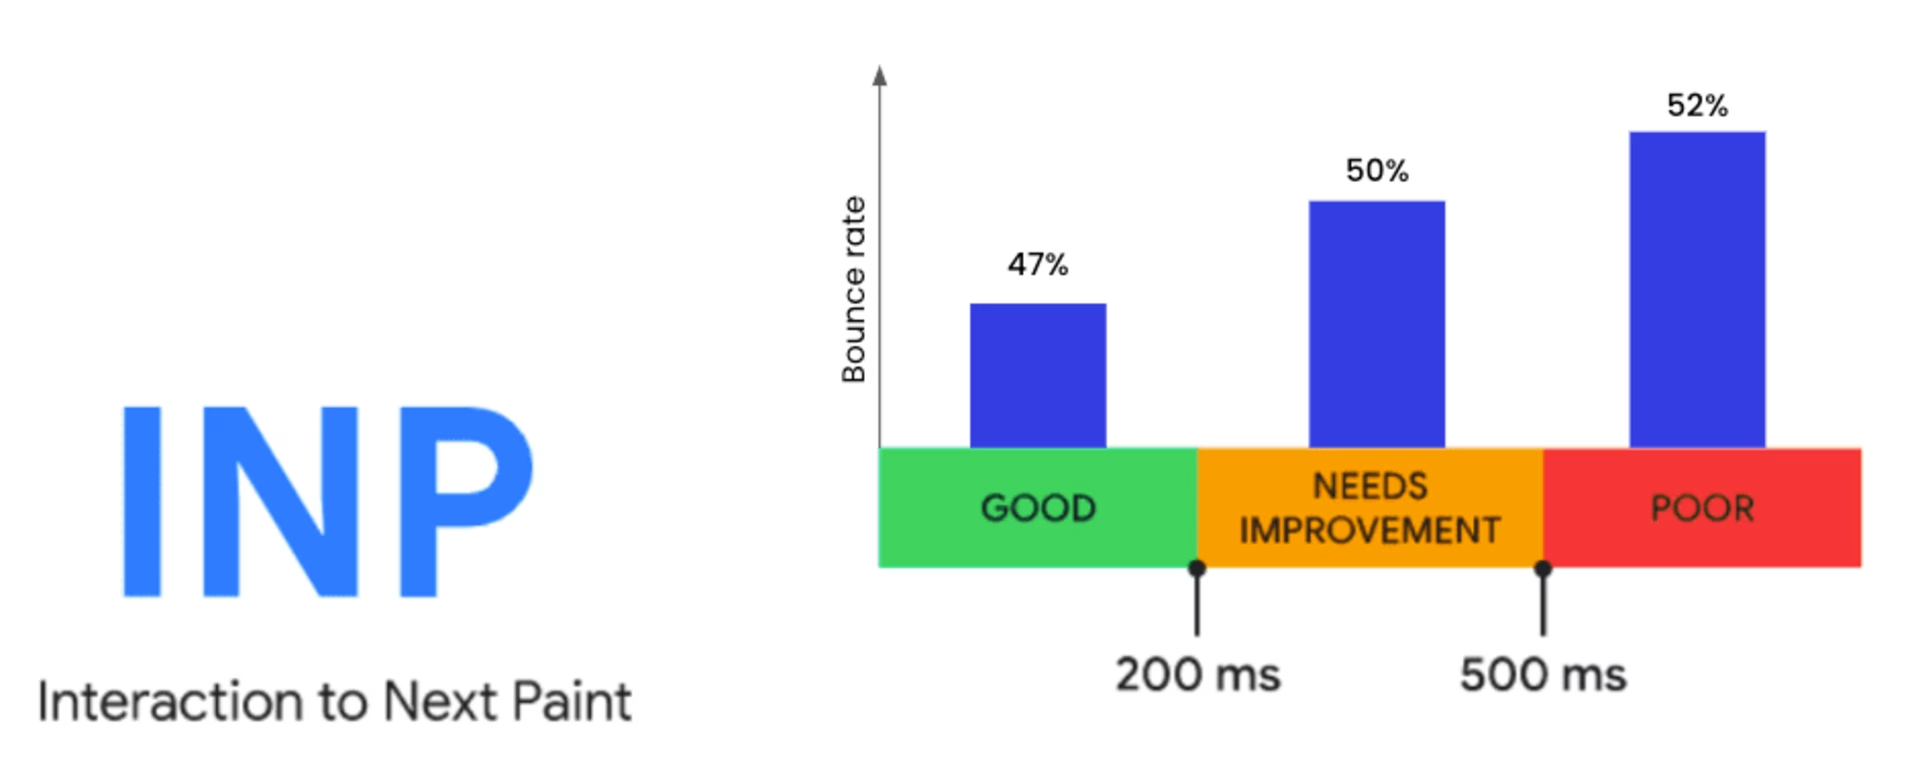
Finally, we looked at another important business metric: bounce rate. Again, we found a strong correlation between Interaction to Next Paint and bounce rate, with 47% of users who experienced Good INP bouncing, compared to a 50% bounce rate for those in the Needs Improvement category and 52% of those in the Poor group.

Our earlier warning about correlation not equating to causation is especially pertinent here. Users who bounce are less likely to interact with a web page, so this could be a case where a poor INP results from a user bouncing, as opposed to the other way around.
The bottom line
Because we’ve previously seen evidence that the other Core Web Vitals affect user behavior and business outcomes, it’s not surprising that Interaction to Next Paint (INP) also has a significant impact. But it’s a great reminder that web and app performance matter. Organizations that put the time and resources into ensuring good performance will reap the benefits in terms of less frustration, improved engagement, and higher conversion rates.
Contentsquare provides everything you need to effectively optimize your web and app performance. You can do the exact same analysis that we’ve done here on your own site, so you can easily see how Good vs. Poor INP affects conversions, bounce rate, and more in order to prioritize your performance improvement efforts.

Contentsquare’s support for Core Web Vitals is part of our Digital Experience Monitoring solution. If you’re already using Digital Experience Monitoring, you have access to INP and the other Core Web Vitals today.
I’m senior director of product marketing at Contentsquare, passionate about helping customers get value from digital experience monitoring and analytics. I’ve been marketing products in the software and IT management space for 20+ years, at companies including Dynatrace, Perceptive Software, and Altiris. Before that I did software development and systems engineering. I have a bachelor’s degree in electrical engineering from Oakland University and an MBA from the University of Michigan.
