![[Visual] Customer journey homepage header](http://images.ctfassets.net/gwbpo1m641r7/40xiPRSyT9RihrQd8himjo/182155bba61829b9de2914e87407f546/BLOG-HJ-for-interaction-design-5921981.jpeg?w=3840&q=100&fit=fill&fm=avif)
Understanding the path users take to become customers is key to unlocking higher conversions.
But uncovering that path, known as the customer journey, isn’t always a straightforward task.
In this guide, you’ll discover why analyzing the customer journey is fundamental to business success, how to optimize it, plus tools to help map the customer journey for you.
What is the customer journey?
The customer journey is the process a user undergoes to become a customer when interacting with a website or app. This journey covers every interaction that takes place between the customer and the brand, from the initial landing page to the final goal conversion.
The customer journey is complex and multifaceted and doesn’t always move in a nice, straight line. Journeys often involve various interactions, such as clicking links, completing forms, and responding to calls to action. These varied and non-linear steps make them difficult to map out on your own.
However, mapping the customer journey allows businesses to understand the multiple paths and decision points users might encounter. This insight is crucial for creating user-centered digital experiences that anticipate customer needs and smooth out potential barriers to conversion.
Tools like Contentsquare Journeys let you take a look into the journey your users take. View common paths that lead to conversions and areas that result in dropoffs.
![[Visual] Experience Analytics Journeys](http://images.ctfassets.net/gwbpo1m641r7/76wsXvQyLgeiZJwIzVNWKx/78f0c9fc5dc69f0232a24b65949f2894/Experience-Analytics-Journeys.svg?w=1920&q=100&fit=fill)
Then, use the insight from Journey Analysis to optimize the customer journey, so users get from point A to ‘point buyer’ (see what we did there?) with minimal frustration.
NatWest used Journey Analysis to uncover a high exit rate on their youth savings product page.
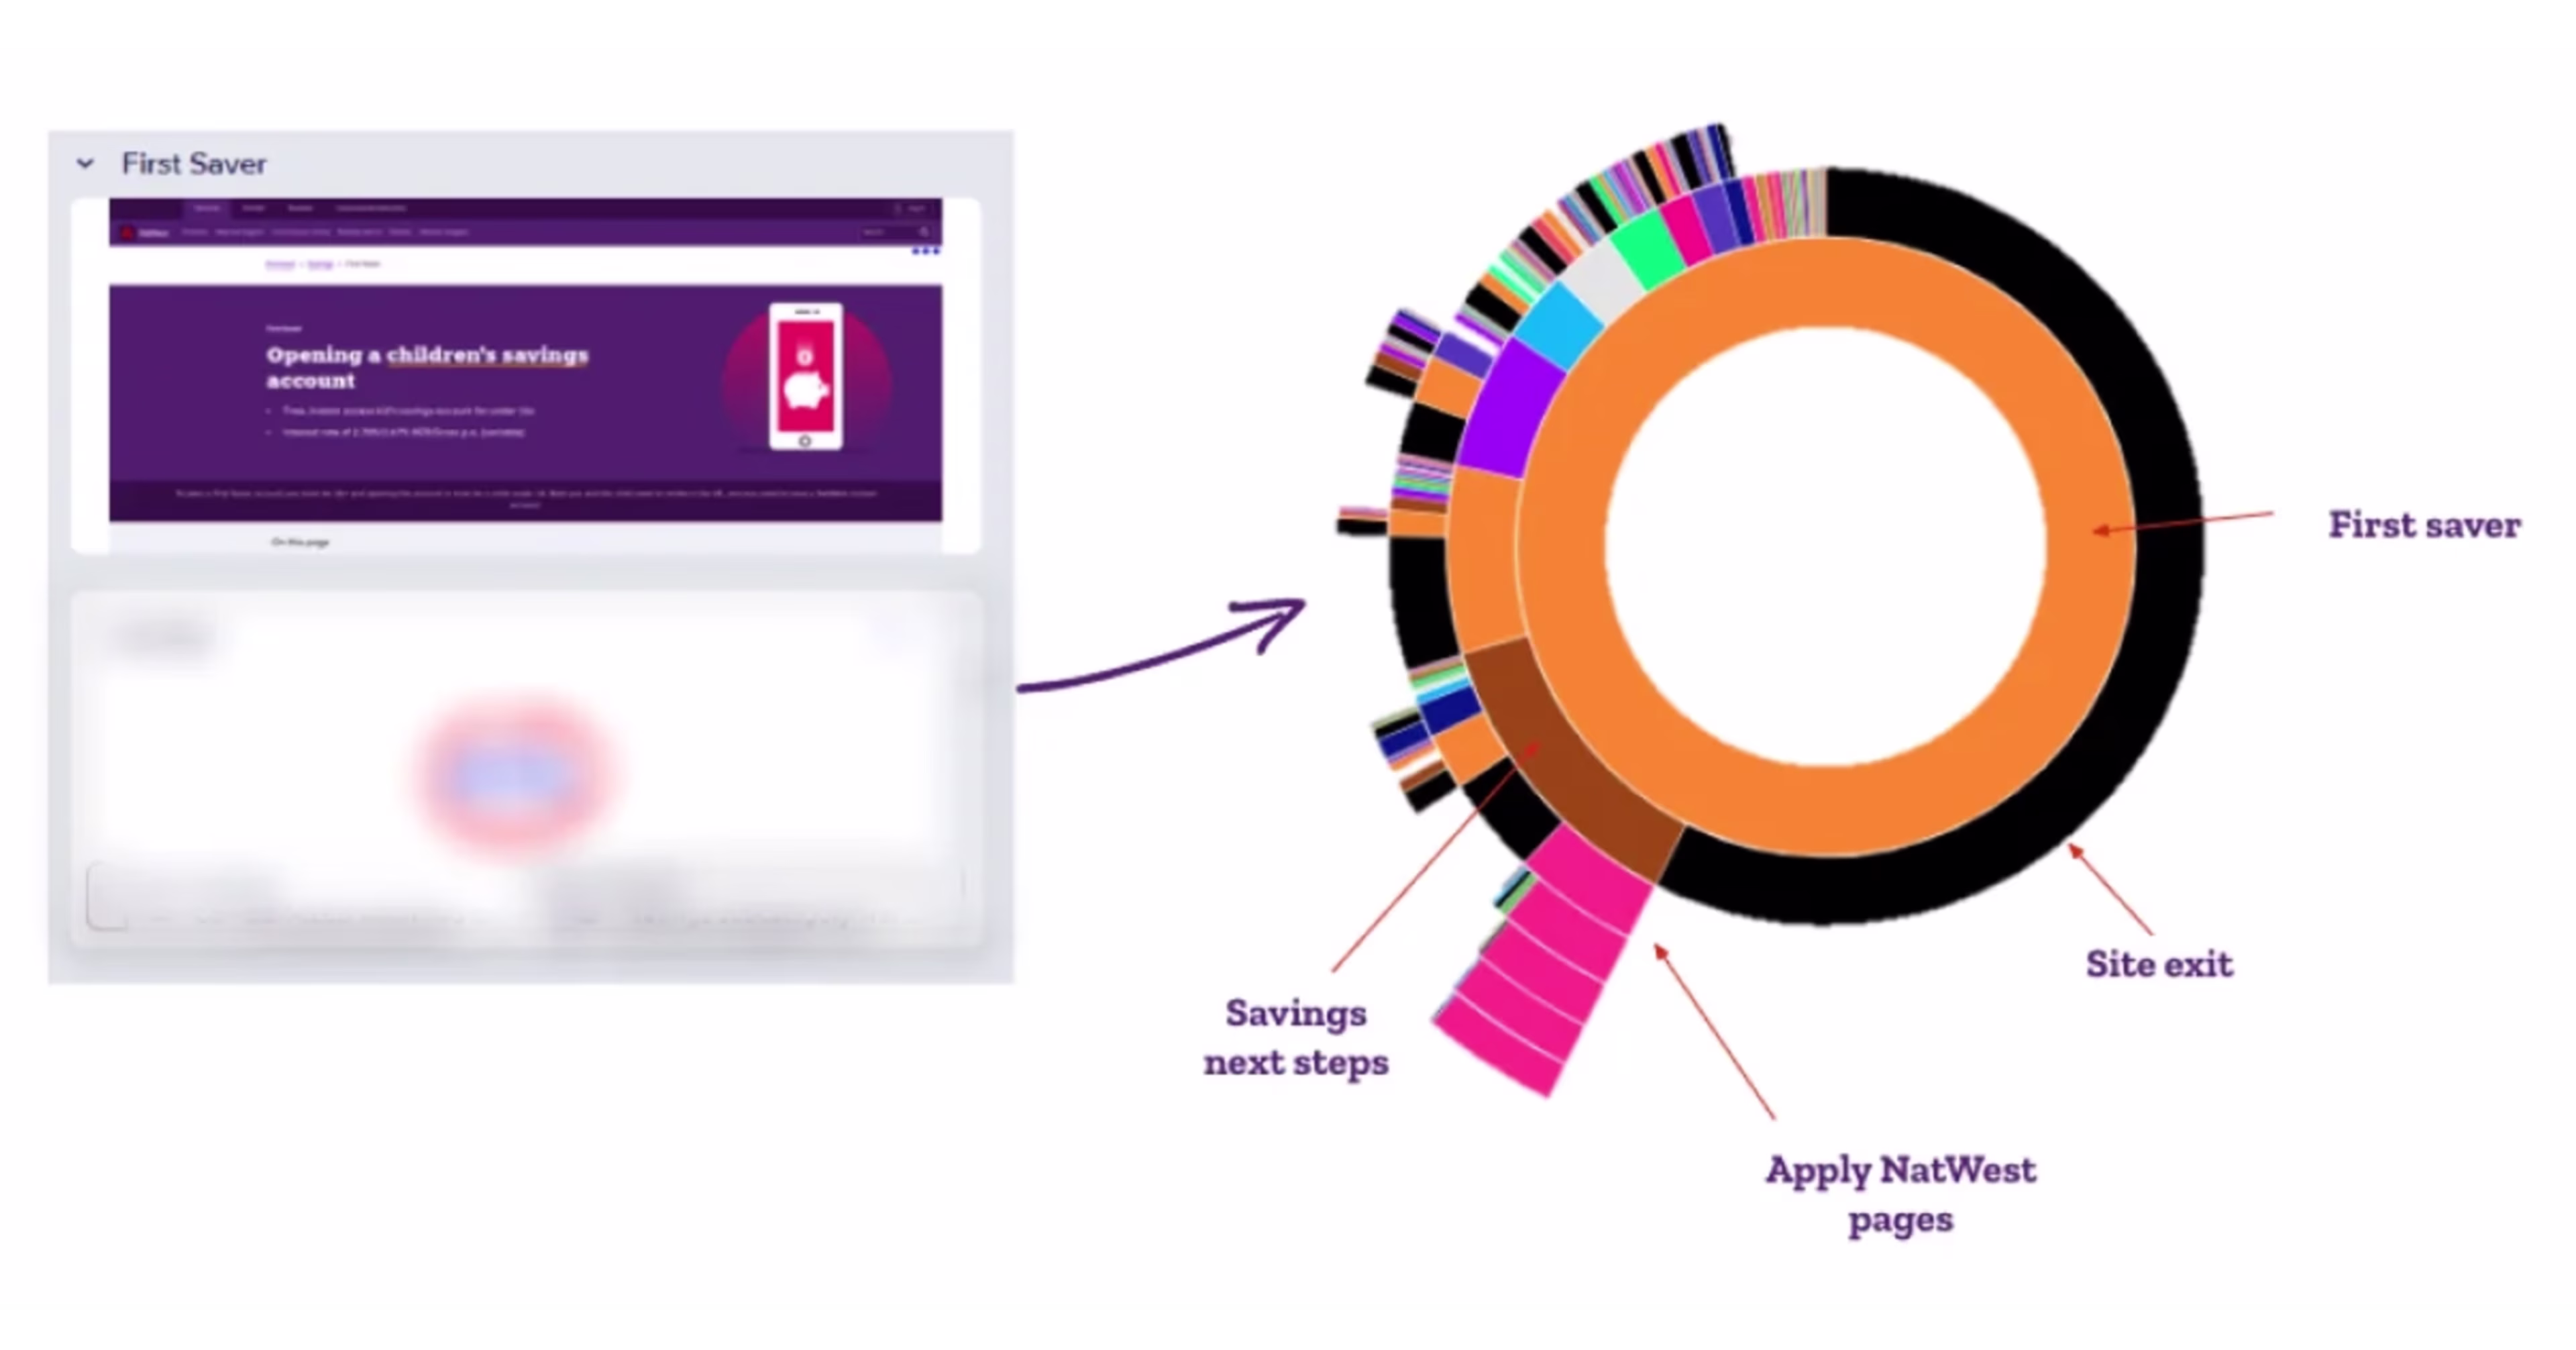
They analyzed the youth savings page and found that users were leaving after viewing the hero image and weren’t seeing the ‘Apply Now’ CTA. NatWest optimized the content of the page and its navigation which led to a decrease in drop-offs and an increase in conversion rates.
Two tools that can show you a view of where users exit your page and how they interact with pages are Heatmaps and Session Replay. Then, use Surveys to ask people why they leave.
Customer journey vs user flows
Customer journeys and user flows are two related (but distinct) concepts that work together to improve the user experience.
We know that the customer journey takes a broad view of the path users take to turn into customers. Whereas user flows zoom in on specific details within the journey and map out the exact steps someone takes to complete a particular task. Think signing up for a free trial or booking a demo. These steps are part of the overall customer journey, but are individual user flows that teams can review and optimize to streamline the overall journey.
In short, user flows are a more detailed part of the bigger picture (the customer journey). Together, they’re essential for creating a seamless experience, reducing bounce rates, and driving conversions.
Benefits of analyzing the customer journey
Customer journey mapping has several advantages:
Identifies points of friction that cause users to bounce
Helps you better understand customer needs and habits, enabling you to offer the most suitable content at the right time
Provides insights to adjust your marketing efforts toward the most profitable or high-potential opportunities
Enhances user experience and boosts conversion rates on any online platform
Understanding the customer journey can also help pinpoint potential barriers that may prevent users from achieving their goals.
These could be website bugs and technical issues, such as slow loading times or broken links. Or they could be design-related, such as unclear website navigation or confusing layout.
By identifying and addressing website problems, you can improve the user experience, reduce the bounce rate, and increase the likelihood of conversions.
The different stages of the digital customer journey
You could argue (with some degree of truth) that the digital world has given us as many stages of the buyer’s journey as there are grains of sand on the beach. And to be honest, you wouldn’t be far off.
But, you’ll be glad to know there are three essential buying stages that cover every customer journey—no matter the industry. Let’s take a look.
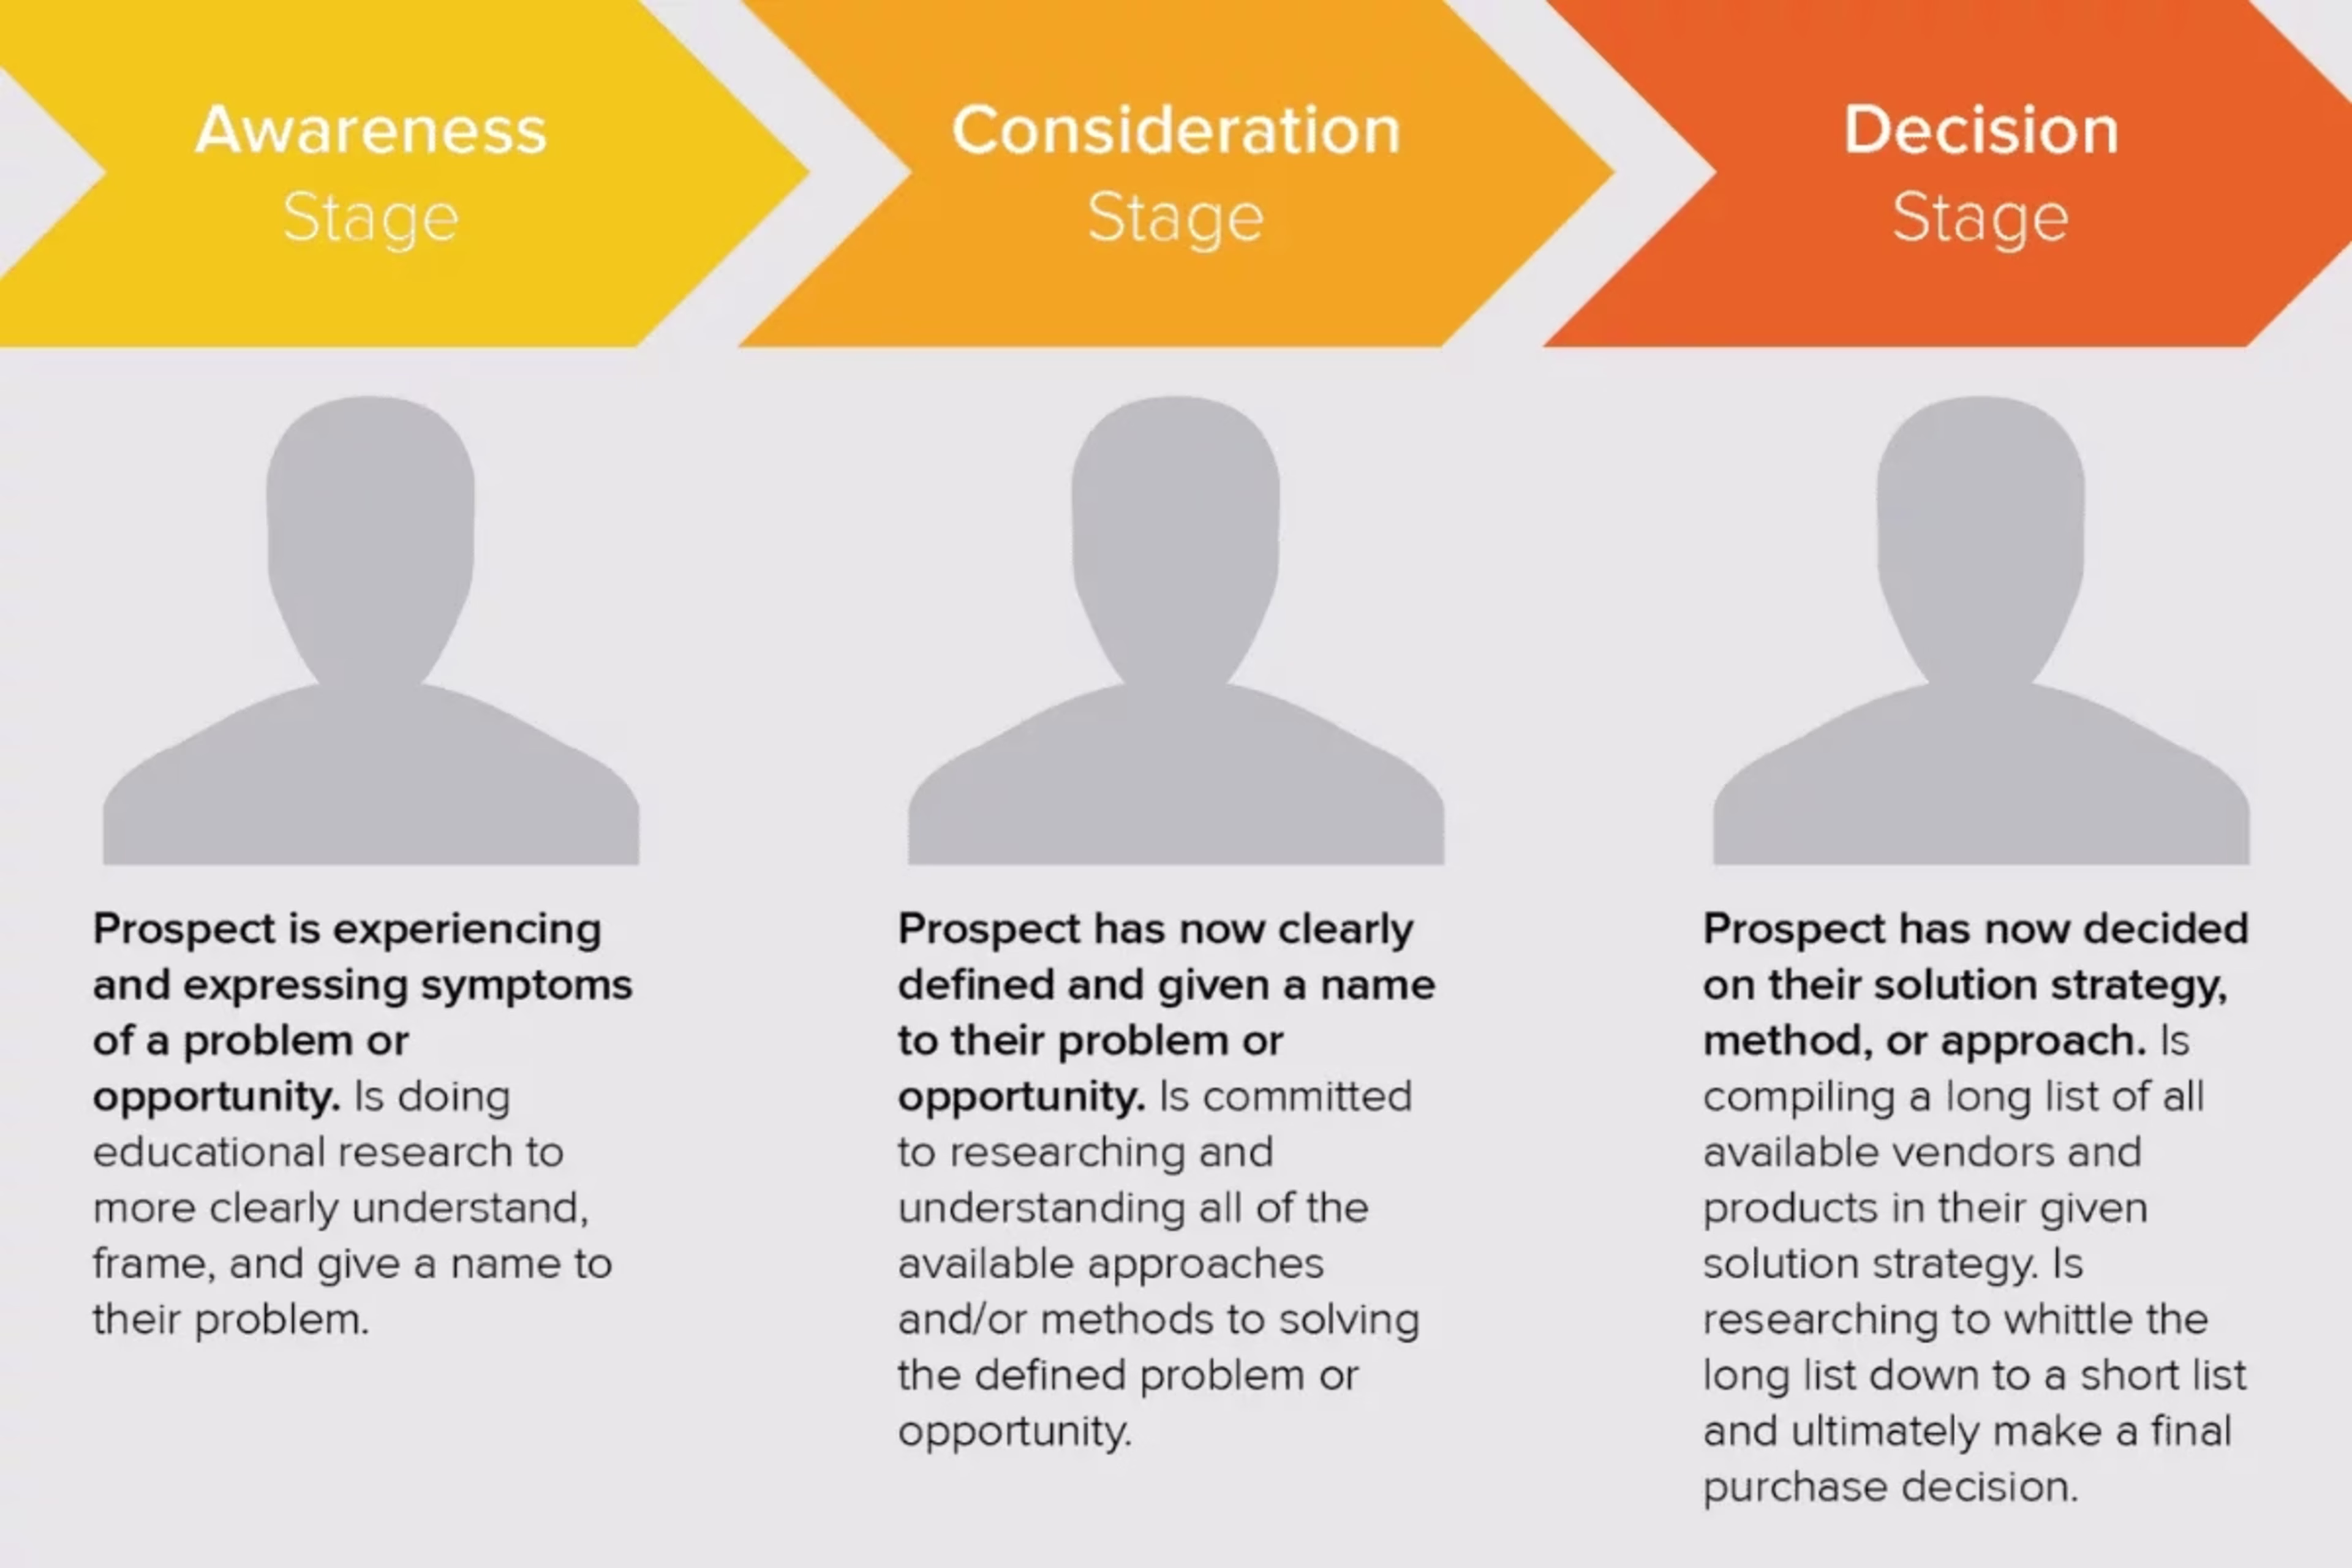
Awareness: the discovery phase
The discovery or awareness stage is when a customer realizes they have a need. For example, this could be replacing a broken refrigerator or buying a second bike that’s better suited for commuting to work.
So, what does the user do? They turn to the internet to start their research. Your job at this stage is to provide answers to the questions they’re searching for.
You’re not selling to them just yet. Instead, focus on filling your site with content—such as blog posts, tutorials, or ebooks—that addresses their questions and helps them understand their needs.
Consideration: the evaluation phase
Once the customer has consulted various sources to help understand their problem, they’ll start to think about which solution is best for them, during the consideration stage.
To do this, they’ll compare their options by reading buying guides, browsing customer reviews, and watching product videos to choose the best option for their budget.
Your site should have this content on hand to help your potential customers decide whether or not your product is their best option.
Decision: the selection phase
The decision phase is the final step. Customers know exactly which product meets their needs and must now choose from the various options.
As a brand, it’s time to ensure you have the right content to demonstrate your competitive edge over your competitors.
This might look like the ability to sign up for a free trial (if you’re a SaaS brand). Or product pages for ecommerce businesses.
Examples of digital customer journeys
These examples highlight how unique the customer journey can be.
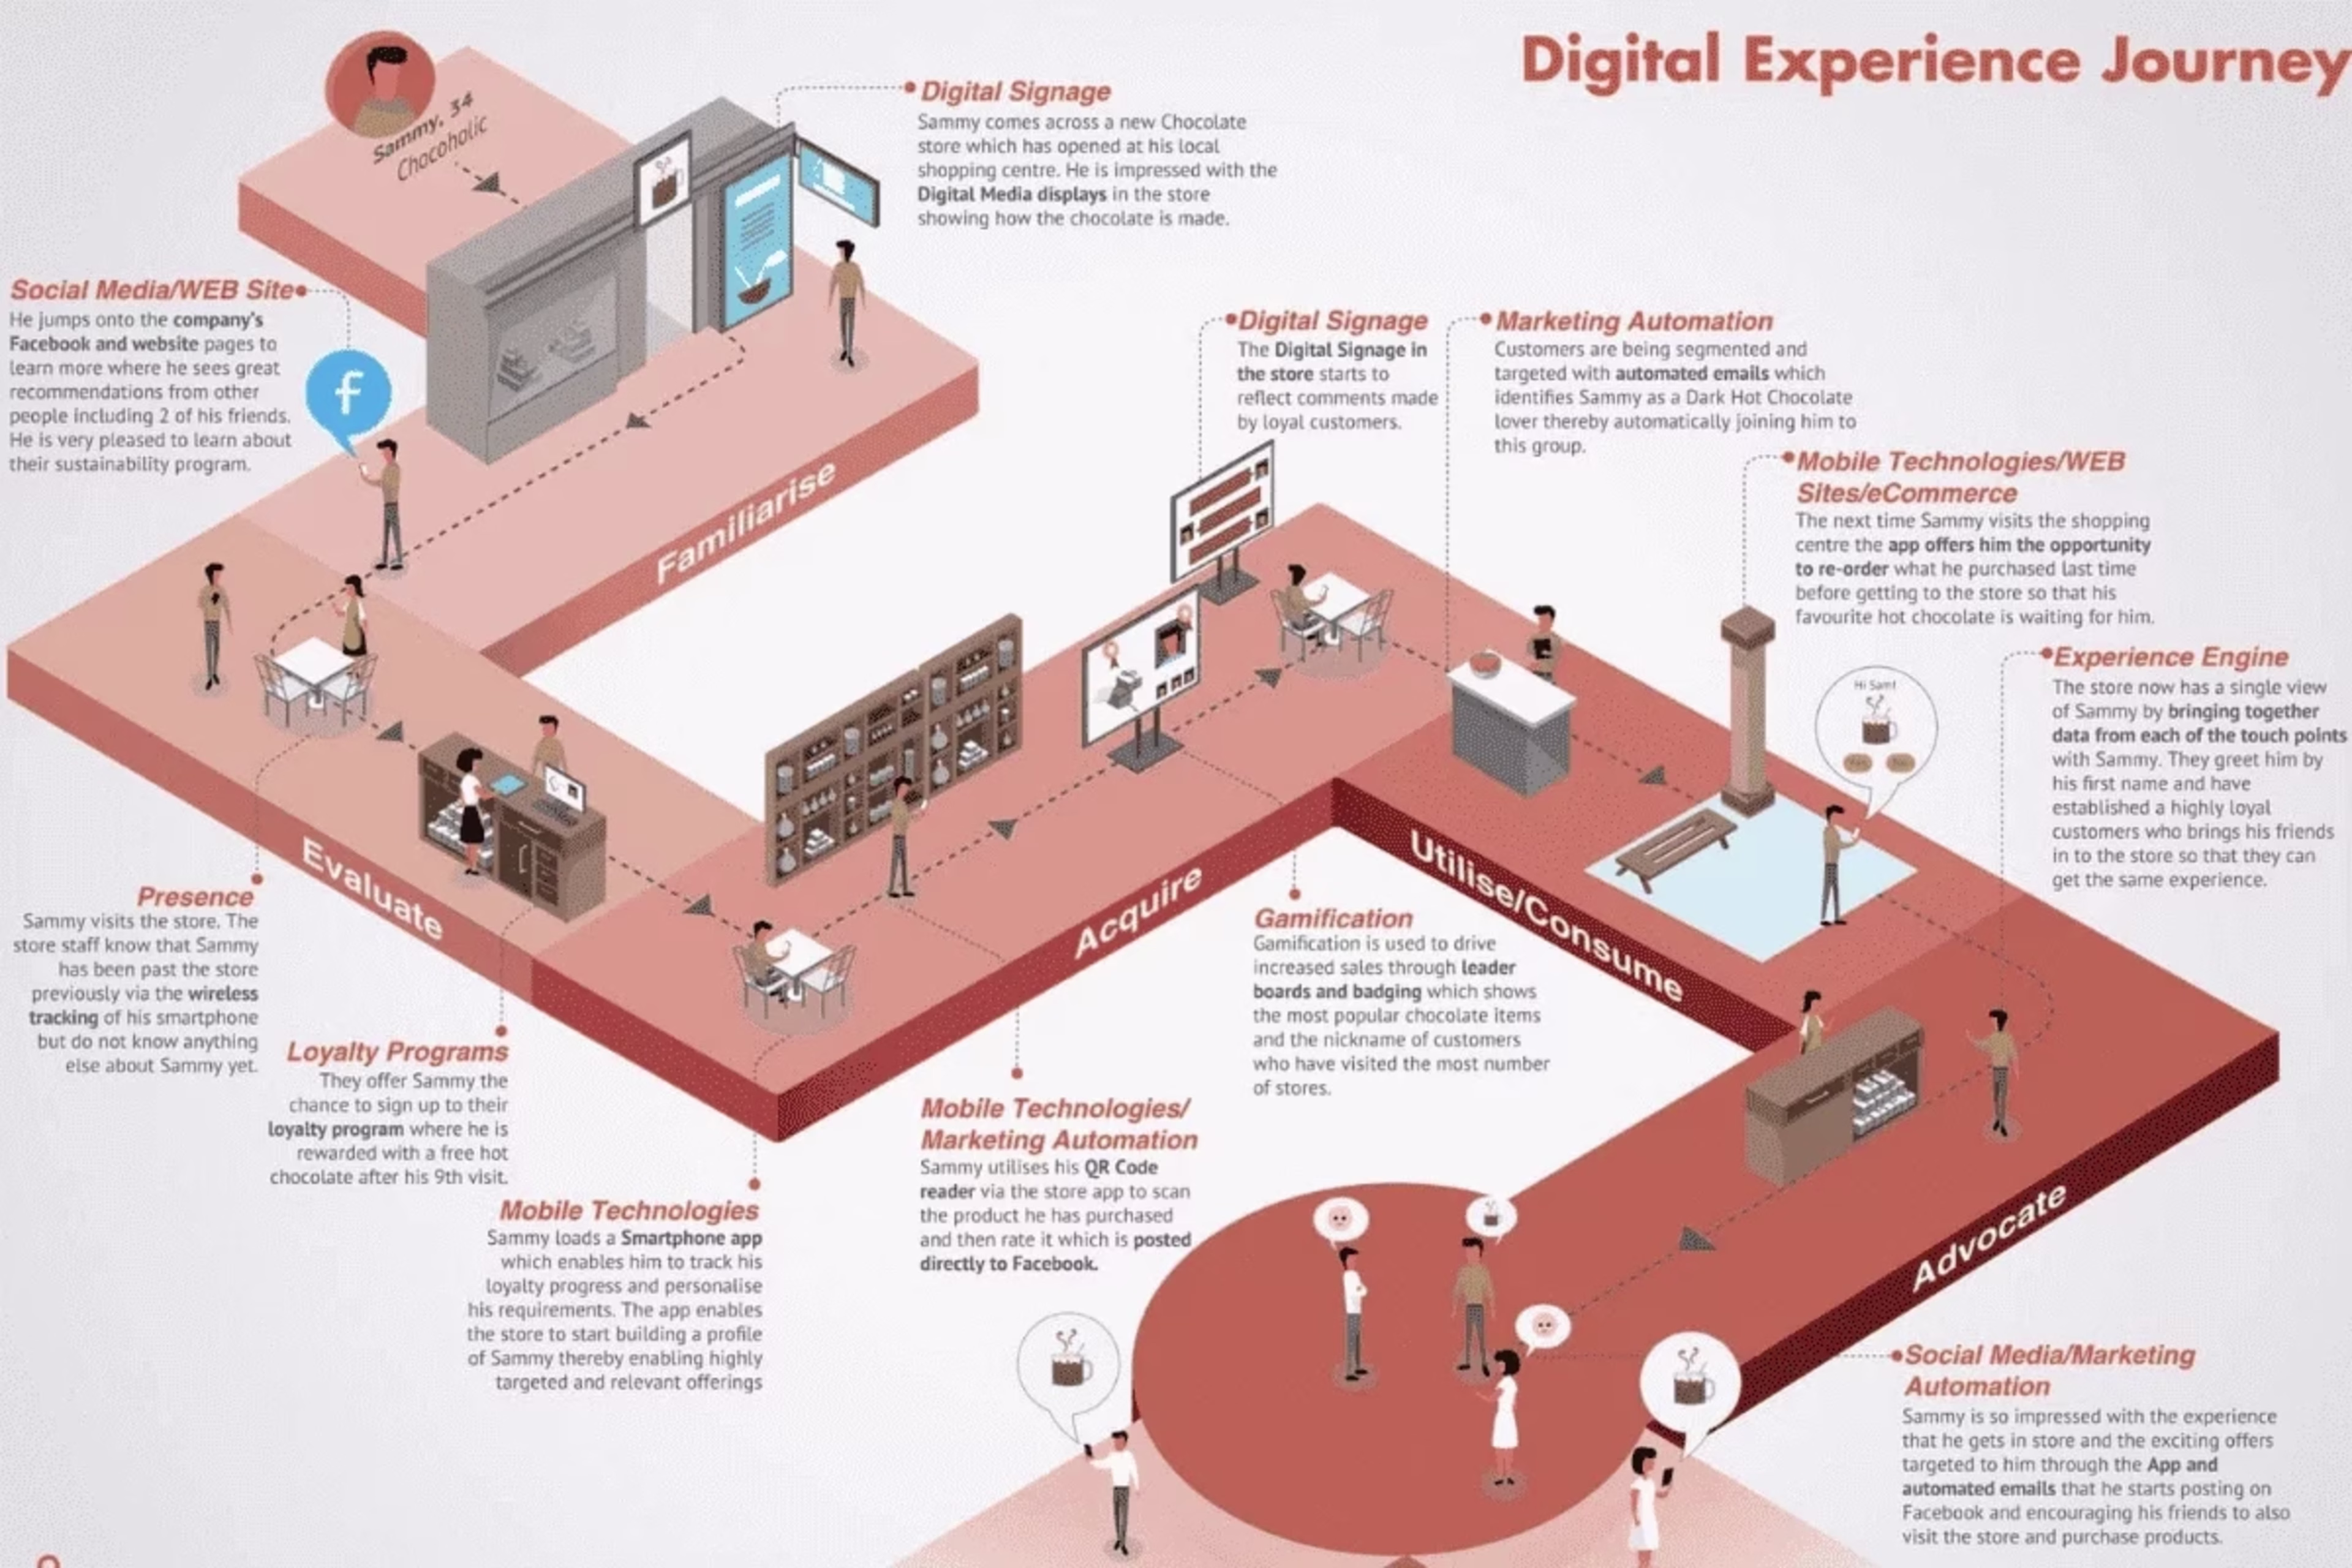
Example 1: Digital Experiences
This customer journey shows clearly how a chocolate brand might create new followers; from discovering products by chance in the street to transforming the customer into a true ambassador.
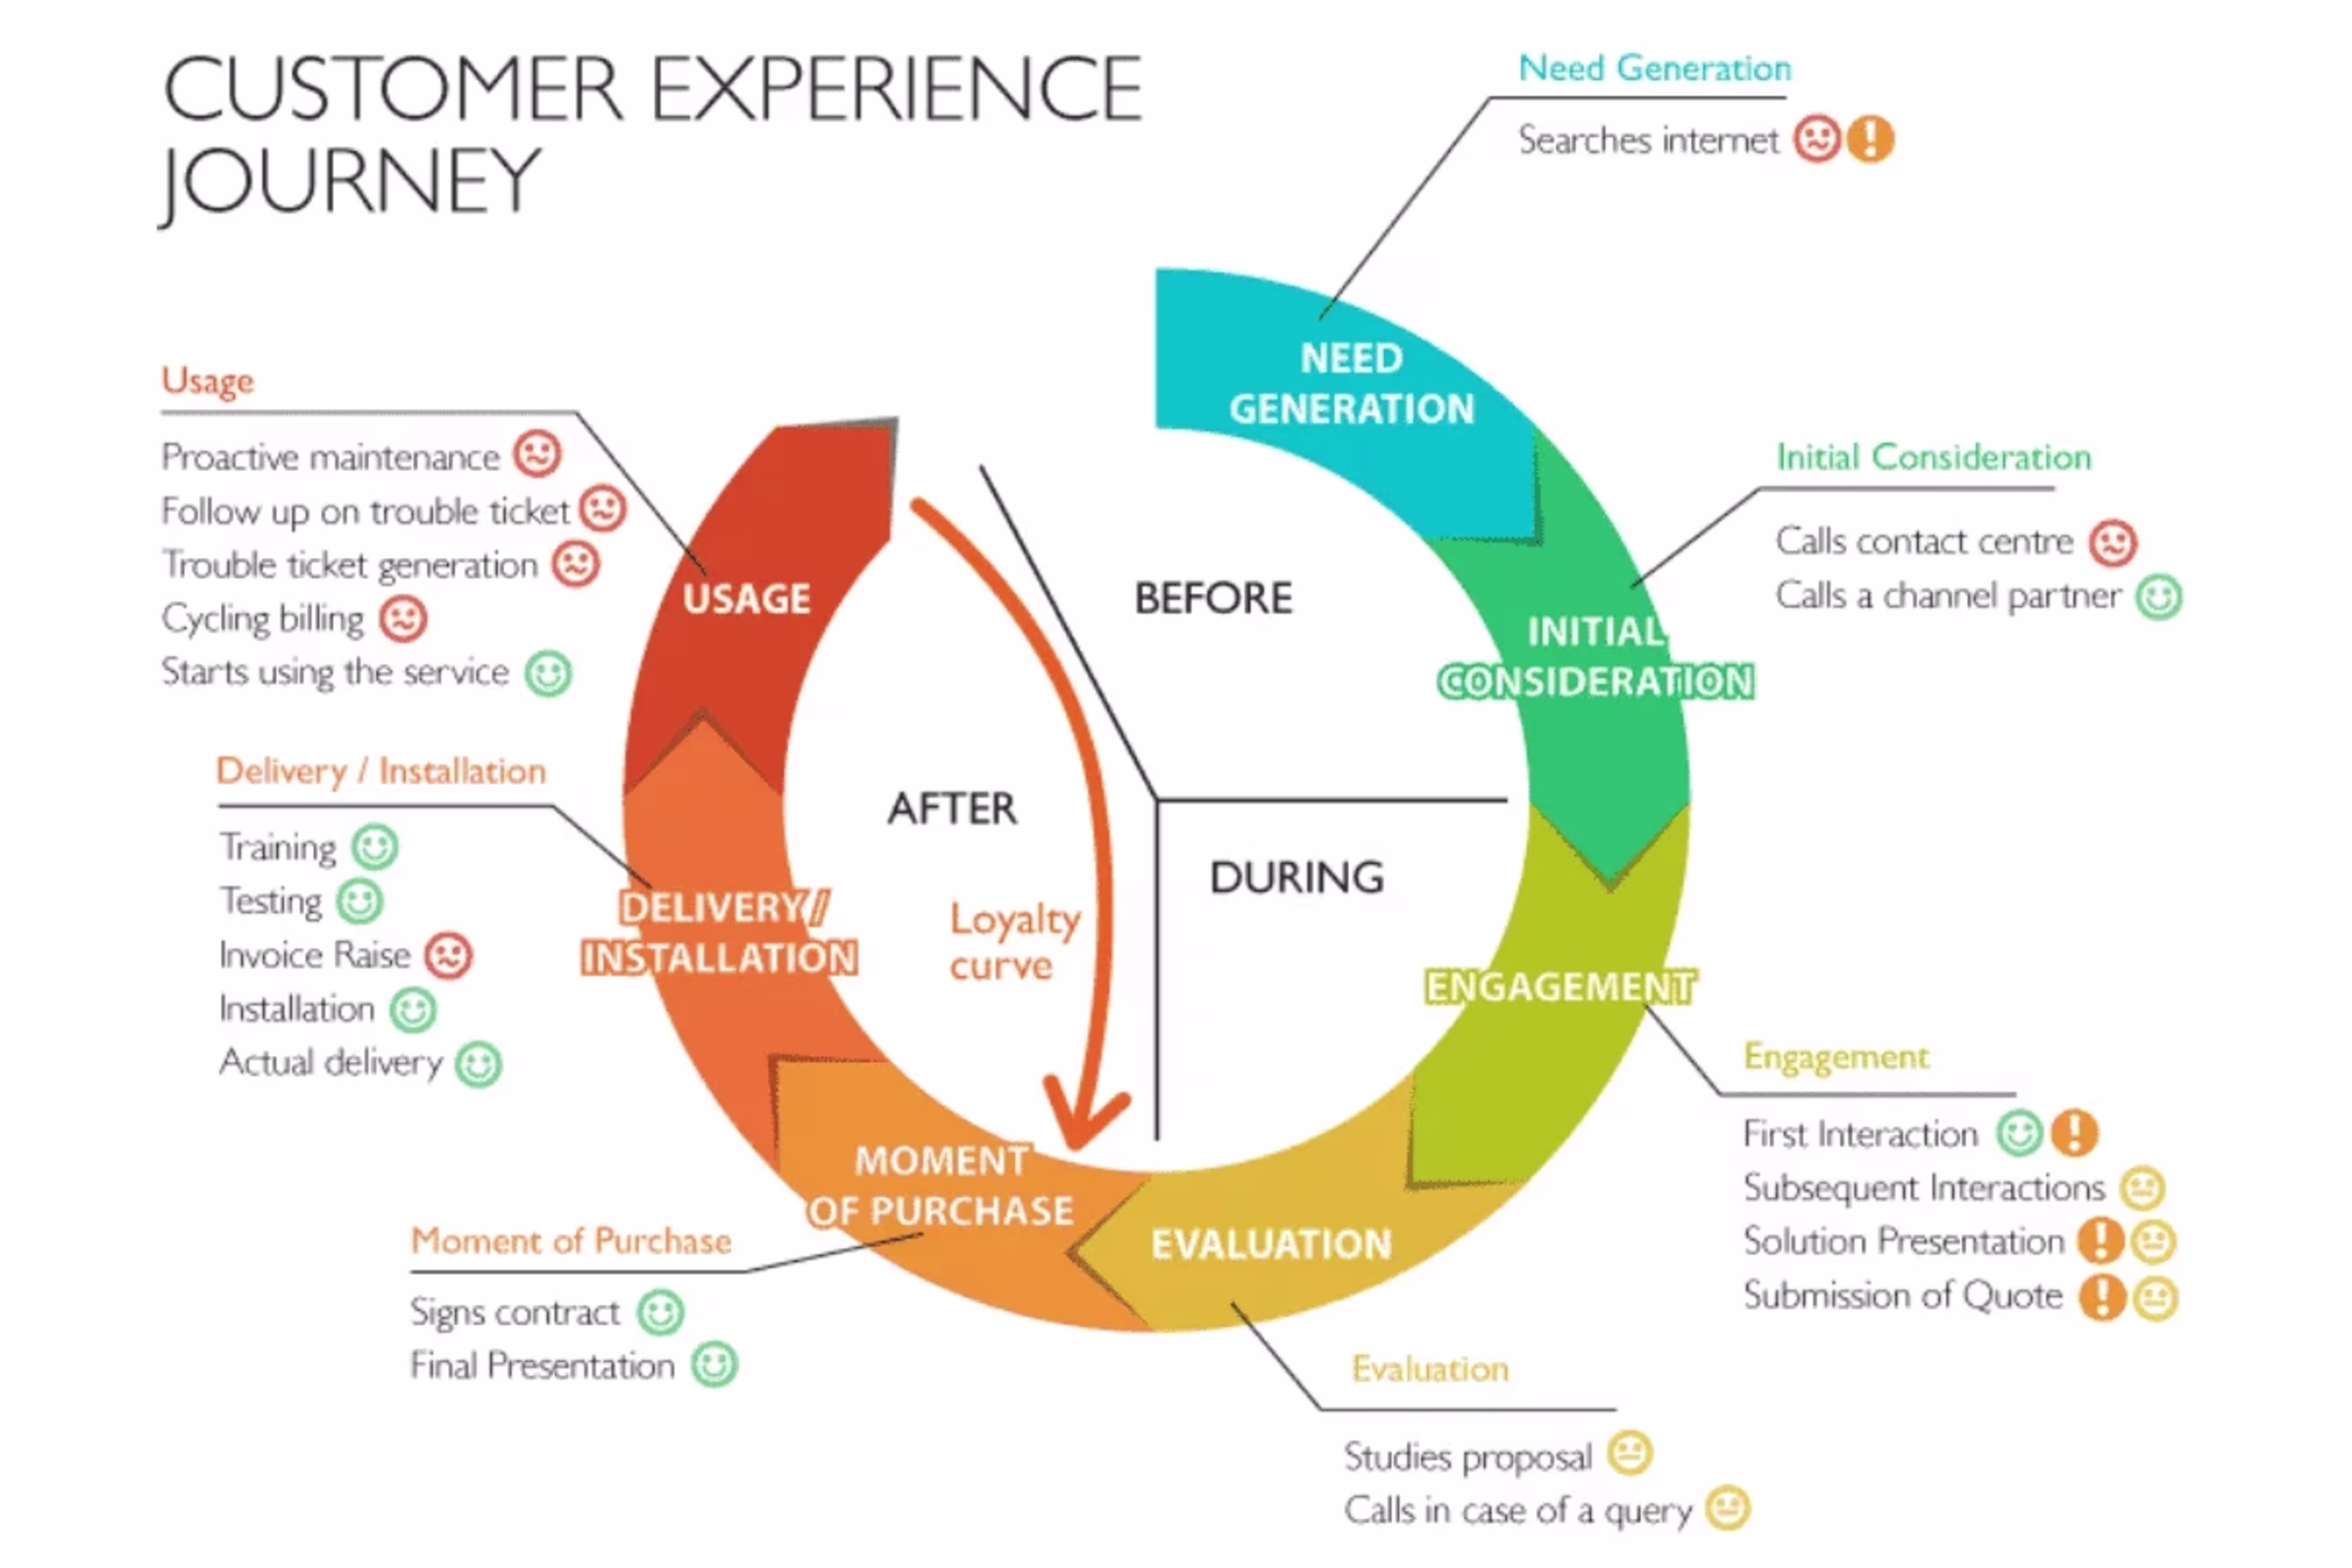
Example 2: UXFirm
This second example from UXFirm has a different objective and emphasizes the experience of the customer at each stage—from awareness to purchase.
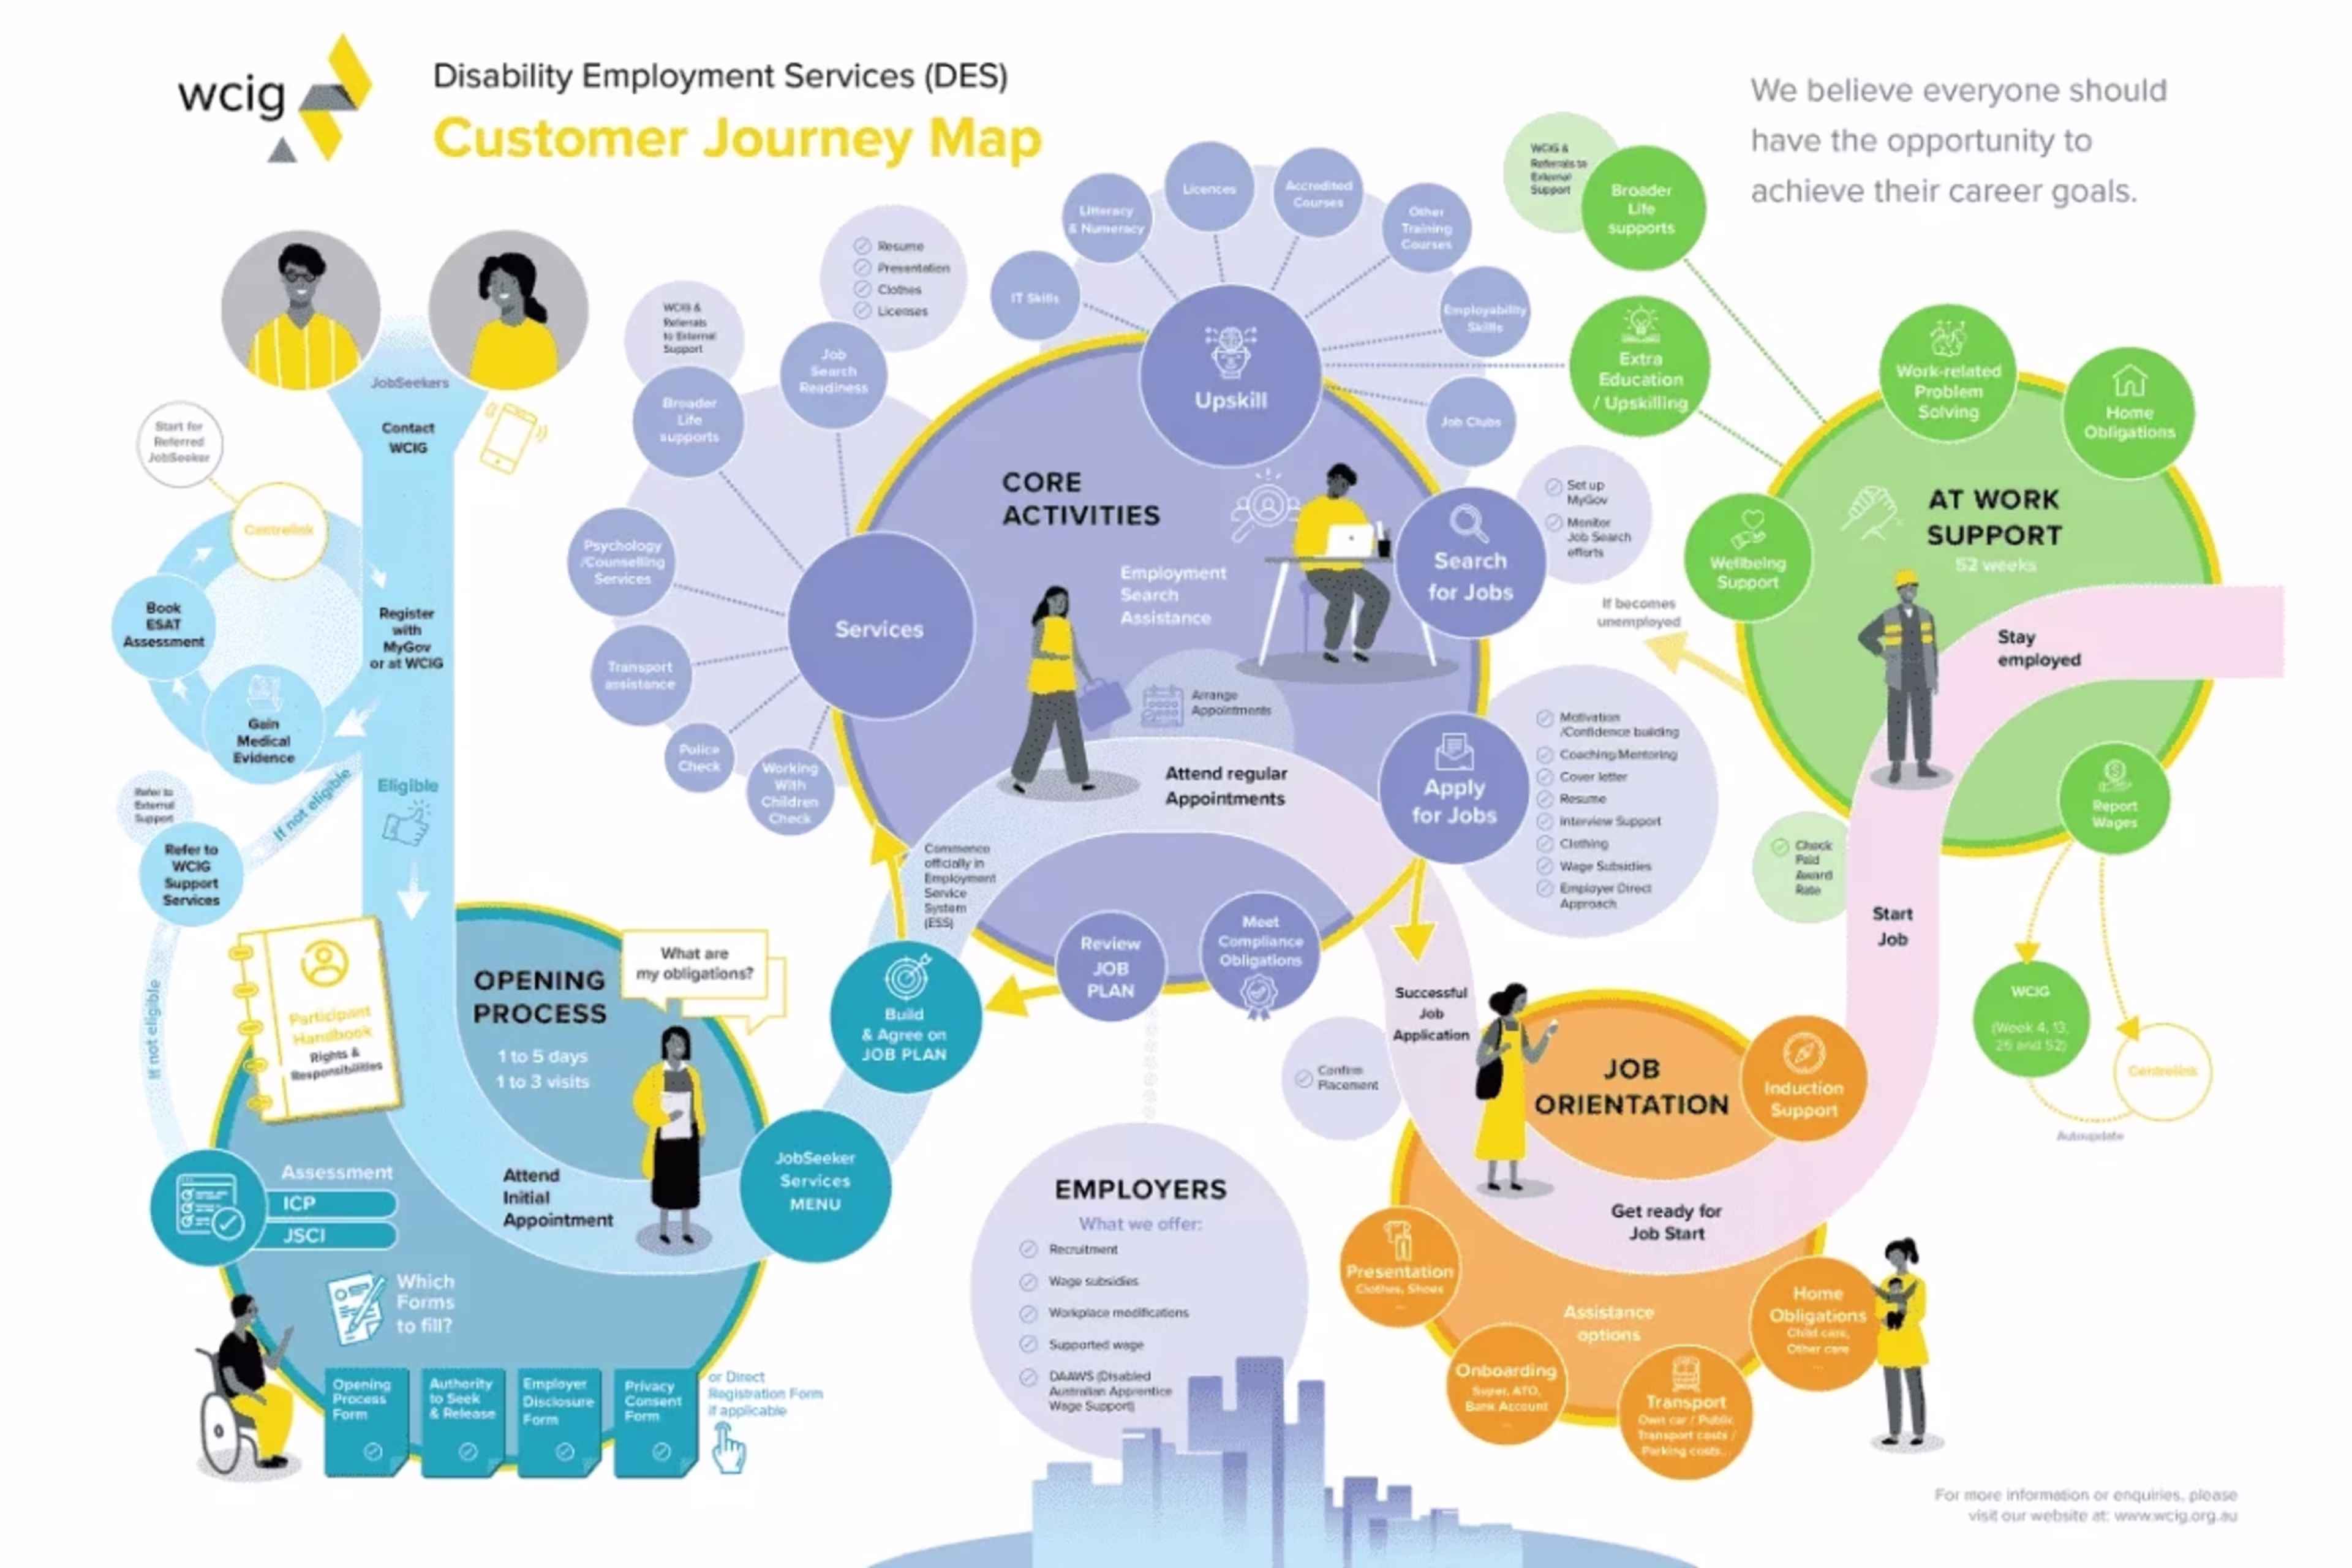
Example 3: wcig
The third example describes in detail each stage and obstacle faced by those with disabilities in a working environment. A very complicated (but enlightening) example of a customer journey.
Tips for optimizing your customer journey
1. Focus on an omnichannel approach
The customer journey needs to meet the demands of multiple channels.
To do this, adopt an “omnichannel” approach which gives equal importance to all stages of the journey.
The objective? To build a “seamless” user experience; one that’s consistent across all channels—whether telephone, social media, or your website.
2. Get everyone involved
Reshaping and optimizing your digital customer journey isn’t a small task. In fact, it can lead to huge changes within your business.
That’s why involving all employees in the process is essential for maintaining consistency and output as you optimize your customer journey.
Feedback from each department is invaluable and will help contribute to the development of a concrete path based on reliable data.
3. Personalize the experience
Personalization can help you stand out from your competitors and make a meaningful impact.
However, to personalize your user experience effectively, you need a solid understanding of your business goals and a clear picture of your target user personas.
With these in place, you can tailor the content on your site or application to each persona, ensuring that users have access to the relevant information they need, no matter where they are in their journey.
Understand your customers with journey maps
Your customer journey should feel human at its core. And you can create a customer experience that truly puts people first by understanding how real users navigate your site—where they flow smoothly, where they get stuck, what information they need, and what frustrations they encounter.
FAQ on Customer journeys
A digital customer journey is the end-to-end path people take across your digital touchpoints—from first discovery (ads, search, social) to browsing, conversion, onboarding, support, and repeat purchase. It includes every interaction and the friction (or delight) customers experience along the way, across devices and sessions.

![[Visual] Contentsquare's Content Team](http://images.ctfassets.net/gwbpo1m641r7/3IVEUbRzFIoC9mf5EJ2qHY/f25ccd2131dfd63f5c63b5b92cc4ba20/Copy_of_Copy_of_BLOG-icp-8117438.jpeg?w=1920&q=100&fit=fill&fm=avif)