The company
Hobbycraft are the largest arts and crafts retailer in the UK, with products ranging across art, knitting and crochet, haberdashery, papercraft, wedding and party, baking, jewellery making and more. As a specialist retailer, search is especially important for Hobbycraft, with over 1 million searches per month across 250,000 unique search terms.
The challenge
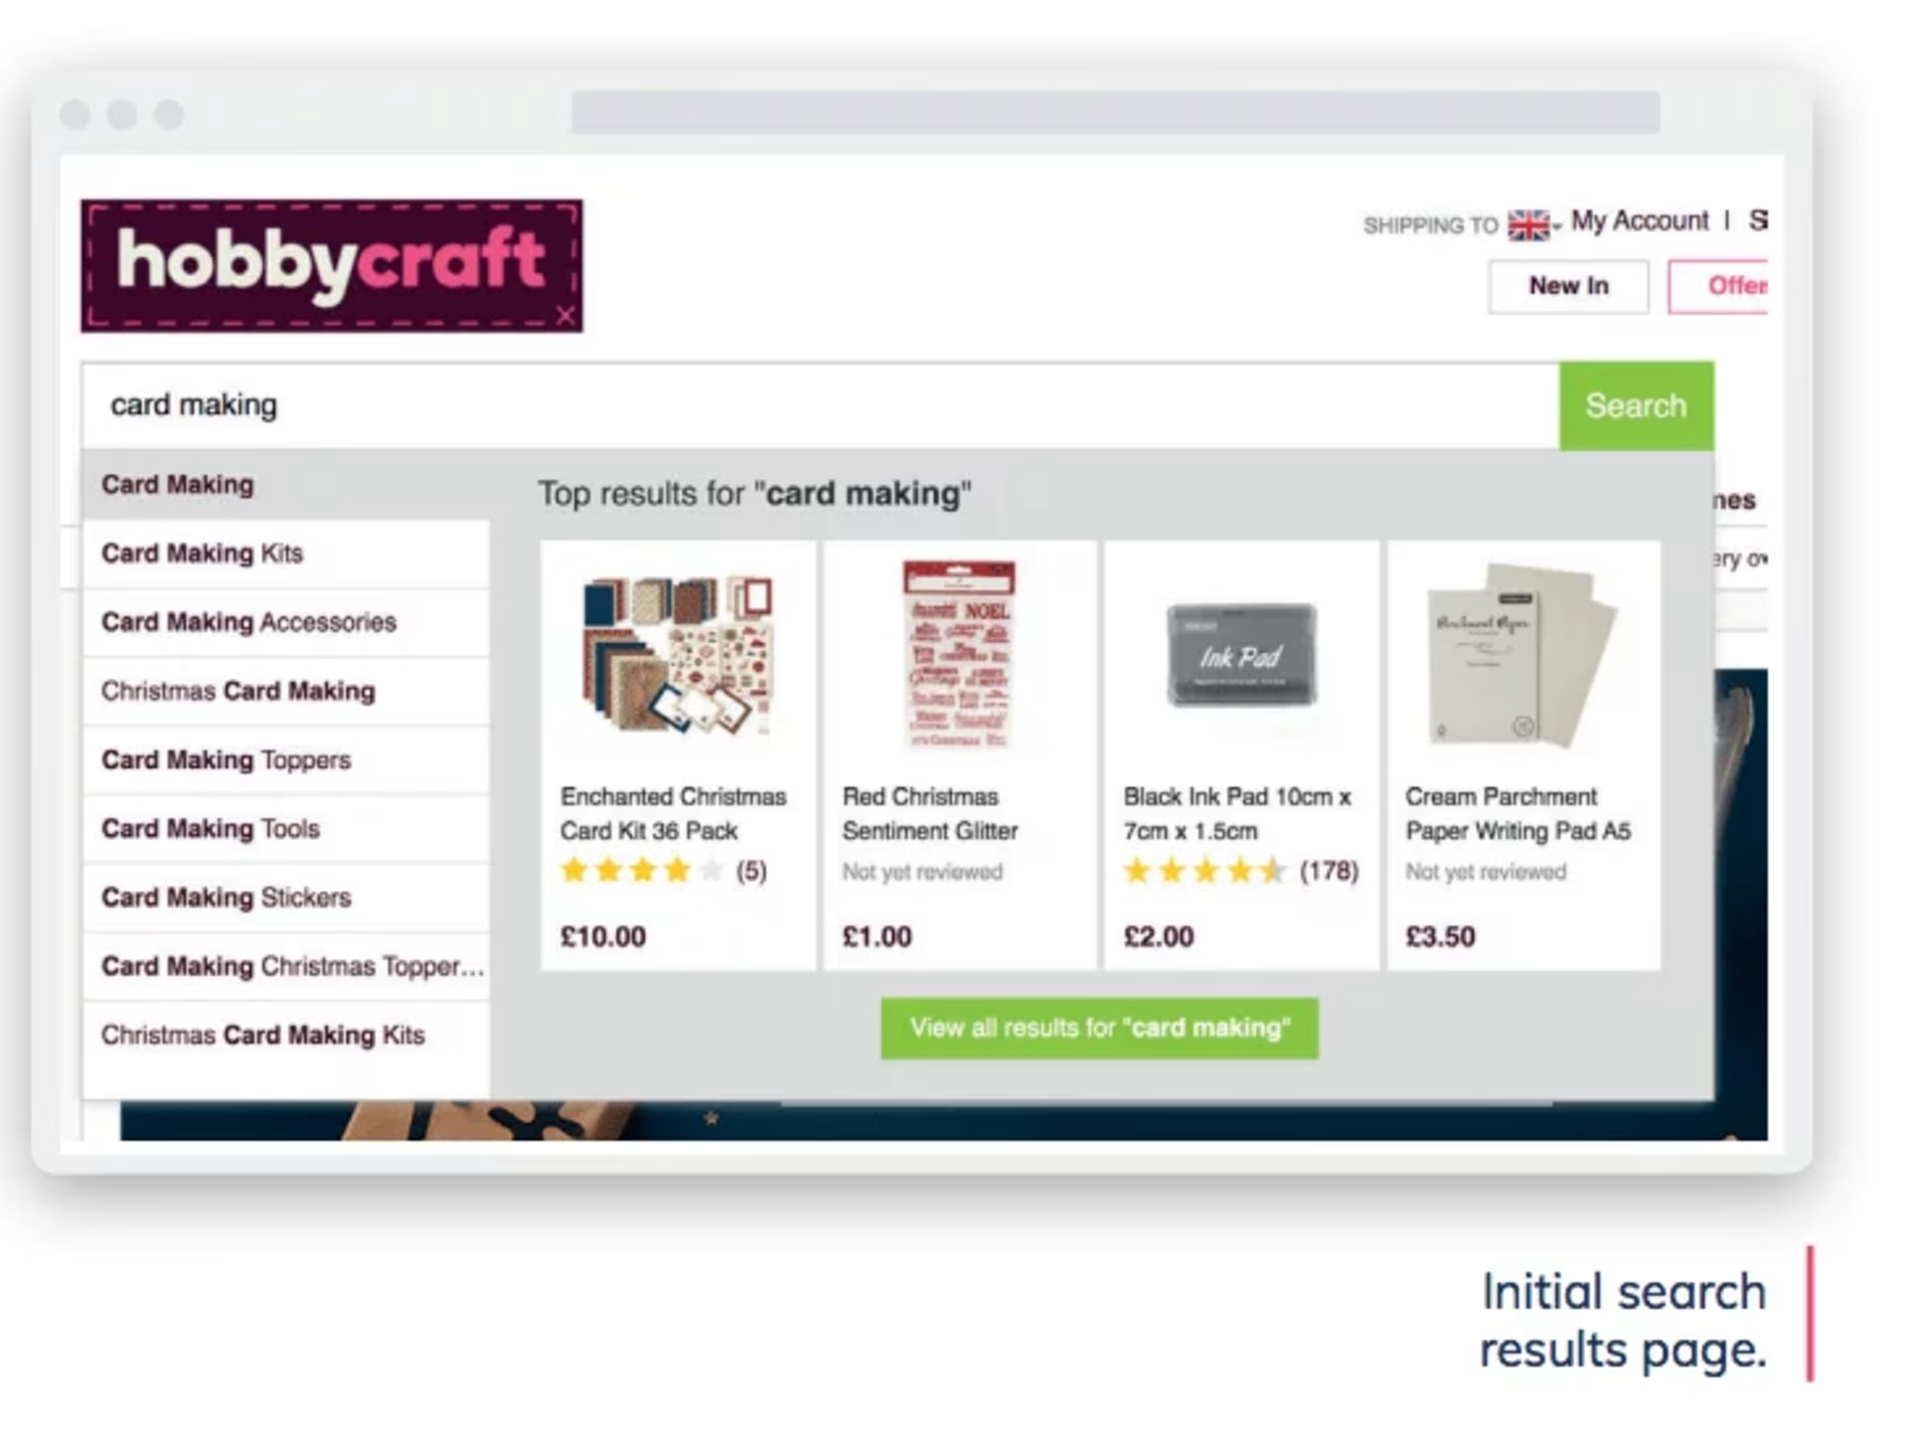
When they launched a new version of the site search, their goal was to ensure they help customers find the right products quickly and easily, and create a seamless online experience.
The Hobbycraft team would typically quantify the number of people using their search function to see how those people behaved on-site. However, with Google Analytics, they could only track users who viewed a search results page, which didn't capture everyone who used the search.
Visitors might click on a search suggestion and go straight to a product page, or get redirected directly from a search term—like when users search for ‘Christmas’, they are taken directly to the Christmas landing page.

The Hobbycraft website showing the search function
The solution
Using Contentsquare's Experience Analytics, Hobbycraft’s team was able to create a segment of users who interacted with the search box itself, rather than those who viewed a search results page. They defined the behaviours separately on desktop and mobile, and then combined these to give a single view of who was interacting with the search.
From there, they built a dashboard in Contentsquare to give an overview of several metrics with that search usage as a starting point.

We can drill down so easily in Contentsquare to identify on which device and by which channels are giving us the growth we need and which ones are the areas we actually need to deprioritize. This has helped contribute to our ecommerce sales growing double digits year after year.
The result
This dashboard listed stats such as search revenue—for that segment of searchers, how much revenue did they generate, number of visits, conversion rate—and they set that against total site visits, revenue, and conversion for example.
This gave them a clear view of what was going on on that site as they launched their new search function.
What's next
In addition to the search function, their team also tracked how other areas of the site were influenced by search behaviour. One of these was the product recommendations panel on the homepage—a carousel of products generated by the search engine.
In the first few days after launch, Heatmap analysis revealed that this section was underperforming compared to the old section.
Within days, they were able to trial a different set of products, increasing revenue from that section by +80%.
