The information on this page is correct as at 21/08/2024 to the best of Contentsquare’s understanding.
At first glance, Contentsquare and Glassbox might seem similar—both offer behavior analytics and product insights for enterprise brands. But look beyond the product pages and outdated reviews and you'll find significant differences—especially when you see how recent acquisitions have expanded Contentsquare's offering.
In this guide, we put our objective hats on and break down exactly how Contentsquare stacks up as a Glassbox alternative using insight from some of our customers who’ve switched to us. By the end, you'll have a clear understanding of each platform's strengths and which best aligns with your needs.
TL;DR
While Contentsquare enables Product, Marketing, UX, Data, and Technical teams to get a better understanding of their users' omni-channel digital experiences, Glassbox primarily helps technical users find and fix friction.
Both Contentsquare and Glassbox are enterprise solutions with advanced data security, privacy, and compliance certifications
Both Glassbox and Contentsquare autocapture data across websites and apps, no manual tagging required
Both Contentsquare and Glassbox have AI features to help you save time and find impactful insights without technical knowledge
Both Contentsquare and Glassbox have comprehensive behavior analytics and error monitoring tools like session replays and customer journeys, but only Contentsquare is an all-in-one solution with VoC and advanced product analytics tools to give you a holistic view of both digital experience and performance
Glassbox’s tools focus on finding friction and errors, while Contentsquare can also be used to optimize the whole funnel and quantify the business impact of issues and improvements
In contrast, Contentsquare supports a broader range of business roles by providing deep insights into customer behavior and experience for both technical teams and business teams
Contentsquare is a much larger company than Glassbox, trusted by 1.3+ million websites and apps, with 18 offices worldwide, over $1.4 billion in funding, 150+ integrations, and a 600-person R&D team—this means you can expect unrivaled local support and cutting-edge patented product features you won’t find elsewhere
For organizations prioritizing comprehensive insights for all teams and regions, Contentsquare is the recommended choice, while Glassbox may suit those with solely technical or departmental requirements.
Contentsquare vs. Glassbox: what are the main differences?
The best way to choose is by starting from your business goals. What are your biggest challenges in the business? Focus on the use cases that will actually let you solve those challenges.
Typical business goals and use cases | Contentsquare | Glassbox |
|---|---|---|
Do they uncover obstacles that prevent customers from achieving their goals? | Yes, absolutely | Yes, absolutely |
How do we surface obstacles on our sites and apps and prioritize what to fix based on revenue impact? | Very Strong | Very Strong |
How do we improve marketing acquisition, besides eliminating friction? | Very Strong | Medium |
How do we create better products, experiences, and A/B tests, besides fixing errors? | Very Strong | Medium |
How do we listen better by collecting feedback more automatically? | Medium | – |
How do we empower and align all teams for creating better experiences, not just technical teams? | Very Strong | Light |
How do we choose a partner that has the most local offices worldwide so they can support us locally? | Strong | Light |
What are the main differences between Contentsquare and Glassbox?
Contentsquare | Glassbox | |
|---|---|---|
Price | Custom | Custom |
Tracking | Cross-session autocapture across web & apps | Cross-session autocapture across web & apps |
Use cases | Whole funnel optimization for analytics, ecommerce, design, UX, marketing, IT, CX, and product teams | Finding technical errors, troubleshooting issues, conversion rate optimization |
Heatmaps | ✅ | ✅ |
Session replays | ✅ | ✅ |
Customer journey analysis | ✅ | ✅ |
Funnel analysis | ✅ | ✅ |
Error, speed, and frustration monitoring | ✅ | ✅ |
Product analytics | ✅ Complete | ✅ Limited |
VoC tools | ✅ Surveys, NPS, feedback button, user interviews, user testing | ❌ |
Additional tools | Merchandising Performance, Benchmarks, Form Analysis, Impact Quantification, Retention Analytics, User Segmentation | ❌ |
AI features | ✅ Automated insights, feedback and sentiment analysis, session replay summaries, smart alerts and recommendations, generate analytics charts with plain text prompts | ✅ Automated insights, anomaly detection, voice of the silent, filter insights with plain text prompts |
Support | ✅ Dedicated CSM, training & certification program, 600+ member leading brand community | ✅ Email, live chat & phone |
Integrations | ✅ 150+ | ✅ 20+ |
Enterprise privacy & security | ✅ Incl. ISO 27001, ISO 27701 Certified, SOC 2 Type II Compliant | ✅ Incl. ISO 27701, CSA Star, HIPAA |
What Contentsquare does that Glassbox doesn’t (and why it matters)
Unlike Glassbox, Contentsquare is the only all-in-one platform with tools and support for optimizing the whole customer lifecycle. Here are the main benefits you’ll get by choosing Contentsquare over Glassbox.
Comprehensive product analytics
Thanks in part to Contentsquare’s 2023 acquisition of Heap, the platform has enhanced product analytics capabilities that go beyond anything Glassbox offers.
In Contentsquare Product Analytics powered by Heap, you can
Create different analytics dashboards for any team in your org, from marketing to product to customer success
Generate any chart using a text prompt (for example, “How much revenue is generated by mobile users?”)
Connect charts to other tools like relevant session replays and journeys in one click
Quantify the revenue impact of every insight to make a business case for changes
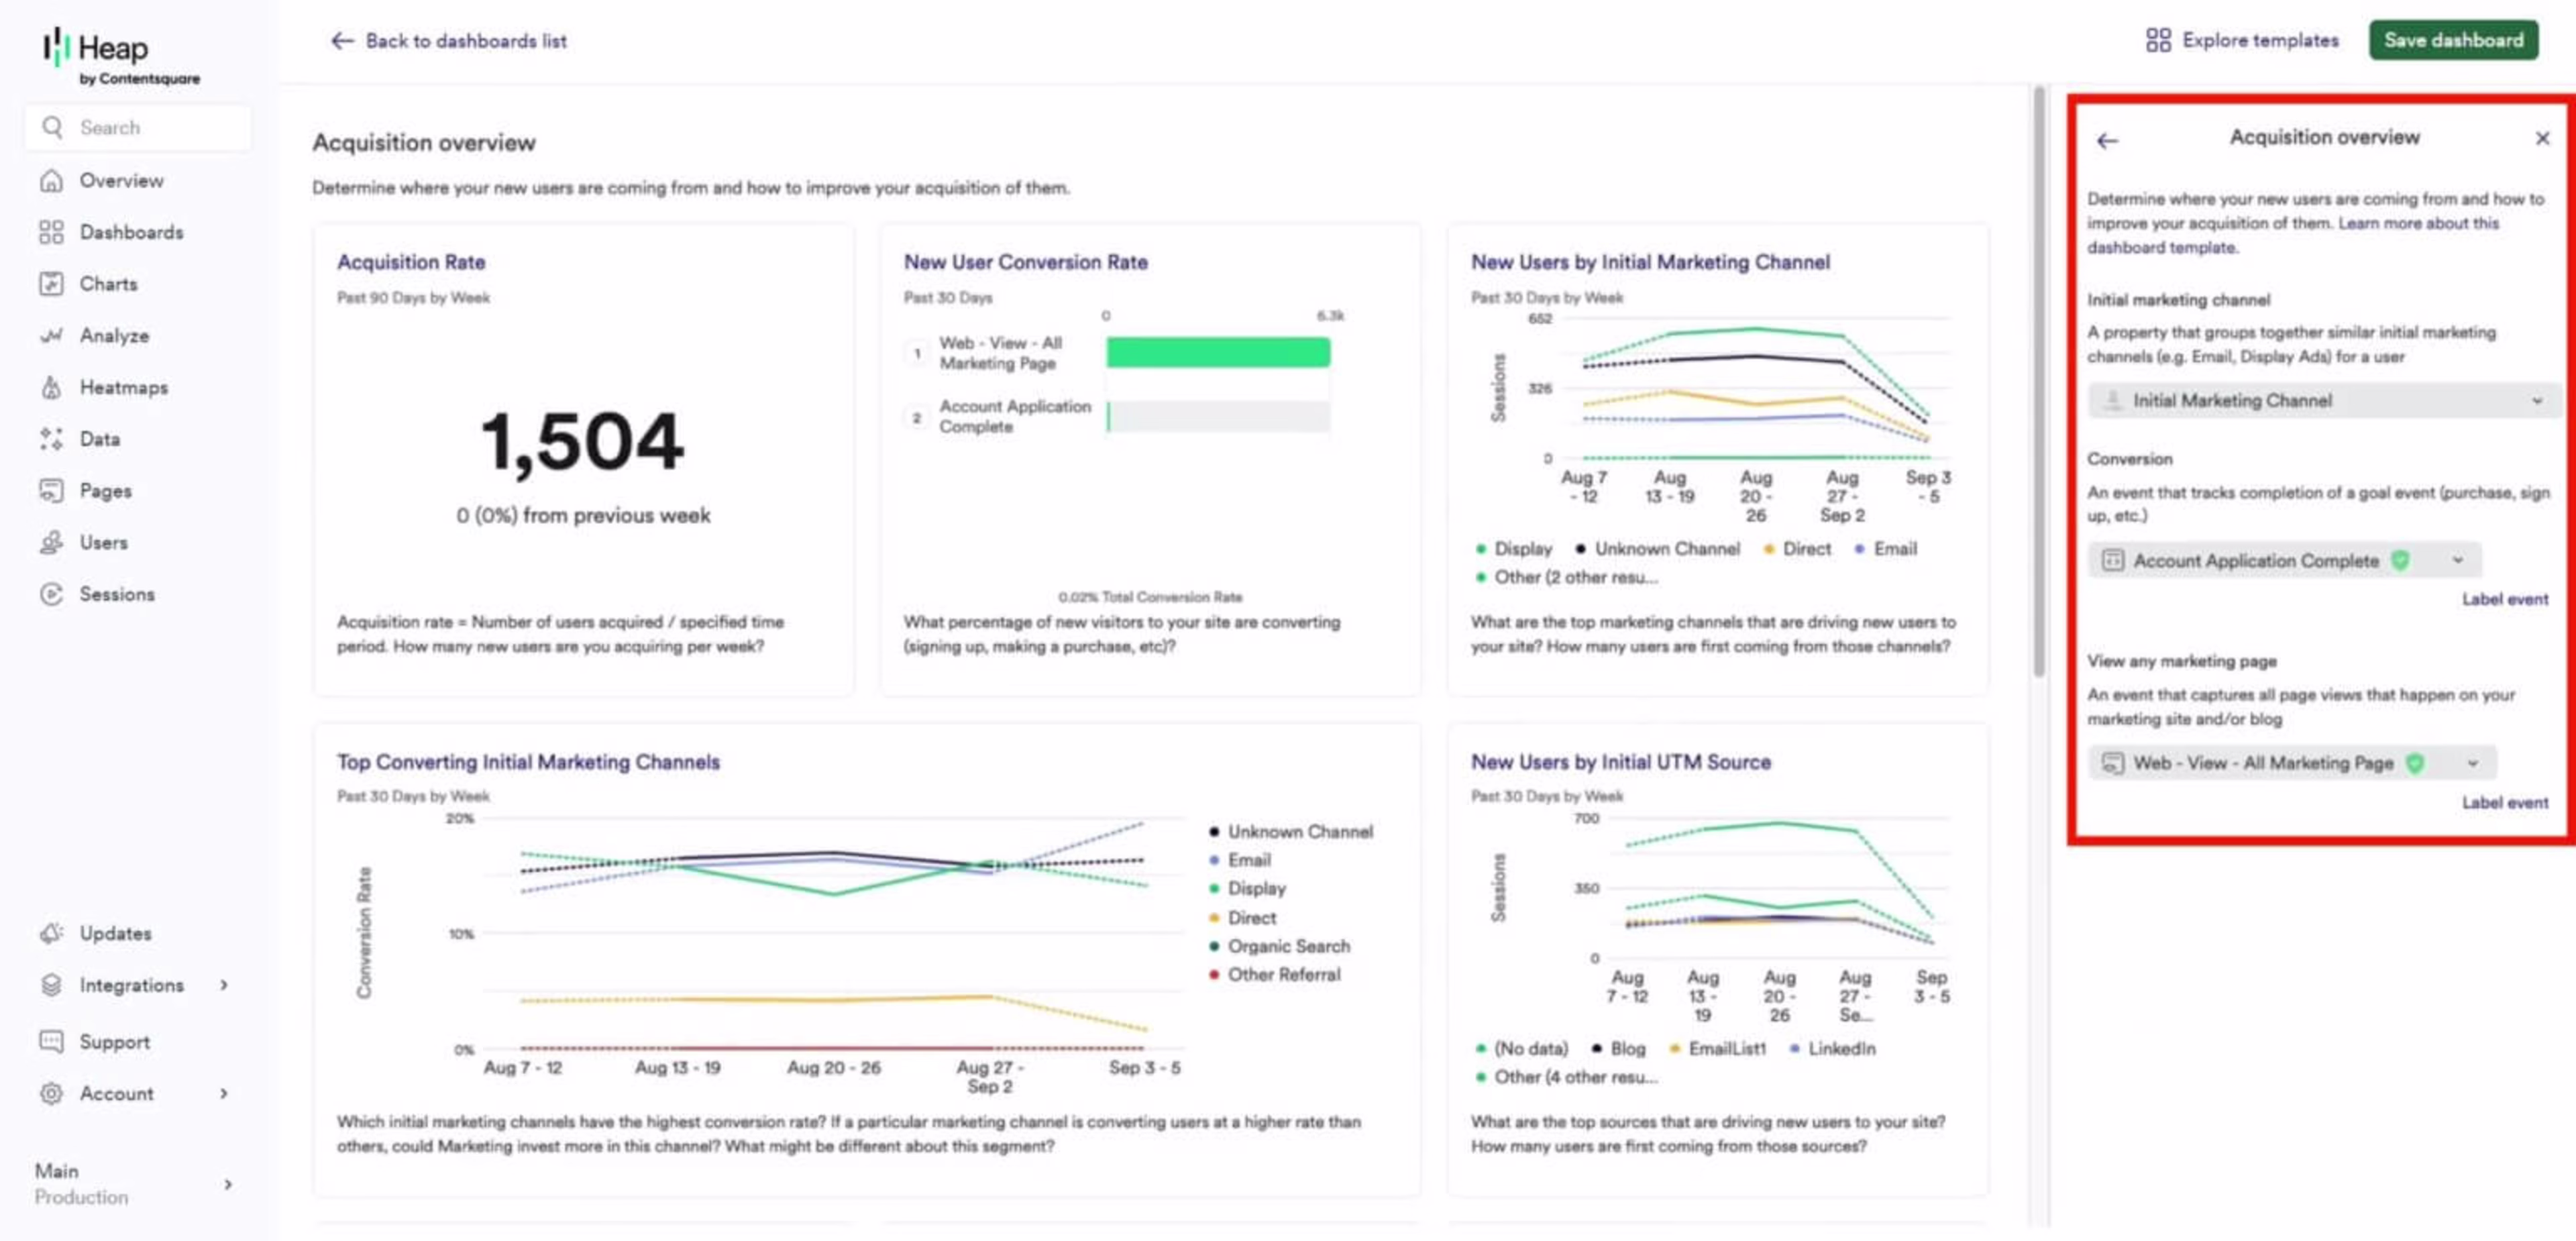
An acquisition dashboard with the overview tab open in Contentsquare Product Analytics powered by Heap
Voice of Customer (VoC) tools
While Glassbox has VoC analysis tools, you’ll need to integrate with other paid VoC tools like Qualaroo or SurveyMonkey to collect feedback.
With Contentsquare, you can collect, analyze, and connect feedback to analytics data in one tool to
Collect feedback anywhere in the customer journey with Surveys
Concept test designs and prototypes before launch with User Tests
Generate AI-powered survey summaries and automatically track sentiment
Quantify the impact of bad feedback on conversions and revenue
Connect feedback to session replays for deeper insights
Invite users for interviews with Interviews
Unrivaled support and easy-to-use tools for the whole org
With a huge global presence across 18 cities, Contentsquare offers an unmatched level of customer onboarding and ongoing support. You’ll get
A dedicated Customer Success Manager with regular check-ins and quarterly business reviews
Online and in-person training built around your own use cases
Live and self-paced certification programs from Contentsquare University
Access to the member community of 600+ leading brands
The key selling point of Contentsquare was its ease of implementation and impressive client success program. Knowing we’d get dedicated support from Contentsquare while onboarding and upskilling made the decision easy.

The [Glassbox] interface is sometimes quite confusing, as there are a lot of hoops to jump through to get desired data.
Unlike Glassbox, Contentsquare’s all-in-one platform is designed to deliver value across the org without a steep learning curve, giving you
Intuitive, visual tools and dashboards for marketing, CX, technical, analytics, ecommerce, UX, and product teams
150+ integrations and APIs to connect with your whole tech stack
Business value > vanity metrics
While both Glassbox and Contentsquare let you find and fix errors, only Contentsquare helps you proactively increase revenue and conversions, by
Using the Impact Quantification tool to instantly quantify the business impact of issues and surface high-priority opportunities
Filtering any insight by revenue impact, for example visualize the value of clicks on Zone-Based Heatmaps
Measuring how your company performs against competitors in the Benchmarks tool
Understanding the revenue and conversion impact of trends isn’t just for the C-suite—it empowers every team to make a business case for optimizations.
Contentsquare vs. Glassbox tools and feature comparison
Now you know the main differences between the two platforms, here's a tool-by-tool comparison of Contentsquare and Glassbox.
Heatmaps
Heatmaps are visual representations of how users interact with your website. Contentsquare and Glassbox both offer similar heatmap features:
They both show real-time live heatmaps using Chrome extensions—Contentsquare CS Live and Glassbox Extension
Both Contentsquare’s Zone-Based Heatmaps and Glassbox’s heatmaps show activity zones instead of single points on interaction
Both have side-by-side heatmap views for analyzing visitor behavior across segments
But there are some key differences:
Glassbox heatmaps only display surface-level basic metrics like number of clicks, while Contentsquare also enables you to visualize the impact of clicks with metrics like revenue
In Contentsquare, you can click through from heatmaps into product analytics insights to investigate the wider trends behind click and scroll behavior
Session replays
Session replays recreate how individual users browse your website across multiple pages. Again, you’ll find both tools have a lot in common here:
Both platforms automatically tag problematic sessions for you to focus on—Glassbox calls it Struggle Score, in Contentsquare it’s Frustration Score
Both platforms break down pageviews, events, and errors so you can identify any issues that occurred during the session
Both platforms let you share specific replays and events with your team to resolve issues quickly
The biggest differences are in the way session replay data is filtered and connected:
Contentsquare’s session replays are connected to its other tools, including Journeys, Heatmaps, Impact Quantification, and Form Analysis—click straight through for further analysis
Glassbox has a feature called GIA (Glassbox Insights Assistant) to find replays based on text prompts like “sessions with rage clicks”—you can achieve the same thing in Contentsquare using filters, or by chatting with AI CoPilot in the Product Analytics tool
Glassbox has a funnel builder inside the session replay tool that lets you drag and drop events into a funnel for later analysis—you can analyze funnels in Contentsquare using the Product Analytics tool instead.
![[Visual] Experience Analytics - Funnels](http://images.ctfassets.net/gwbpo1m641r7/3LjINpt1FnekwVhBzsSApK/04a750d05d8ac07d547f65682eb304c0/Experience_Analytics_-_Funnels.jpg?w=3840&q=100&fit=fill&fm=avif)
Customer journey mapping
Customer journey maps show you how users progress through your site from entry to exit. Both Contentsquare and Glassbox have dedicated journey-mapping tools:
Contentsquare has a Journey Analysis tool and Glassbox has a Customer Journey Analytics tool
Both tools let you filter journeys and click through to relevant session replays
![[visual] Journey Analysis showing how an API error makes users bounce](http://images.ctfassets.net/gwbpo1m641r7/447rDhfFAaCxBEC9zUdX0h/e1d6f86f94f42e220b8911ba848935d1/error_analysis_in_Contentsquare_Journeys.png?w=3840&q=100&fit=fill&fm=avif)
Customer journey maps in Contentsquare
However, Contentsquare has more features that make it easier to analyze and troubleshoot journeys without getting lost in a maze of squiggly lines:
Only Contentsquare visualizes journeys in a sunburst chart—inner rings represent start pages and outer rings are exits
Only Contentsquare lets you compare journeys side-by-side—use this to quickly see how different traffic sources or A/B tests perform
Only Contentsquare lets you run one-click exit analysis to see exactly the issues that led to bounces
Product analytics
Product analytics show you exactly how your product, website, or app is performing.
While both Contentsquare and Glassbox offer product analytics that integrate with their behavior analytics tools, Glassbox’s offering is quite limited:
Glassbox has dedicated mobile app analytics tool—you can do the same in Contentsquare by creating a mobile app dashboard in Heap, part of the Contentsquare group
Glassbox only lets you monitor limited top-level data, like pageviews, errors, and speed
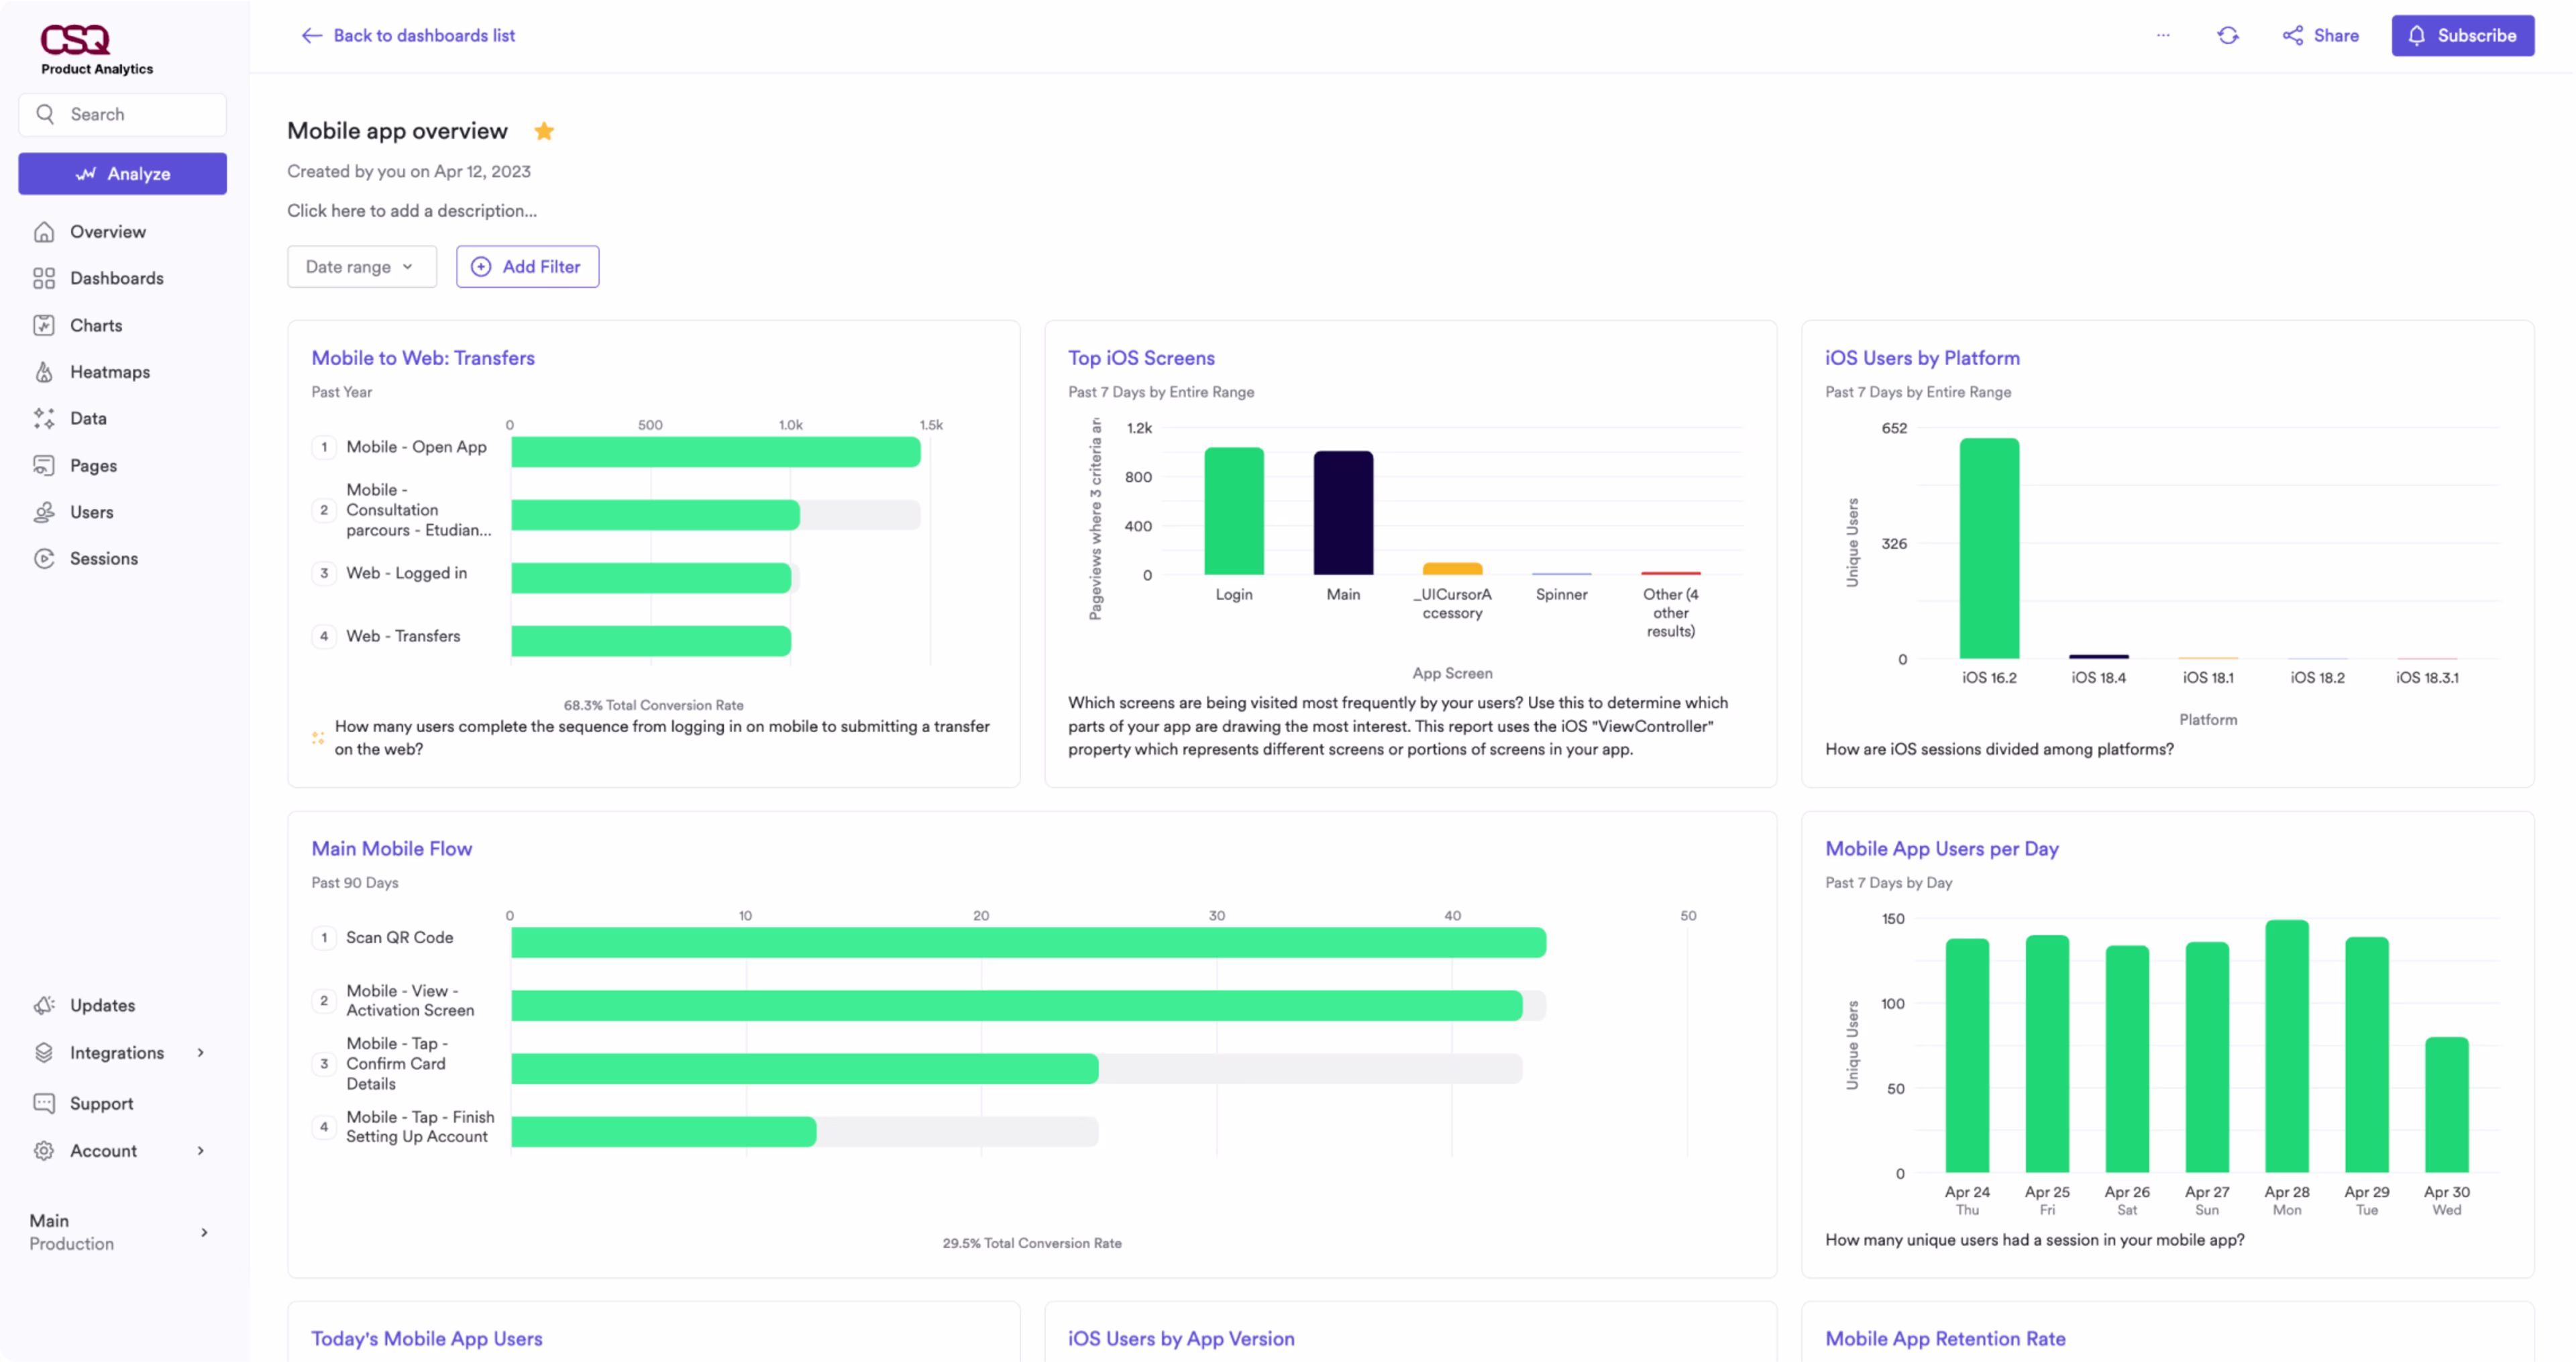
Mobile app analytics dashboards in Contentsquare
With Contentsquare, you can monitor every product metric in a single platform and
Create multiple product analytics dashboards for different teams, like an acquisition dashboard for marketing or a retention dashboard for the product team
Click to generate relevant analytics reports from other Contentsquare tools, like session replays or funnels—and vice versa
Generate insights and charts by chatting with Sense AI in plain language
![[visual] Get faster insights with Sense, Contentsquare’s AI layer](http://images.ctfassets.net/gwbpo1m641r7/5rQd9GN12iyKIqlgPZ9sBX/fce9ea9d54dedf0b02653586f0d1f70a/Contentsquare-Sense-AI.png?w=2048&q=100&fit=fill&fm=avif)
Voice of Customer
Collecting voice of customer data captures the sentiment of your most important business asset: your customers.
Glassbox does not offer native VoC tools—you’ll have to integrate with another paid tool like SurveyMonkey or Qualtrics to collect feedback.
With Contentsquare, you have the option to integrate or use built-in VoC tools, including
Surveys: trigger AI-powered on-page surveys to ask users anything, like why they’re leaving or Net Promoter®Score, and let AI-powered survey summaries and sentiment analysis quantify qualitative feedback and save you time on analysis
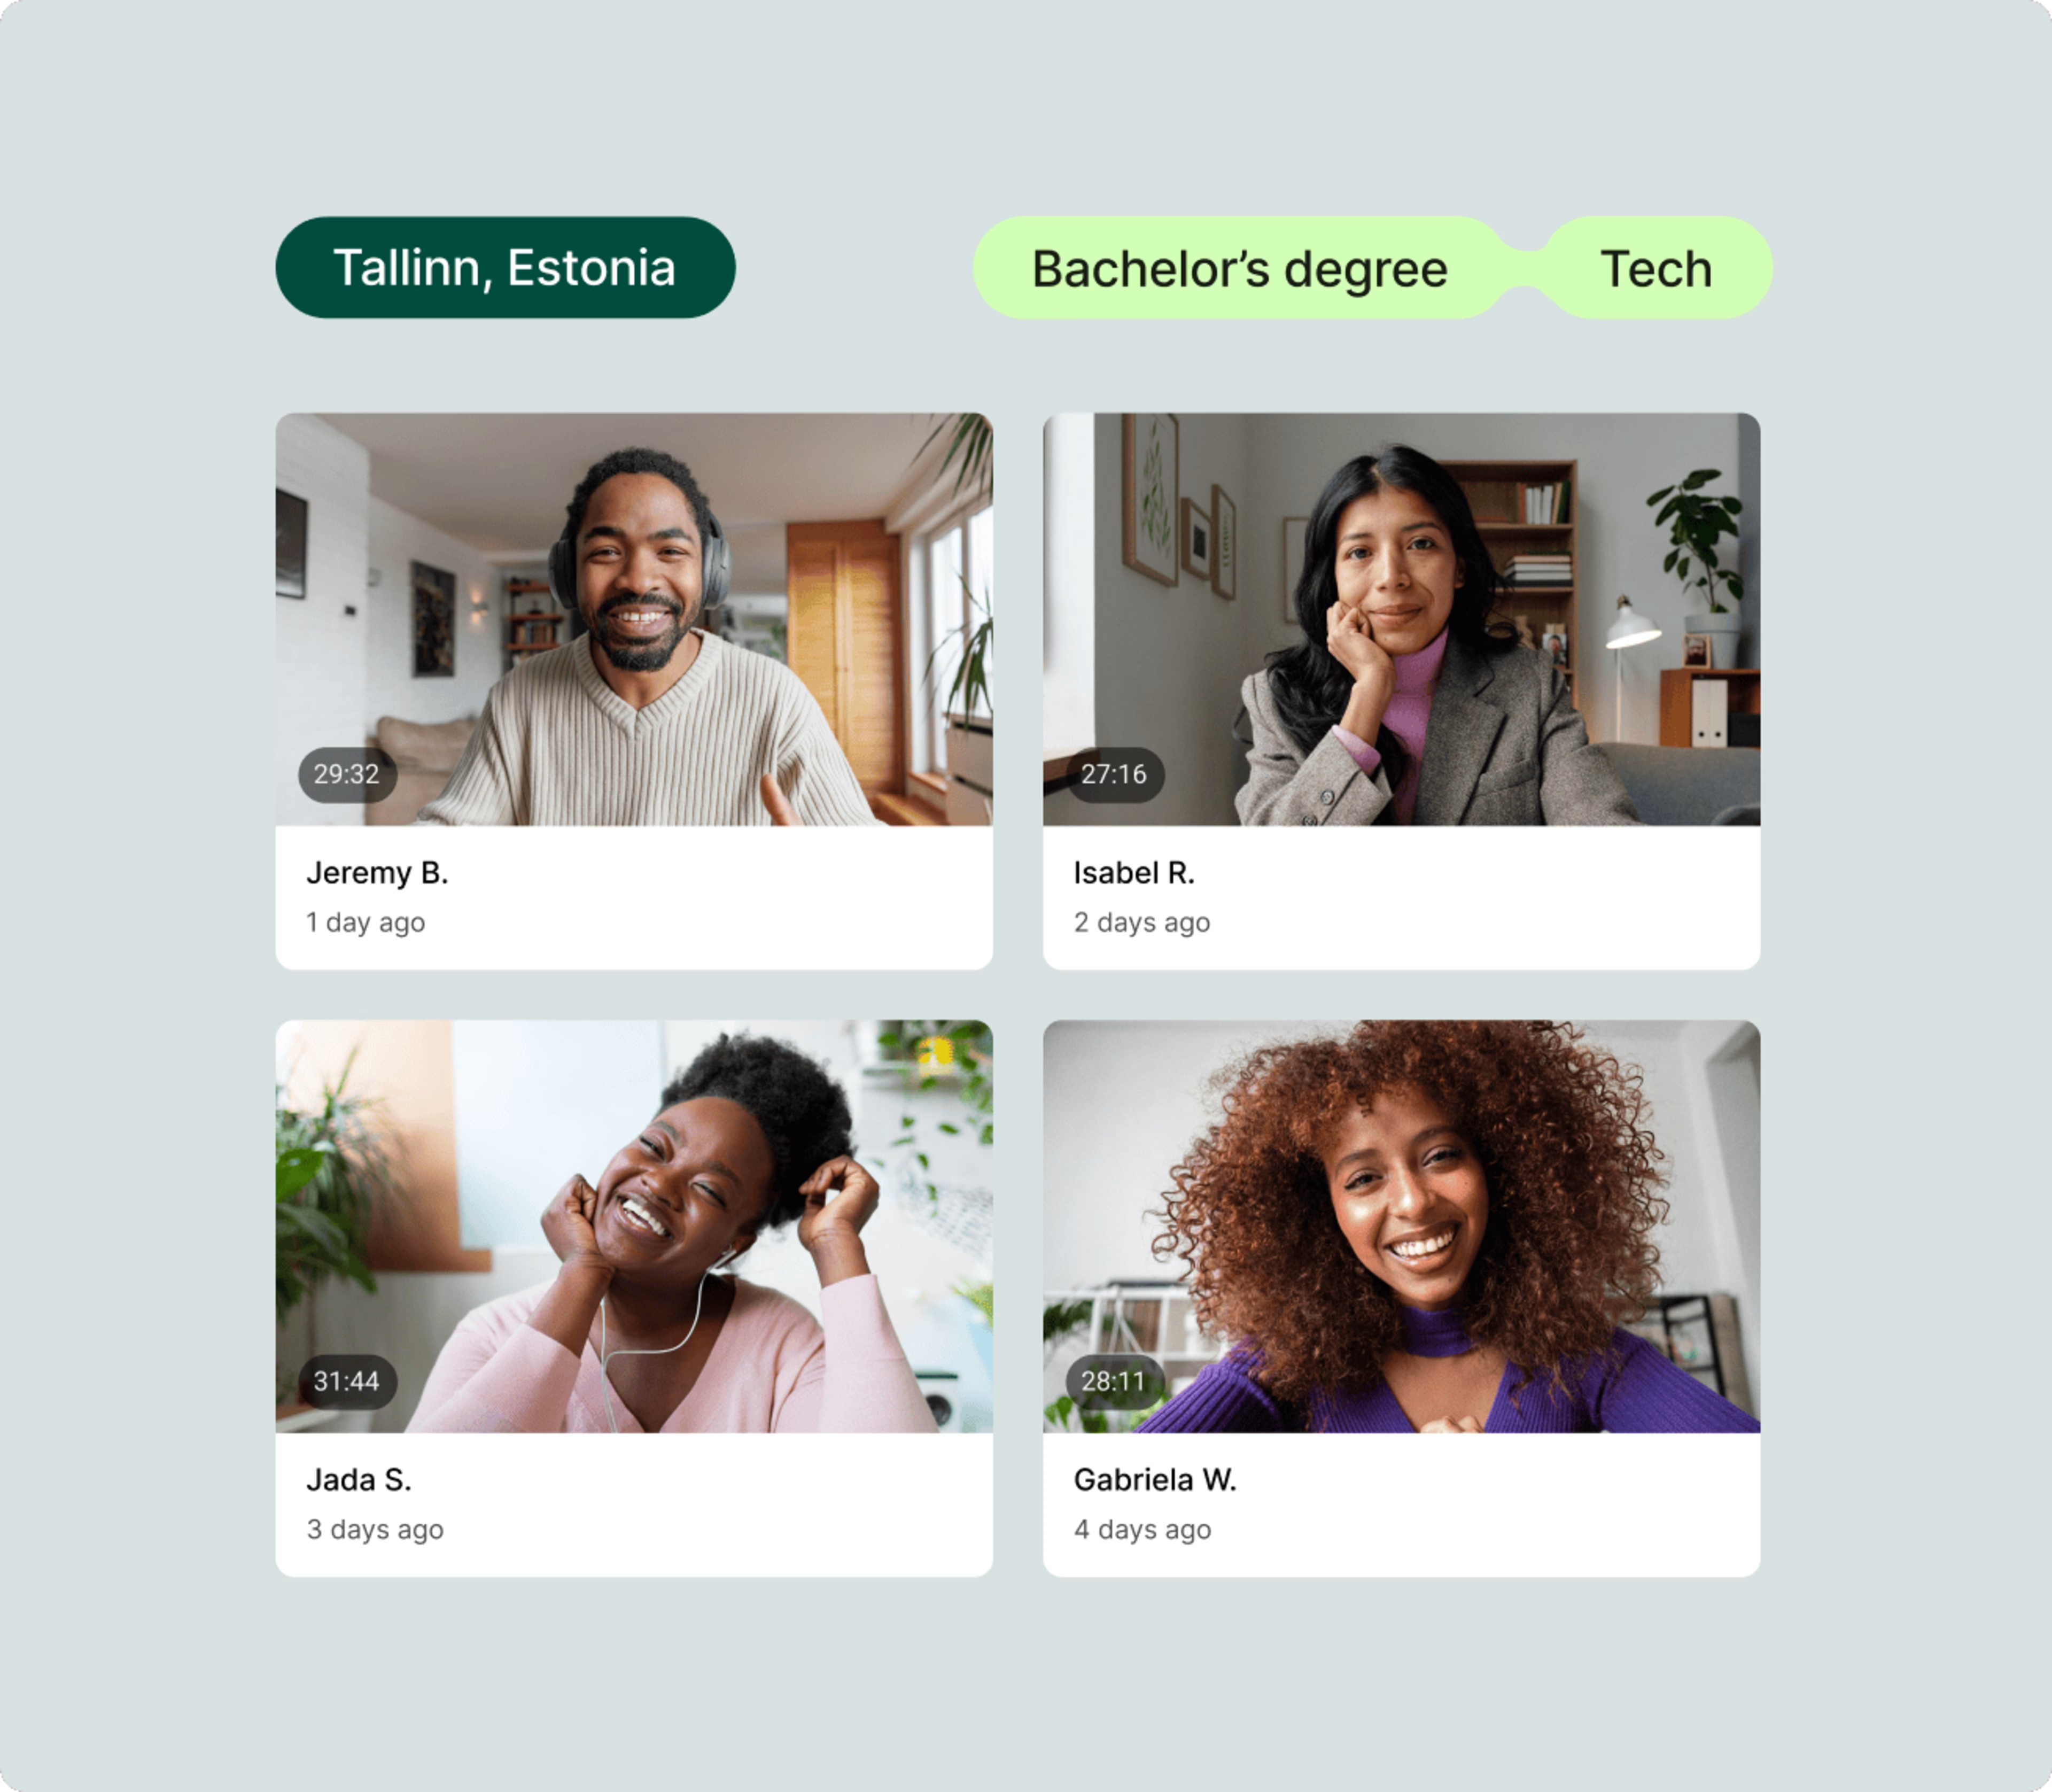
Interviews: dive deeper into any topics in live conversations with your users to uncover pain points, hesitations, and emotions you might have missed in written feedback
User Tests: test designs and prototypes with your target market and get candid feedback, without the need for a moderator
![[visual] Run user interviews and unmoderated tests in Contentsquare](http://images.ctfassets.net/gwbpo1m641r7/5TRZhRs0R1KqnCDMf26i0K/e2c6844688c50347fc8435bdf1d2e91f/User-testing-in-Medallia-vs-Contentsquare.jpg?w=3840&q=100&fit=fill&fm=avif)
Glassbox has a feature they call Voice of the Silent that uses machine learning to extrapolate user experience by customer actions. We admit it’s a catchy name, but you can achieve the same thing using Contentsquare’s Impact Quantification and Error Analysis tools and you’ll still need to collect real user feedback to make it work.
Performance monitoring and error tracking
Finding technical bugs—both before rollouts and ongoingly—is the quickest way to improve UX and grow conversions.
Both Contentsquare and Glassdoor have robust experience monitoring tools with lots of overlap:
Contentsquare’s Error Analysis tool in Experience Monitoring automatically finds, logs, and prioritizes all site errors, with one-click links to related session replays
Contentsquare’s Speed Analysis tool does the same for site speed issues
Glassbox has a Struggle Analysis tool that brings together different errors (like speed, Ajax errors, and rage clicks) into one dashboard, with links to affected session replays and journeys for further analysis
Both platforms offer real-time alerts for critical issues and integrations with tools like Jira to streamline the bug-fixing workflow
Both platforms have real user monitoring (RUM) and synthetic monitoring to proactively identify user performance issues
Contentsquare's Impact Quantification feature calculates the potential revenue impact of each issue, helping teams prioritize fixes based on business value
![[visual] Impact Quantification lets you click to quantify any issue or behavior across the Contentsquare platform](http://images.ctfassets.net/gwbpo1m641r7/5CZmjUD8zx7cJVs5qga3vn/84508e60782752ce785926d7a2c06f50/api_error.png?w=1920&q=100&fit=fill&fm=avif)
Integrations
Integrating your digital experience platform with the rest of your tech stack will help you break down data silos, gain richer context for your insights, and drive more impactful optimizations across channels.
Contentsquare has 150+ pre-built integrations, including
A/B testing tools, like AB Tasty, Optimizely, and Monetate
Analytics tools, like Adobe Analytics, Google Analytics, and Mixpanel
VoC tools, like Qualtrics, GetFeedback, and Medallia
Application performance management tools, like New Relic, Datadog, and Dynatrace
Collaboration tools, like Jira, Slack, and Microsoft Teams
Chat tools, like Zendesk, Intercom, and Salesforce LiveAgent
Contentsquare also has 3 APIs to send and pull in data and metrics to and from almost any tool.
Glassbox only has around 25 integrations, but its open API allows connections with most third-party tools.
The verdict: is Contentsquare or Glassbox better for your team?
Contentsquare is the best choice for
Unrivaled support: benefit from a dedicated CSM, tailored training & certification program, and a 600+ member community of top global brands
Whole org adoption: unify and leverage insights across the org
Tech and non-tech users: interact with visual, intuitive data and generate reports using plain language
Revenue-focused teams: backup any optimization recommendation with revenue and conversion impact metrics
Ecommerce teams: automatically surface insights to increase conversions and revenue
Product managers: create retention dashboards and use data to prioritize product backlog
CX, UX and QA teams: find bugs, collect VoC feedback, speed up reporting with AI alerts, summaries and next steps
Enterprise organizations: scale whole funnel insights across multiple brands, websites, and apps with robust governance and cutting-edge features (100+ patents)
However, Glassbox might be a better choice than Contentsquare if
You’re working as part of technical team and are mostly focused on finding and fixing points of friction
You’re primarily interested in one or two features and don't need advanced analytics or revenue impact insights
Ultimately, Contentsquare is a more comprehensive, user-friendly, and business-impact-focused solution compared to Glassbox's more limited, technically-oriented approach.
But the only way to know for certain what’s best for your team is to see it for yourself. Take a product tour and see how Contentsquare's AI-powered insights will help you make data-driven decisions to boost revenue and transform your digital strategy.
Contentsquare vs Glassbox FAQs
Glassbox (formerly Clarisite) is a digital customer experience analytics platform founded in Israel in 2010 by Yoav Schreiber, Yaron Gueta, and Hanan Blumstein. Glassbox acquired SessionCam in 2020 and floated on the Tel-Aviv stock exchange in 2021. Today, Glassbox has 3 global offices, a team of 350+, and is in the process of becoming a private company again after an acquisition by Alicorn Venture Partners.
Net Promoter®, NPS®, NPS Prism®, and the NPS-related emoticons are registered trademarks of Bain & Company, Inc., NICE Systems, Inc., and Fred Reichheld. Net Promoter ScoreSM and Net Promoter SystemSM are service marks of Bain & Company, Inc., NICE Systems, Inc., and Fred Reichheld.
![[Visual] Contentsquare's Content Team](http://images.ctfassets.net/gwbpo1m641r7/3IVEUbRzFIoC9mf5EJ2qHY/f25ccd2131dfd63f5c63b5b92cc4ba20/Copy_of_Copy_of_BLOG-icp-8117438.jpeg?w=1920&q=100&fit=fill&fm=avif)
We’re an international team of content experts and writers with a passion for all things customer experience (CX). From best practices to the hottest trends in digital, we’ve got it covered. Explore our guides to learn everything you need to know to create experiences that your customers will love. Happy reading!