The information on this page is correct as at 18/10/2025 to the best of Contentsquare's understanding.
Adobe Analytics has been known as the world’s most advanced web analytics platform ever. For over two decades, the world’s leading digital teams have managed their businesses based on Adobe Analytics data. While Adobe Analytics remains equally valuable today, websites and apps are not what they used to be when Adobe Analytics was first created under the name of Omniture (or even My Computer before then).
TL;DR
Adobe Analytics and Contentsquare are both powerful, feature-rich analytics platforms, but they’re designed for different primary use cases.
Adobe Analytics is popular with data scientists and marketing analysts, but that means
Complex implementation and usage
Significant investment in training and resources
Only specialized experts can get value from it
Contentsquare takes a more holistic approach by combining behavioral data, advanced analytics, and artificial intelligence to
Optimize the entire customer journey
Empower every team member to make data-driven decisions
Deliver easy-to-follow automatic optimization recommendations
The good news is that both platforms can also work seamlessly together thanks to Contentsquare's Adobe Analytics integration.
Contentsquare Product Analytics and Adobe are even better when combined with Contentsquare Experience Analytics. Hundreds of enterprises today use Contentsquare Experience Analytics to transform their users’ ability to make data-driven decisions with the help of immersive visual insights into user experiences, frustrations, and their underlying root causes.
In a typical joint usage scenario,
Adobe is used for executive dashboards and in conjunction with the Adobe Experience and Content Platforms
Contentsquare Product Analytics is used by teams to quickly answer everyday questions about behaviors and journeys on the site or in the app
Contentsquare Experience Analytics answers why certain behaviors or experience issues are happening and how to improve outcomes.
Contentsquare Voice of Customer enriches these insights with direct user feedback
The combination helps teams
Manage their digital business and roadmap based on Northstar KPIs
Create journeys and content experiences that convert better
Create friction-free experiences by surfacing frustrations and their root causes
Create happy users by collecting feedback directly via surveys, feedback, and usability tests
Contact us to get recommendations for your specific use cases and to learn how Contentsquare can save you time, effort and costs.
What are the main differences between Contentsquare vs Adobe?
Instead of jumping into a tool comparison, start from your business goals. What are your biggest business challenges? Choose the platform that’s designed to help you achieve your goals.
Here’s an overview of the main use cases that Contentsquare and Adobe Analytics were designed to solve, from our perspective
Typical business goals and use cases | Contentsquare | Adobe |
|---|---|---|
Does it help improve marketing acquisition? | Yes, absolutely | Yes, absolutely |
How do we improve marketing acquisition? | Very Strong | Strong, but limited due to typical data gaps |
How do we create better products and drive user adoption and growth? | Very Strong | Very light |
How do we improve experiences, content engagement, and conversion? | Very Strong | - |
How do we surface obstacles and prioritize what to fix based on revenue impact? | Very Strong | - |
How do we create happier customers by collecting their feedback and making sense of it? | Medium | - |
Part of a larger platform? | 115+ integrationswith best of breed providers | Very Strong, e.g. Adobe Experience Platform |
Analytics tools were built for the experiences of their time
Adobe Analytics was originally created in an era when websites used to be mere electronic brochures back in the early 2000s. During the rise of ecommerce and lead gen websites in subsequent years, Adobe Analytics kept up with the trend by adding strong marketing and conversion reporting.
But today’s websites and apps are incredibly rich and interactive content experiences. Understanding user behavior and what’s working vs. not for engaging potential customers now requires much more detailed insights than pageview level data and conversion metrics. Especially so, for experiences on small mobile screens.
Perhaps 99% of user journeys and behaviors are happening inside pages and screens now, i.e.
Scrolling,
Engaging with content,
Hesitating,
Tapping various interactive features
Sometimes struggling with things that are slow or broken
To eventually continue and complete journeys within the same session and on the same device or another
Or to give up and bail instead
Understanding these rich experiences requires analytics built for the modern era. That’s exactly what led to the rise of modern analytics solutions, also known as Product and Experience Analytics.
Traditional web analytics tools that require manual tagging do not scale well for understanding today’s experiences
Adapting traditional web analytics tools to capture the level of data needed for understanding today’s experiences requires the workaround of deploying additional data collection tags for every in-page click event that teams want to analyze.
But the common concern is that every additional tag takes time to deploy and requires teams to wait before they can answer questions. Manual tagging analytics tools require too much customization and manual tagging to be practical. Teams want to extend these traditional tools for understanding dynamic web and app interactions, but oftentimes they simply can’t seem to tag quickly enough to close data gaps for being able to answer the everyday questions that come up.
Common complaints we hear from the users of these tools are
Data gaps: In theory, you can tag any event, but you can never tag every event. Data gaps are unavoidable.
Limited answers: If you didn’t tag it, it’s not retroactive, you can’t answer the question
High cost: Constant tagging is an effort, blocks data teams and burdens engineering teams who have a different scope,
Extra fees: Every additional click event captured increases the fees incurred from the tool vendor
The problem is worse for Apps: It’s problematic enough for websites, but tagging takes much longer, and requires more effort and time for instrumenting mobile apps
That’s why many companies come to Contentsquare for an alternative option.
Contentsquare vs. Adobe Analytics
Adobe and Contentsquare are both top-rated platforms for digital analytics. They are frequently compared to each other.
Hundreds of companies are using Contentsquare Product Analytics for use cases where they found that they could not customize Adobe Analytics quickly enough to answer their everyday questions. Contentsquare lowers their total cost of ownership by auto capturing more complete data about users’ behaviors without the need for manually tagging every click event that they want to understand better.
Equally often, Adobe and Contentsquare Experience Analytics are used in conjunction with each other. They even integrate so that Contentsquare visualizes the experiences and behaviors of customer segments defined within Adobe Analytics. That enables teams to better understand their intent vs. actual experiences and prioritize what to enhance and fix based on business impact.
Whether you are best served by augmenting Adobe with Contentsquare Experience Analytics or replacing some of your Adobe use cases with Contentsquare Product Analytics depends on your goals.
How do we improve marketing acquisition, besides eliminating friction?
Acquiring customers sustainably and at scale is the bread and butter of every online business.
Both Adobe Analytics and Contentsquare equip marketers with robust tools for tracking marketing performance and optimizing campaigns across channels—either could replace Adobe competitors like Adobe Analytics.
You can use Adobe Analytics to gain insights into marketing acquisition with
Web analytics—analyze website traffic using complex segmentation and predictive tools
Marketing analytics—understand how customers interact with your brand thanks to multichannel data collection and offline data integration
Attribution—see how customer journey interactions affect conversion using machine learning and advanced statistical models
Predictive analytics—analyze customer data, find patterns, and predict future behavior such as churn or likelihood to convert
With Contentsquare, you can achieve the same outcome with
Web analytics—analyze traffic performance and user behavior with intuitive visualizations
Marketing analytics—understand how customers interact with your brand across multiple channels, including web, mobile, and offline touchpoints
Customer journey analysis—visualize user paths with unique sunburst charts, identifying which acquisition channels and content drive conversions
AI-powered insights—ask your data for acquisition insights using Contentsquare’s Sense AI
It’s worth noting that some tools and visualizations that you get as standard in Contentsquare, like advanced funnel analysis and customer journey maps, are only available in Adobe Analytics if you also get the Customer Journey Analytics add on.
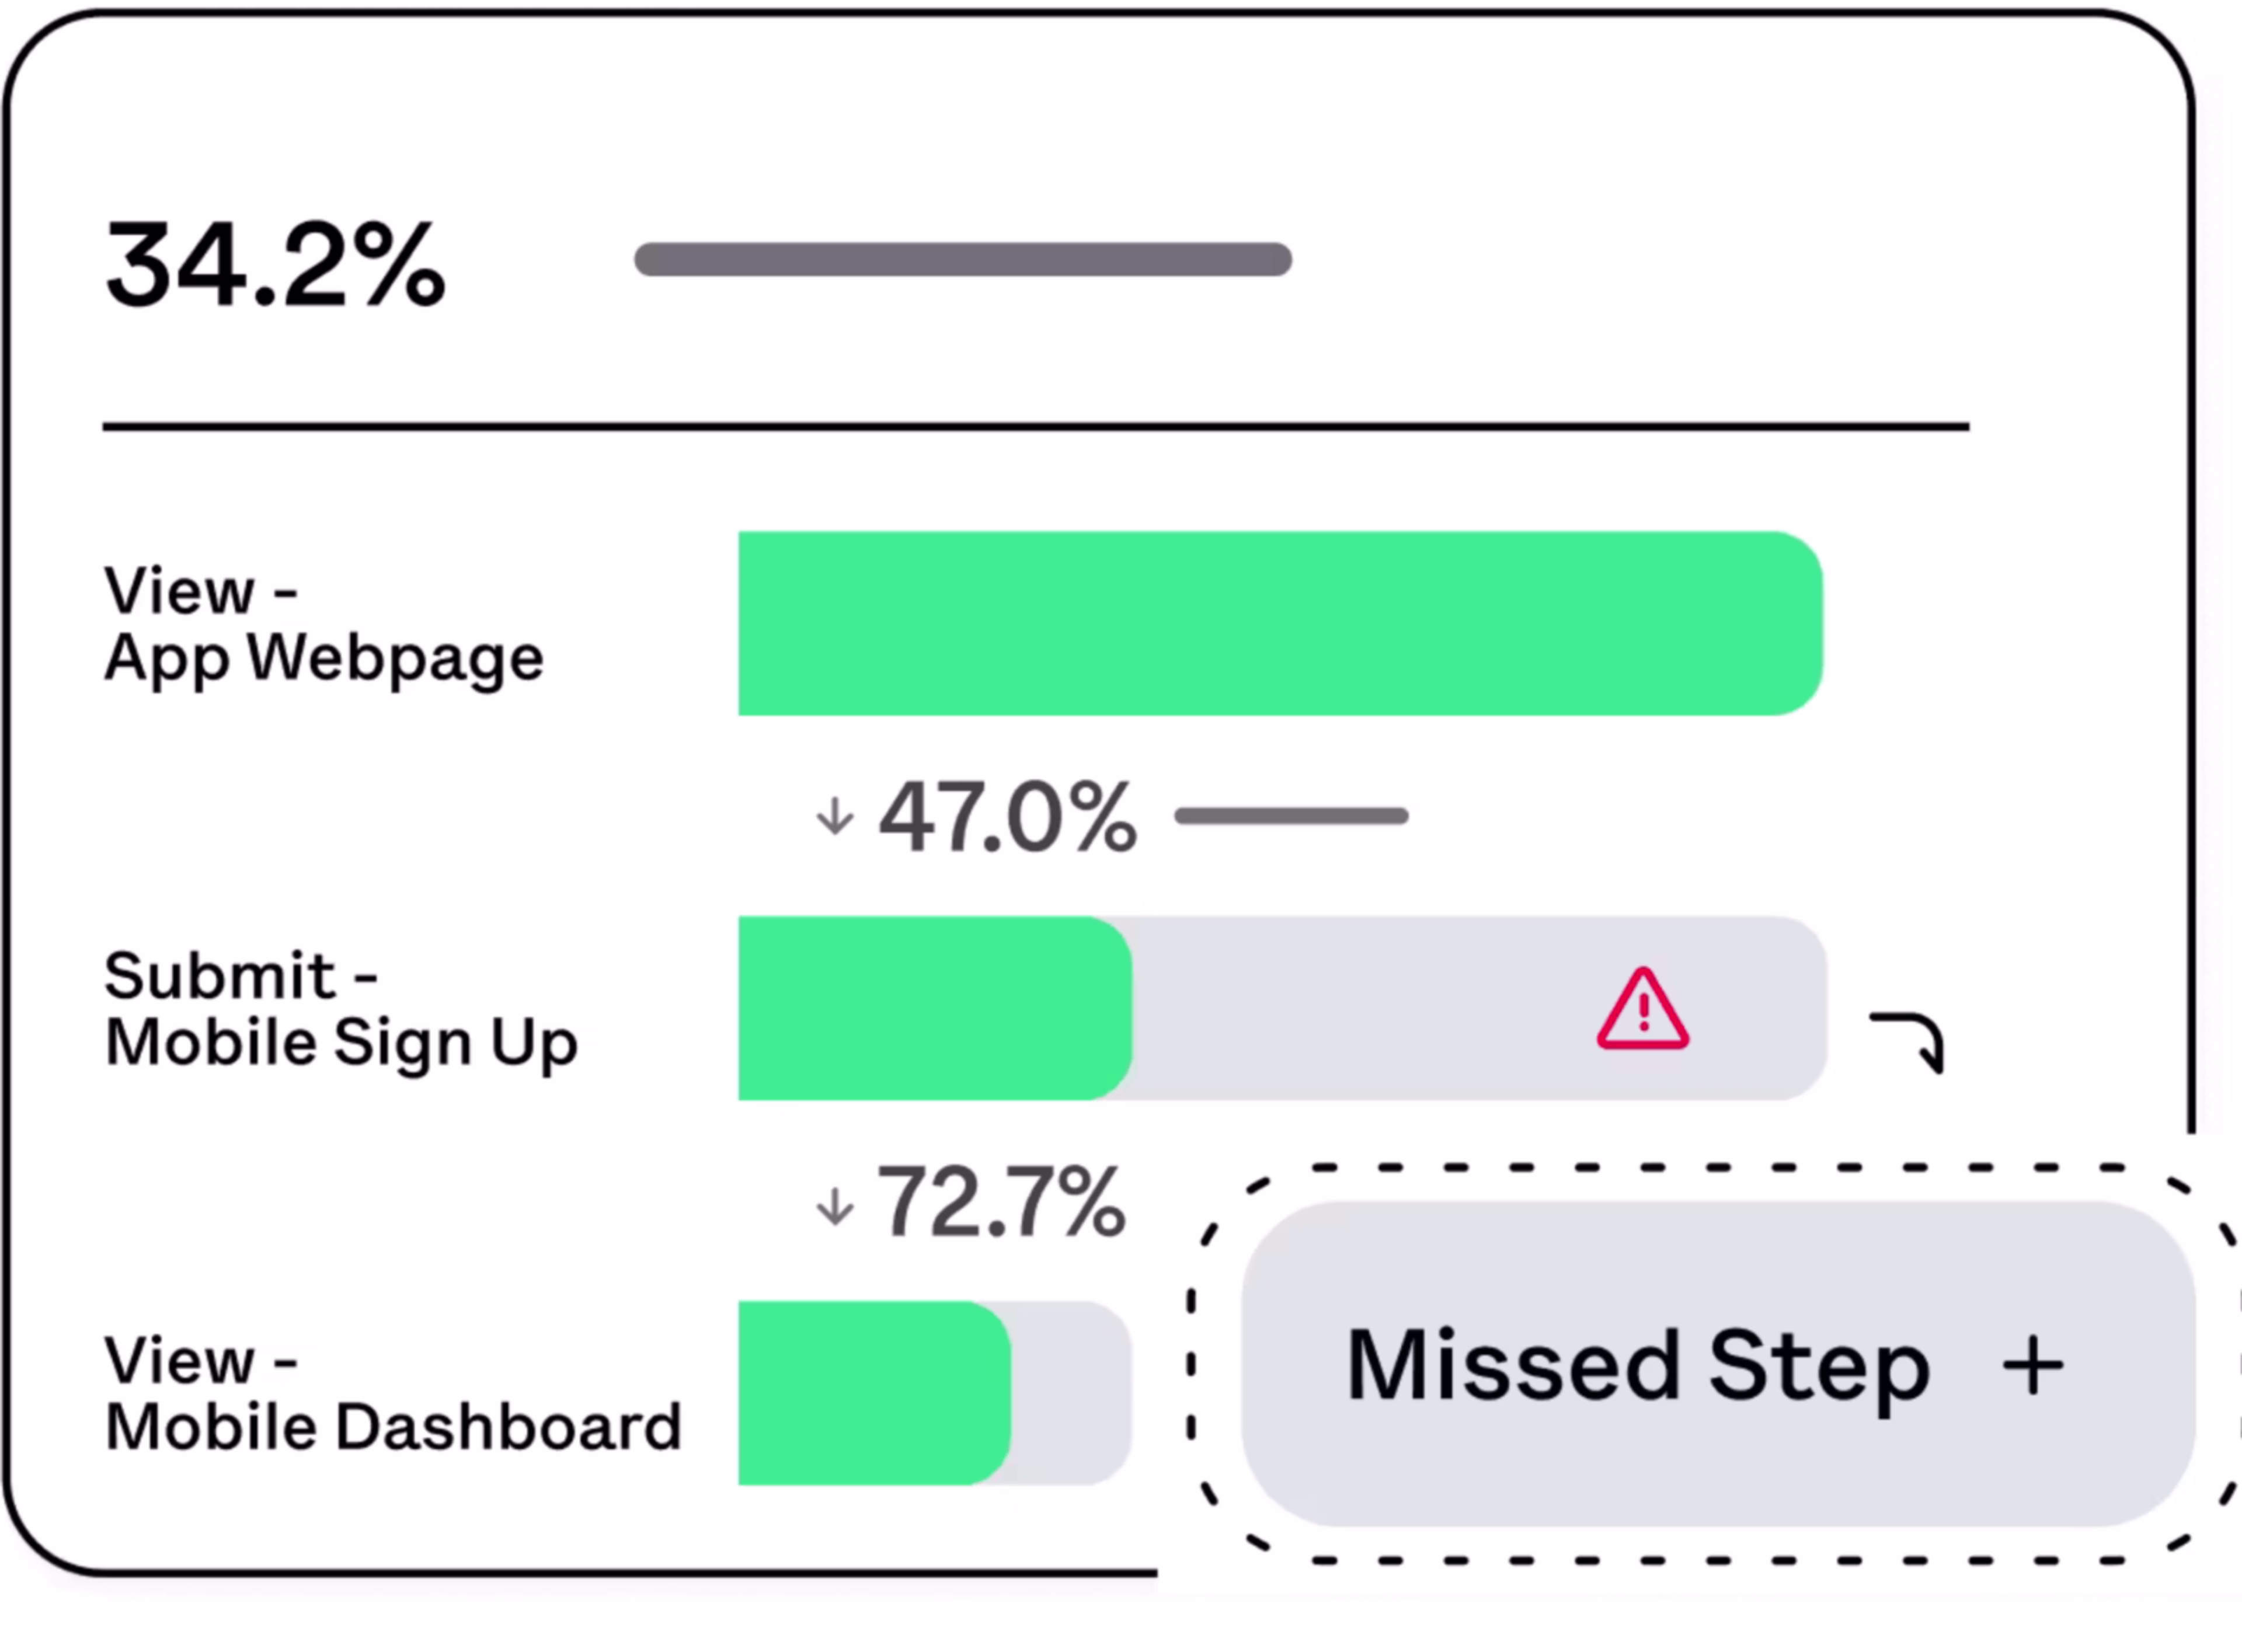
Funnel analysis in Contentsquare's Product Analytics
🤩See it for yourself: cookware retailer Sur La Table used to use Adobe Analytics, but it was far too inflexible and cumbersome to answer the team’s primary business questions, like
What’s driving purchase behavior?
How can we better engage our customers?
How can we improve our purchase funnel?
The team switched to Heap, part of the Contentsquare platform, and immediately gained visibility into every user interaction.
As a result, Sur La Table achieved significant wins, including a 12% increase in product page views and a 6% increase in overall conversion rate by optimizing their email newsletter strategy. They also improved cross-product merchandising, leading to a large lift in co-purchases and average order value.
This case study demonstrates why many companies are turning to Adobe alternatives like Contentsquare for more actionable insights.
How do we create better products, experiences, and A/B tests, besides fixing errors?
Creating exceptional digital experiences and products is crucial for business success today as customers have more choice than ever before. Both Adobe Analytics and Contentsquare offer powerful tools to help you achieve this goal, but they approach it in different ways.
Adobe Analytics has a technical focus on creating better experiences:
Use Activity Maps to overlay link clicks and related metrics onto your website, helping identify where any user segment is clicking the most
Run A/B tests in Adobe Target (another part of the Adobe Experience Cloud) to deliver personalized experiences at scale
Use Customer Journey Analytics (available as an add on) to visualize critical user journeys in your product
Contentsquare, however, provides a more comprehensive approach to product and experience optimization:
Zone-Based Heatmaps—visualize how users interact with specific elements on your site, helping identify areas for improvement
Customer journey analysis—understand the full user journey across multiple touchpoints and devices
AI-powered recommendations—receive automatic suggestions for experience improvements based on user behavior patterns and impact quantification
A/B test analysis—compare test variants side-by-side and understand exactly why certain versions perform better (note: you need to integrate with an A/B testing tool to do this)
![[Visual] ab test heatmaps](http://images.ctfassets.net/gwbpo1m641r7/71Feljv3nwR0ng3PEiPGEG/c5c4f991ef679e660e08970edb2a894a/ab_test_heatmaps.png?w=3840&q=100&fit=fill&fm=avif)
📈 Get the full picture: if you don’t want to miss out on the best of each platform, combine Adobe Analytics’ in-depth segmentation with Contentsquare’s all-in-one insights to
Visualize precise in-page metrics for Adobe Analytics segments
Combine Adobe insights with qualitative data like feedback and session replays
Import Adobe Target test variations and get visual insights into winning variants to improve future tests
For more on how this works, read about Contentsquare's Adobe Analytics integration.
![[Visual][product illustrations] segments](http://images.ctfassets.net/gwbpo1m641r7/7cCsfkeWIrOft8oOb1jqDv/ababc2c7810f40146b64144565cfed05/Segment.svg?w=1920&q=100&fit=fill)
Import and selecting a Adobe Segments to filter any report in Contentsquare
Perfect synergetic use case!
What Contentsquare adds beyond Adobe Analytics (and why it matters)
There are plenty of use cases where Contentsquare provides advantages and additional tools above and beyond Adobe Analytics. Here are some examples, based on the table of use cases that we saw earlier.
How do we create better products and drive user adoption and growth?
Both Contentsquare Product Analytics and Adobe are market leaders for web, app, and product analytics capabilities.
The biggest difference between Contentsquare Product Analytics and Adobe is the set-up, i.e. data capture. Contentsquare has refined its auto capture capabilities for websites and mobile apps with over 10 years of R&D investment. Today, it is the most widely used auto capture solution for web and app analytics in the industry. .
Contentsquare’s auto capture is market-proven to provide cost and time savings for gathering a more complete picture of in-page interactions so that teams can answer everyday questions at lower cost and effort:
No need to plan what click events to track in advance—Contentsquare automatically captures all in-page clicks, taps, field interactions, etc..
No need to loop engineering in every time there’s a change—unburden engineering to focus on their own scope
Flexibility to ask new questions of historical data— retroactive data means anyone can go back and troubleshoot or analyze any data point at any time
Reduced risk of missing critical data needed for answering questions —never worry about forgetting to track a specific event. A more complete data set means better and faster answers to questions.
Lower total cost of ownership – Save on the tremendous amount of effort and cost that is spent on traditional analytics for manual tagging.
Lower fees – Save on the extra fees that some analytics tools that are priced on the number of captured events charge when you increase the number of events you tag.
This approach saves time, money, reduces technical debt, and ensures you always have the data you need to make informed decisions. And it works right out of the box.
![[Visual] Manual tracking vs. autocapture](http://images.ctfassets.net/gwbpo1m641r7/1upLvWnDjOib3mspiWbMAP/f92482cc550184dfe41747b6a0ad3e6e/unnamed-2024-10-18T104718.598.png?w=3840&q=100&fit=fill&fm=avif)
Manual tracking vs. autocapture
Customers have documented publicly how auto capture benefits them in terms of time and cost savings, compared to using web analytics products that require manual tagging. For example, be sure to read Trading the Quill for the Press: The Case for Automated Tagging – By Seth Stuck, Published by Fox tech on Medium
Why does it matter? Better answers to questions, delivered more quickly, means that Product teams can be more agile with prioritizing, triaging, and course correcting roadmap releases. This enables them to release more often, and put out better releases. That leads to more successful products that have a better chance at creating successful, loyal users and reaching their Northstar KPI targets.
How do we empower and align all teams to create better experiences, not just technical teams?
Adobe Analytics is difficult to set up and has a steep learning curve—just read some recent reviews of the platform and you’ll see what we mean.
![[Screenshots] Adobe Analytics reviews](http://images.ctfassets.net/gwbpo1m641r7/2PnGpDOxYkUgdatBj9x9o0/01b381c167245d52b3a1d26e415dfa42/Adobe_Analytics_reviews.png?w=3840&q=100&fit=fill&fm=avif)
Reviews prove Adobe Analytics has a steep learning curve
One major benefit of Contentsquare over Adobe Analytics is that it’s designed to be easy-to-use out-of-the-box for all teams:
Data autocapture: Contentsquare automatically captures user interactions on your sites and apps.
Visual tools: Only Contentsquare combines charts with advanced visual analytics to make it simple for teams to visualize the link between behavior and performance and share impactful insights with even the most data-averse stakeholders.
Insight generation in plain language: While Adobe Analytics uses plenty of machine learning and AI—called Adobe Sensei—it’s designed to spot statistically significant anomalies in your data and run ‘contribution analysis’ to show you which events led to it. This is a powerful feature, but it doesn’t help teams with their day-to-day analytics tasks. In contrast, Contentsquare's Sense AI allows you to ask questions about your data in natural language, generate custom reports and visualizations without technical knowledge, receive AI-powered recommendations for experience improvements
This democratizes data analysis across your organization, enabling every team member to derive actionable insights quickly and easily.

Ask your analytics anything with Contentsquare AI
How do we surface obstacles on our sites and apps and prioritize what to fix based on revenue impact?
Frustration impacts 2 in 5 retail sessions—that’s a lot of business lost to bugs and poor UX. Both Adobe Analytics and Contentsquare help you find areas of frustration on your sites and prioritize fixes.
Contentsquare has robust Digital Experience Monitoring (DEM) tools to help you find, prioritize, and share issues quickly. You get
Error Analysis—surface and rank technical issues on your sites and apps
Speed Analysis—measure the impact of performance on business metrics
Session Replay—watch where users get stuck and get context and buy-in for fixes
Frustration Score—automatically find and prioritize what to redesign based on business impact
Impact Quantification—prioritize any issue by quantifying its effect on metrics like clicks, conversions, and revenue
Smart alerts—AI and manual alerts to spot issues before they affect performance
You can track errors in Adobe Analytics, but doing so is more of a work-around than a main use case:
You must implement custom variables to track different errors
You can set up anomaly detection alerts to be notified when page error rate goes above expected levels
You can use the friction view in Customer Journey Analytics (available as an add on to Adobe Analytics) to see what’s causing users to drop off your funnels
The problem is, you won’t easily be able to troubleshoot or recreate any errors you find in—Adobe Analytics doesn’t have session replays or out-of-the-box error dashboards.
While both Contentsquare and Adobe can surface anomalies and send tailored alerts, without Contentsquare’s qualitative tools, you’ll be left guessing why anomalies occur in Adobe.
Using Contentsquare you can
Replay sessions – so you can step into the shoes of users and see exactly what they experienced when they browsed your sites and used your apps.
Combine Error Monitoring + Session Replays for websites and mobile apps —automatically detect errors, then view relevant session replays to see exactly what users experienced before, during, and after the error occurred, e.g. JS errors, API errors, app crashes, console logged errors, and custom defined errors such as form validations.
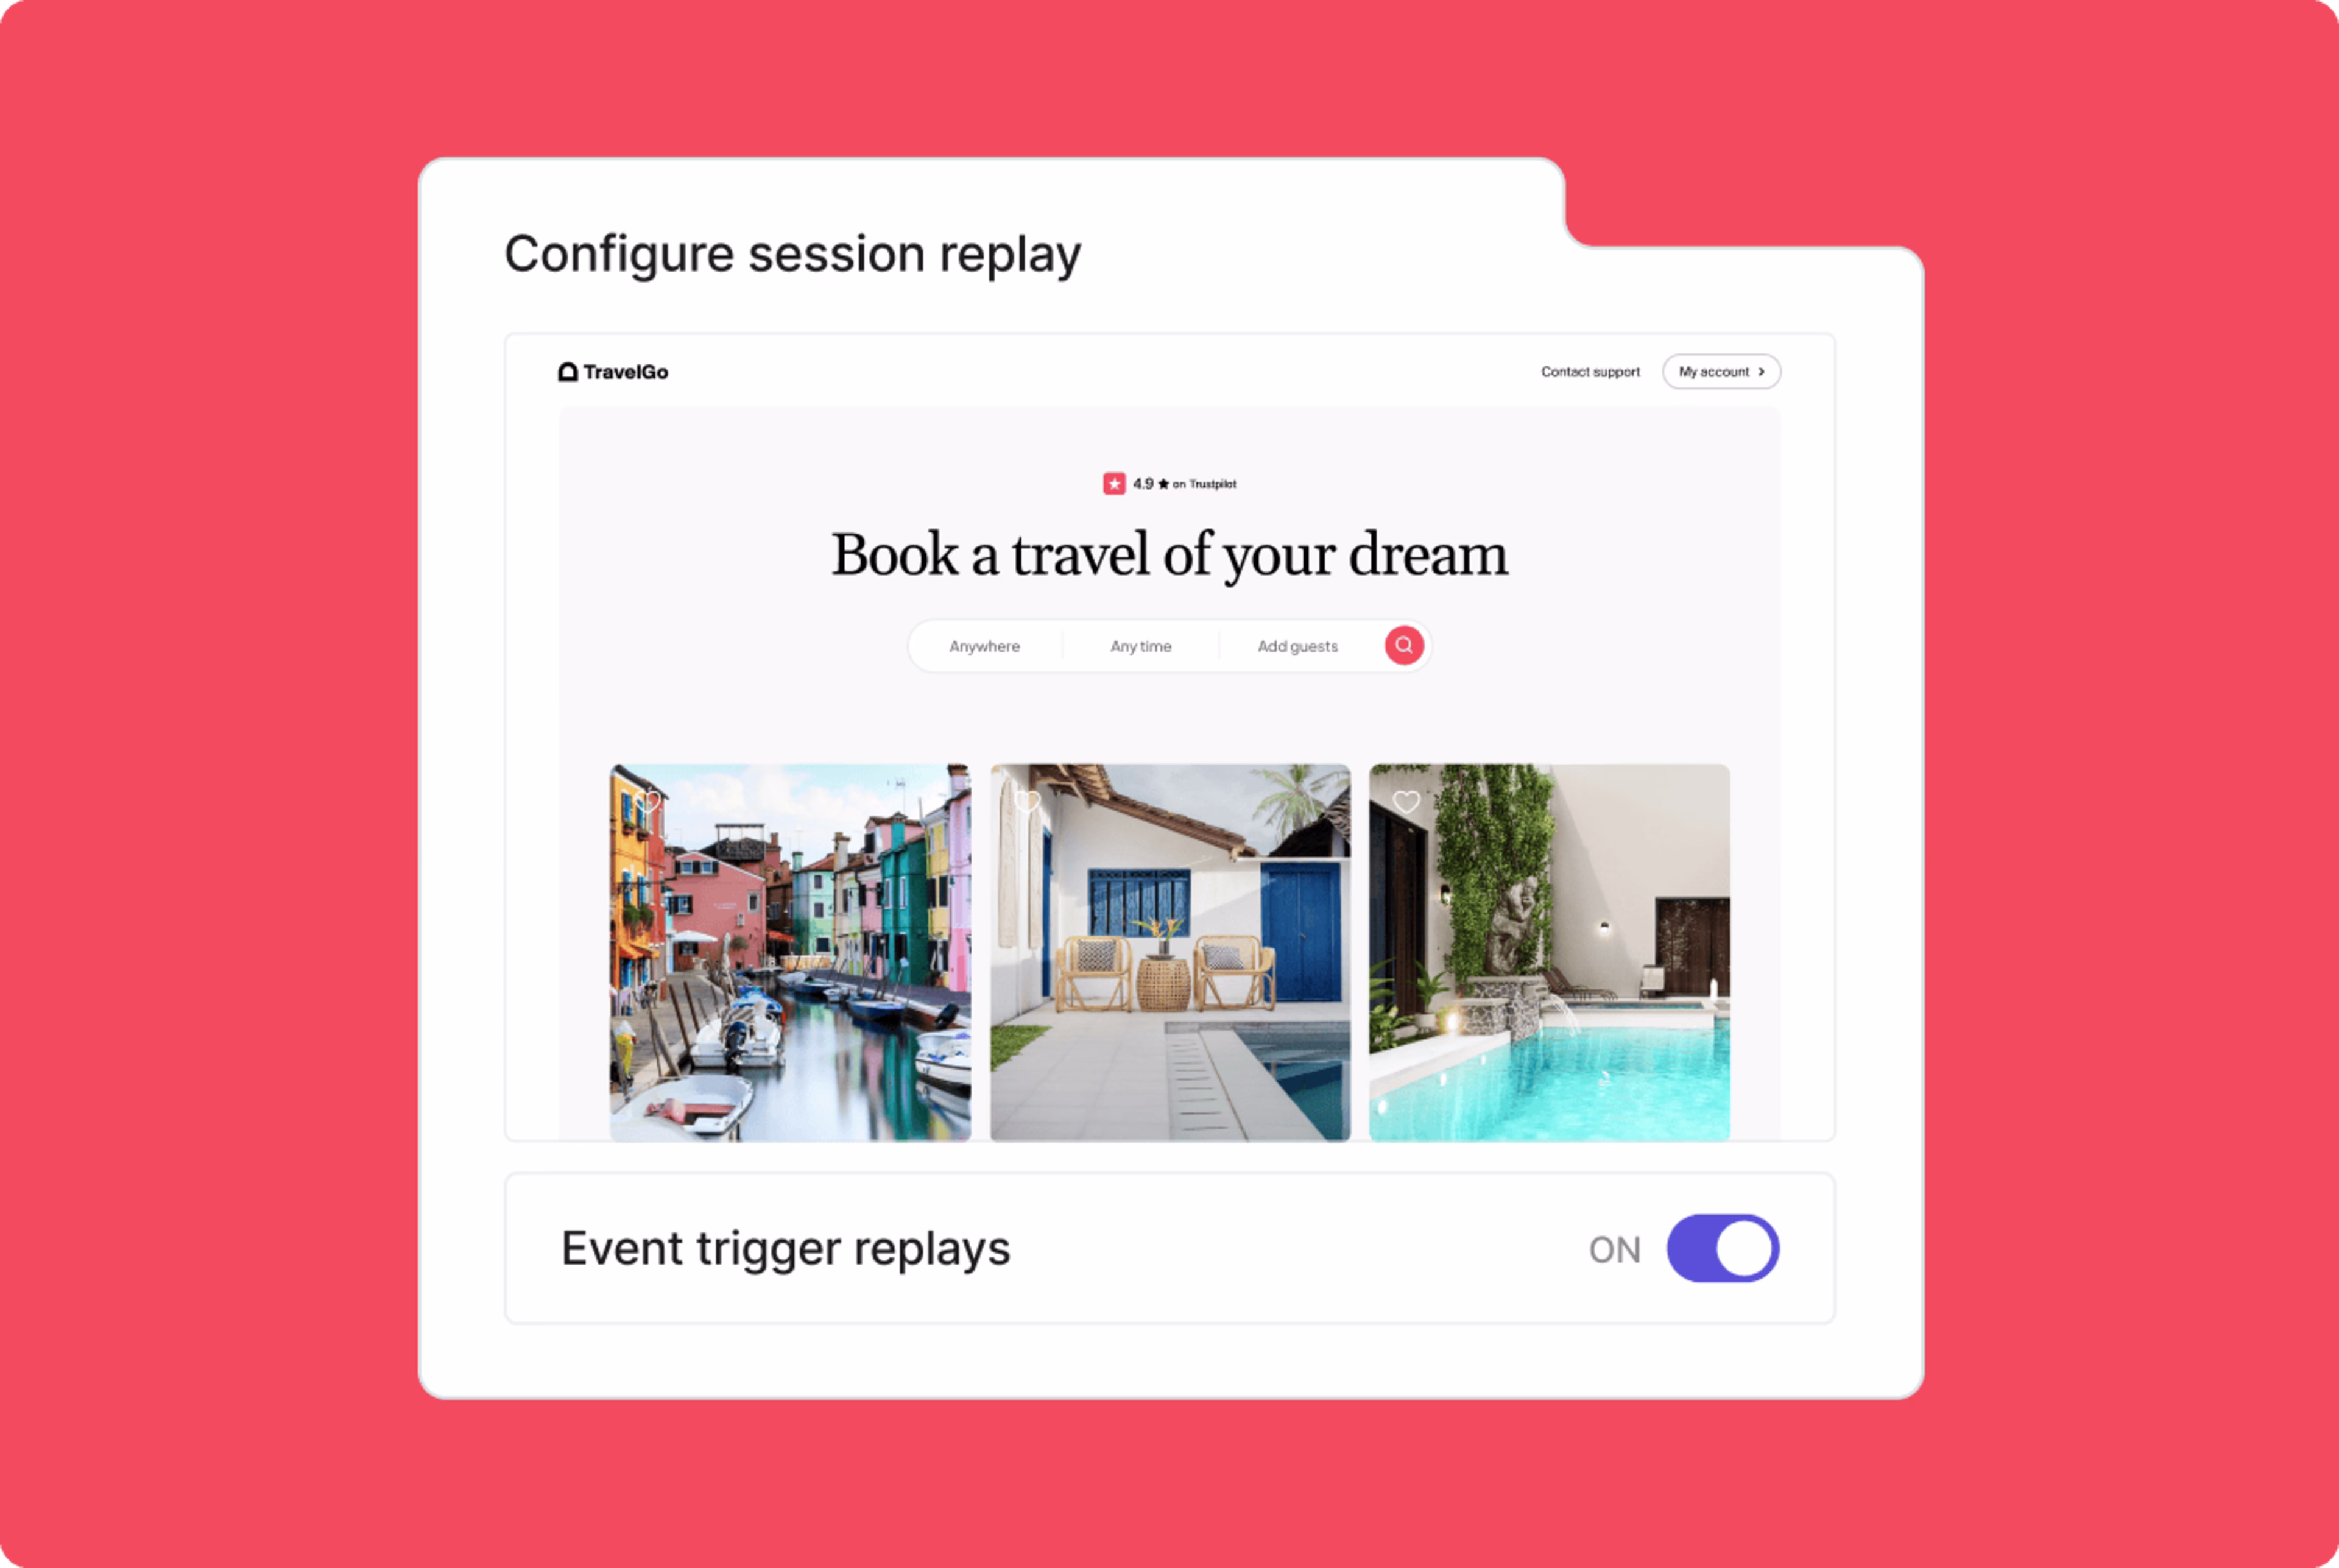
Example of session replay with error capture and impact quantification in Contentsquare
Save time with Frustration Scoring + Session Replays – by ranking which sessions to replay that are most likely to be insightful
Enable Advanced Support teams to resolve escalated issues by replaying the exact sessions related to customer service tickets, understanding root causes of issues down to errors, granular network details, request/response headers, and bodies.
Ensure security by enabling only authorized personnel to decrypt customer data needed for handling the customer’s service tickets
Enable engineers to see the full waterfall of network details behind every replay so they can understand what leads up to bugs and fix them quickly/
Get customizable real-time error alerts and dashboards that rally your team around critical issues
Make it easy to file tickets via Jira or rally teams to action via Slack and Microsoft Teams.
Save time focusing in high-impact optimizations with Contentsquare’s AI-powered insights such as Frustration Score
Perhaps the two most popular capabilities in Contentsquare for technical teams tasked with ensuring friction-free experiences are text search and 1-click impact quantification.
Retroactive text search in Contentsquare enables teams to
Surface and quantify all occurrences where site users encountered unexpected error messages of any kind, e.g. “Oops, something went wrong.”
Visualize how users experience these messages,
To learn things that technical teams didn’t already know from their APM tools such as Dynatrace, Datadog, etc.,
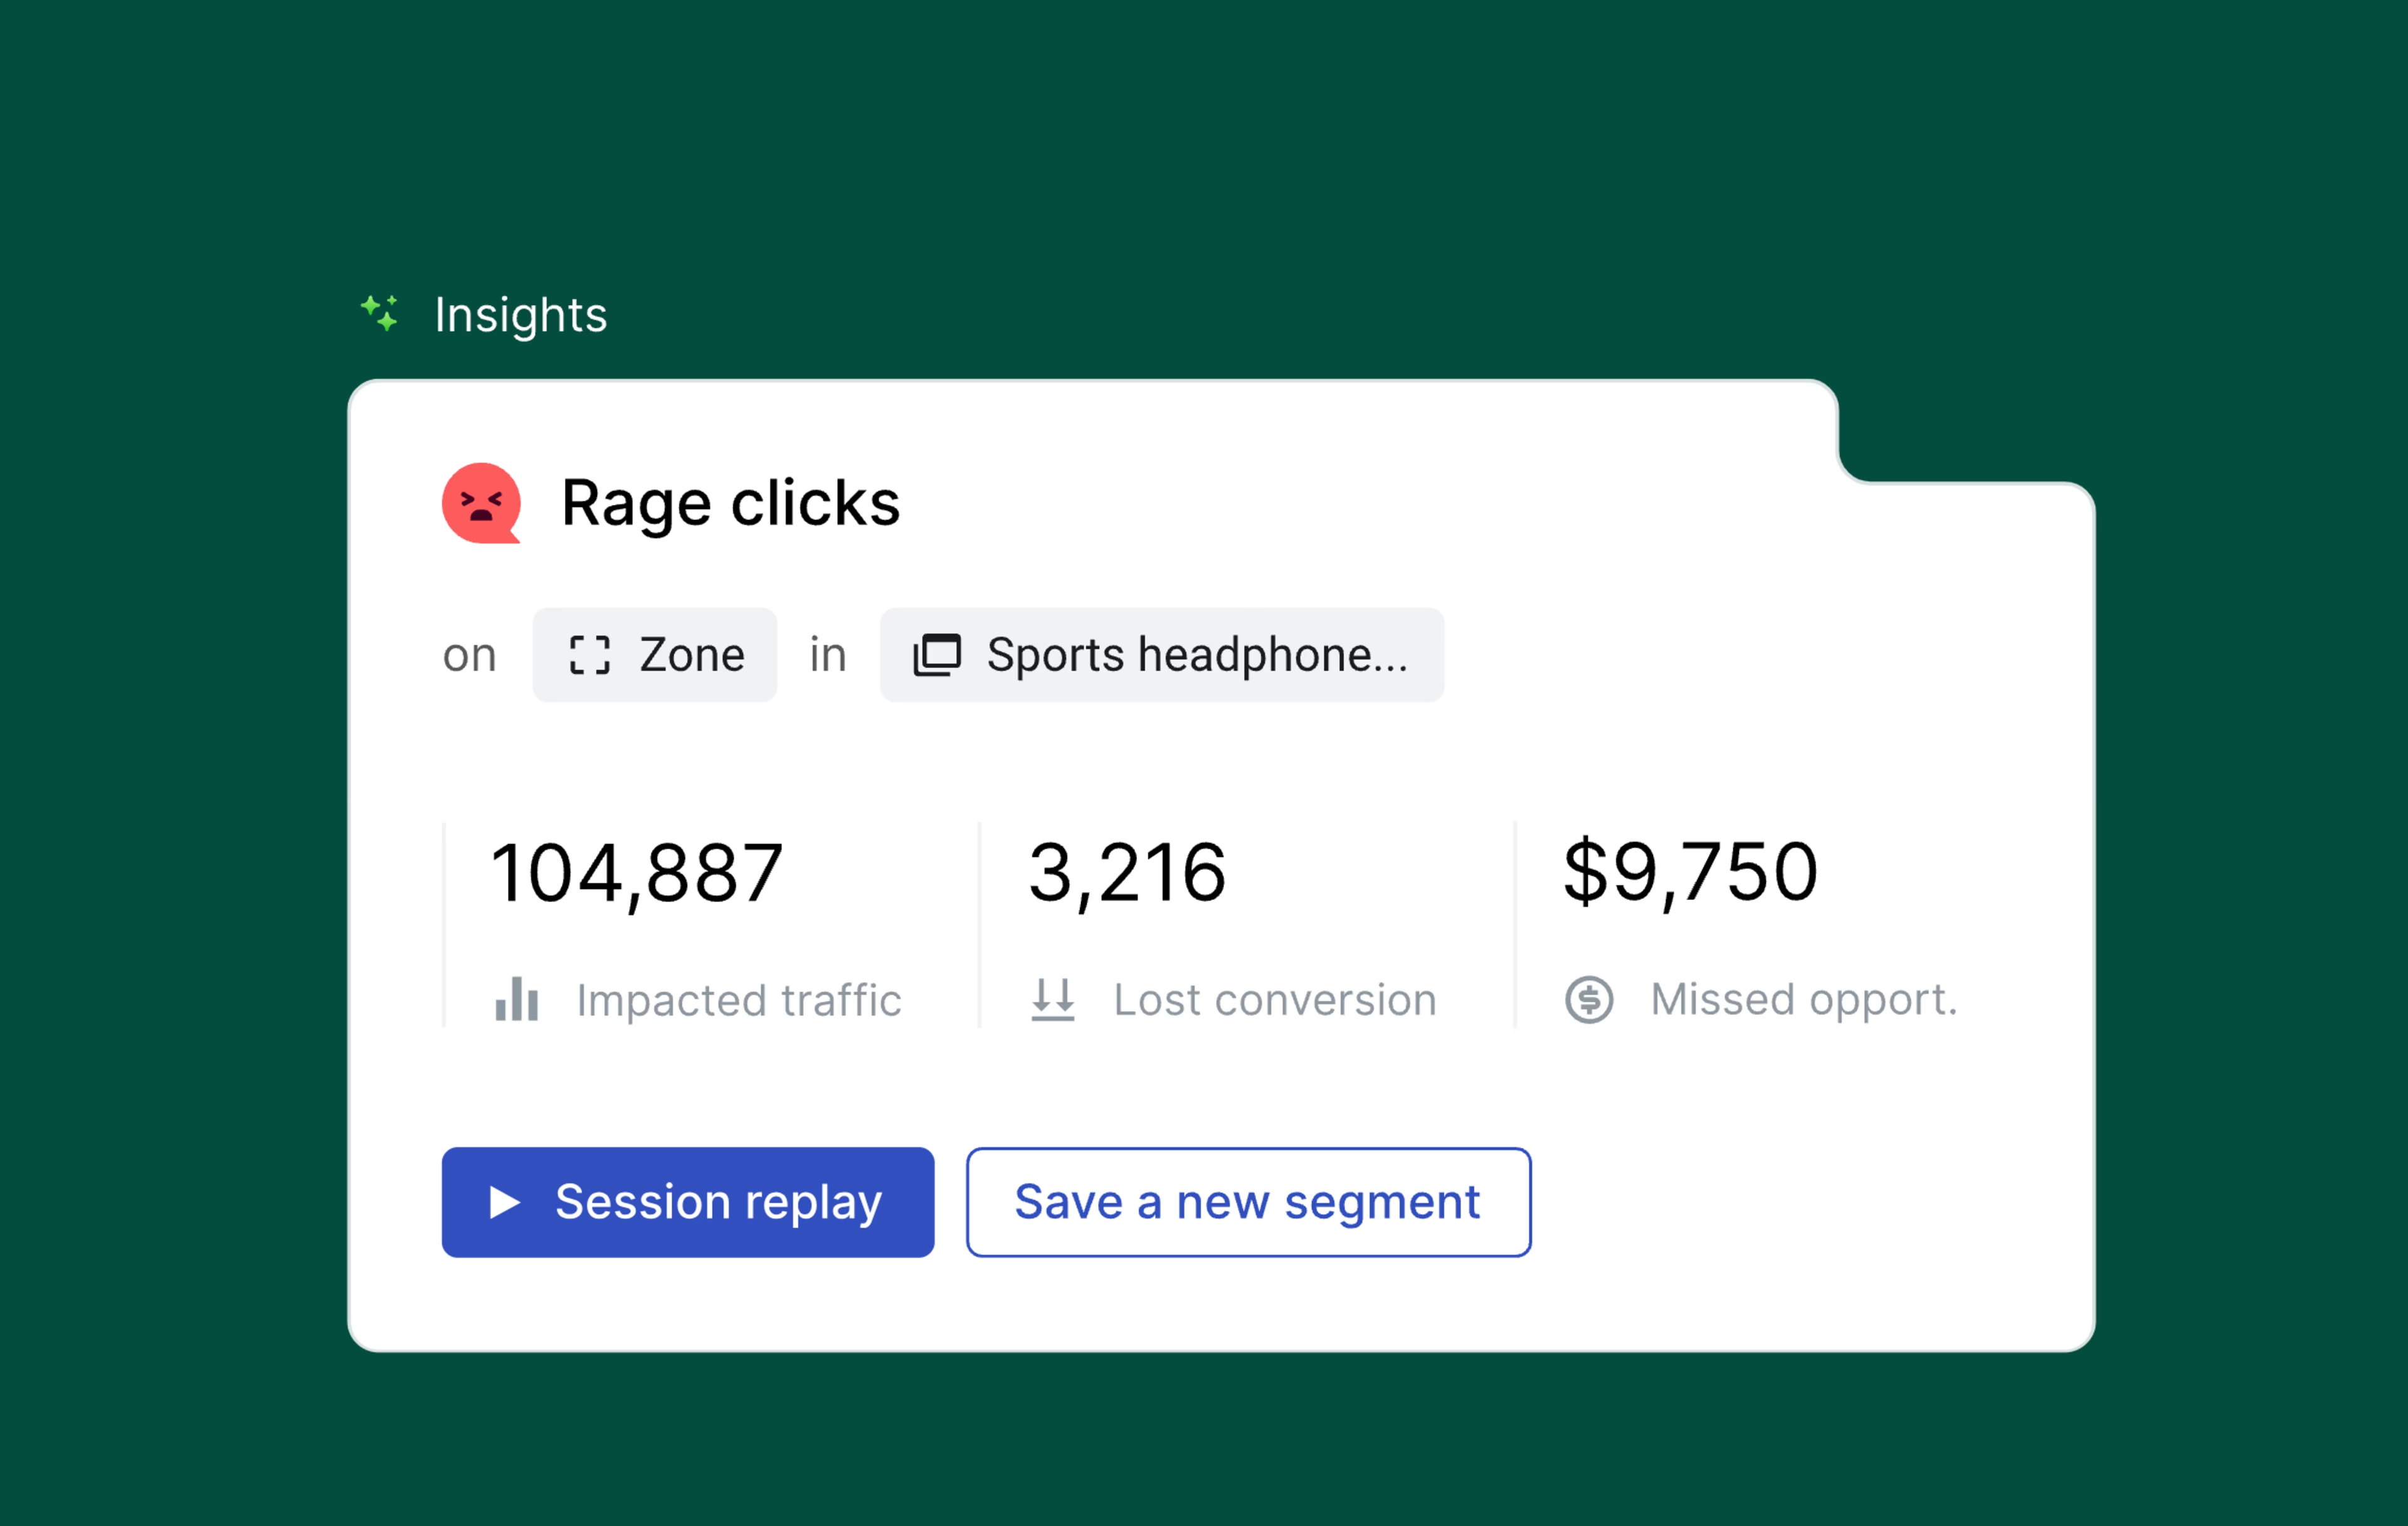
1-click impact quantification of behaviors and errors directly from session replay
Spot any issue or error? Simply select the issue or behaviors leading up to it and quantify with one click to see how many others experience the same problems
Contentsquare automatically compares the segment of customers that experience the issue vs. those that don’t experience it at that point to calculate the true impact of the problem
This is what enables teams to go from one to many and prioritize the issues that will actually move the needle for the business and for customers.
How do we create happier customers by collecting feedback and listening better?
A big problem with relying on Adobe Analytics is that it's never going to reveal why customers engage with your content, exit your site, or recommend you to a friend.
That's why you need a comprehensive Voice-of-Customer (VoC) solution. Contentsquare has integrated VoC tools that allow you to:
Voice of Customer (VoC) gives you direct access to what’s going on in the minds of your most important business asset—your customers.
VoC tools empower teams across the organization to make data-driven decisions:
Marketers can refine campaigns based on customer sentiment
Product teams can prioritize features that resonate with users
Customer support can address common pain points
Executives can gauge overall satisfaction and loyalty
Adobe doesn’t today provide a native VoC tool—you’ll need to integrate with other paid tools like Survicate or Sprig to collect feedback responses and connect them to your quantitative data.
With Contentsquare, you have the option to integrate or use built-in VoC tools, including
Surveys—launch and analyze AI-powered surveys in seconds.
User Tests—understand how customers use your product in real life or in your prototypes.
Interviews—get a deeper understanding of user needs in live conversations, in one integrated platform.
![[visual] Run user interviews and unmoderated tests in Contentsquare](http://images.ctfassets.net/gwbpo1m641r7/5TRZhRs0R1KqnCDMf26i0K/e2c6844688c50347fc8435bdf1d2e91f/User-testing-in-Medallia-vs-Contentsquare.jpg?w=3840&q=100&fit=fill&fm=avif)
Is Contentsquare or Adobe better for your team?
What’s your primary reason for using a platform like Contentsquare, Adobe or alternatives?
If it’s creating executive level dashboards for pageviews and journeys at a high level, you can achieve your goals with either platform. But Contentsquare Product Analytics has proven itself over 10 years to be providing huge cost and time savings thanks to its autocapture architecture. Over a thousand companies use it to answer everyday questions that are just too hard and too costly to answer with traditional analytics that require manual tagging.
If it’s whole-business growth, Contentsquare is the only all-in-one platform that combines product and comprehensive experience analytics, monitoring, and Voice of Customer capabilities to tackle growth from all angles. These are indispensable, whether they are used as a companion to Adobe or with Contentsquare Product Analytics
The only way to really know which solution best aligns with your team’s needs is to experience it for yourself—take the 6-minute Contentsquare product tour and see how Contentsquare can outperform Adobe for your team.
FAQs about Contentsquare vs. Adobe Analytics
Adobe Analytics, part of Adobe Experience Cloud, is a web analytics tool that helps businesses track user interactions and optimize digital experiences. Founded when Adobe acquired Omniture in 2009, it offers real-time insights and detailed customer segmentation. While powerful, it can be complex to implement and may require specialized expertise to fully utilize.
Net Promoter®, NPS®, NPS Prism®, and the NPS-related emoticons are registered trademarks of Bain & Company, Inc., NICE Systems, Inc., and Fred Reichheld. Net Promoter ScoreSM and Net Promoter SystemSM are service marks of Bain & Company, Inc., NICE Systems, Inc., and Fred Reichheld.
![[Visual] Contentsquare's Content Team](http://images.ctfassets.net/gwbpo1m641r7/3IVEUbRzFIoC9mf5EJ2qHY/f25ccd2131dfd63f5c63b5b92cc4ba20/Copy_of_Copy_of_BLOG-icp-8117438.jpeg?w=1920&q=100&fit=fill&fm=avif)
We’re an international team of content experts and writers with a passion for all things customer experience (CX). From best practices to the hottest trends in digital, we’ve got it covered. Explore our guides to learn everything you need to know to create experiences that your customers will love. Happy reading!