![[Visual] platform-overview-dashboard](http://images.ctfassets.net/gwbpo1m641r7/2LTkt1YATVIWCvRyN5bS1I/c7a6221f286ae35996f05df19f74781c/platform-overview-dashboard.svg?w=3840&q=100&fit=fill)
The information on this page is correct as at 22/05/2025 to the best of Contentsquare's understanding. You’re not comparing analytics tools—you’re looking for answers.
What’s working? What’s not? What’s slowing things down or holding your team back?
You want to move fast, fix the right things, and show your impact. The real question is: which platform actually helps you do that?
This guide breaks down the top alternatives to Contentsquare—including GA4, Microsoft Clarity, Quantum Metric, and Mixpanel—and shows how they stack up on the things that matter: usability, intelligence, and business impact.
You’ll see what each platform does well, where they fall short, and why +3,700 enterprise brands and +1.3 million websites and apps choose Contentsquare to turn insights into digital behavior into business growth.
Contentsquare alternatives, at a glance
Evaluating tools is not about checking features off a list. It’s about finding the one that gets your team to insight—and action—fast.
Use this table to quickly compare the top platforms—what they focus on, who they’re built for, and what might be missing. Click through for a deeper dive into how each one compares to Contentsquare.
A quick note about Hotjar and Heap: we acquired Hotjar in 2021 and Heap in 2023. Both are still available as standalone tools, which is why they’re included in the table below—but their core capabilities are also now part of the Contentsquare platform, including our free plan.
Platform | Strengths | Tradeoffs |
Advanced marketing attribution, CDP integration, and customizable dashboards. Best for analyst-heavy teams using Adobe Experience Cloud | Requires manual tagging. No built-in session replay, visual heatmaps, or revenue impact analysis. Contentsquare complements Adobe with more accessible, real-time experience insights | |
Powerful for product teams focused on retention, funnels, and experimentation. Includes native A/B testing and CDP features | Lacks journey analysis, visual tools, and built-in revenue prioritization. Doesn’t connect product behavior to UX friction or conversion drop-offs like Contentsquare does | |
Free session replay and basic heatmaps
| Limited scalability, privacy controls, and business impact analysis. No journey mapping, Voice of Customer, or support. Data co-owned by Microsoft | |
Leading APM tool for DevOps and engineering teams. Strong backend monitoring and real user performance tracking | No behavioral or visual UX analytics. Can’t tie technical issues to revenue. Best used with Contentsquare for a complete experience picture | |
Great for infrastructure diagnostics and performance alerts. Dev-focused APM with strong root cause analysis | No revenue impact analysis or visual behavior tools. Not usable by product, marketing, or UX teams without Contentsquare integration | |
Fast session replay access and basic friction detection | Lacks visual journey mapping, zoning, and revenue impact tools. Sampling limits insights. Not built for cross-functional optimization across UX, marketing, or ecommerce | |
Free, customizable tracking for advertising and attribution | Requires tagging. No session replay, no heatmaps, no journey mapping. Doesn’t explain why users behave the way they do or prioritize based on revenue impact | |
Popular with technical teams for mobile analytics, session replay, and error tracking | Limited journey mapping, visual tools, and cross-functional usability. Experience optimization lacks automation and business alignment | |
Freemium tool with heatmaps, session replay, and basic surveys—and all now part of Contentsquare’s free forever plan | No journey analysis, frustration detection, or revenue impact features—remove these limitations by using Contentsquare Experience Analytics instead | |
Leading product analytics platform with autocapture and retroactive event analysis | Lacks advanced visualizations like heatmaps or journey mapping. Doesn’t connect behavior to business impact—remove these limitations by using Contentsquare Product Analytics instead | |
Open-source and privacy-first. Offers flexible hosting and strong GDPR compliance
| Limited behavioral insights, no visual tools like journey mapping or impact quantification. Hard to understand why users behave the way they do unless you pair it with Contentsquare | |
Enterprise-grade Voice of Customer platform with strong survey, call center, and offline feedback tools | Limited visual behavior analytics and impact quantification. Slow time to value waiting for feedback before taking action | |
Strong product analytics for teams focused on event tracking, funnels, and retention | Manual tagging limits scalability. No native visual analytics, frustration scoring, or business impact analysis. Not suited for marketers or CX teams | |
Simple heatmaps, session replay, and friction scoring | No business impact quantification, advanced segmentation, or cross-session journey analysis. Lacks AI-driven prioritization and integration depth needed for scaling | |
In-app guidance, onboarding flows, and feature adoption tracking. Includes native Voice of Customer tools like surveys and NPS® | Lacks journey mapping, detailed heatmaps, and impact quantification. Limited data governance. Not ideal for cross-functional insights or revenue-backed prioritization | |
Leader in structured feedback collection across digital and offline touchpoints. Strong in survey design and sentiment analysis | Relies on self-reported feedback. No behavior-based journey analysis or element-level revenue impact. Limited visibility into actual user behavior | |
Offers technical analytics, basic session replay, and real-time error tracking for technical teams | No revenue quantification or advanced visualizations. Not designed for marketers or UX teams. Better for reactive issue resolution than proactive experience optimization |
Why Contentsquare wins
You’ve seen what the other tools can do—but what about what they can’t do?
GA4 and Mixpanel tell you what happened. Fullstory and Clarity let you watch it back. But only Contentsquare shows you what to do next, why it matters, and what it’s really worth.
While others give you charts, dashboards, or raw session replays, Contentsquare delivers
Visual insights for every team (not just analysts)
Smarter answers from day one, with zero tagging
Revenue-backed prioritization that helps you fix what matters most
It’s not about more data. It’s about actionable answers your team can use right now.
Here’s how Contentsquare helps you move faster, fix the right things, and grow with confidence.
1. A single platform for every team
Contentsquare is more than analytics. It’s an all-in-one platform that gives every team the tools they need to understand user behavior, spot issues, and improve the experience. No tagging. No dashboards to decode. Just answers—visually, intuitively, and instantly.
Whether you’re in product, marketing, UX, ecommerce, support, or the C-suite, Contentsquare makes insight easy to access and act on.
Product teams use Product Analytics to track feature adoption, onboarding, and retention (no tagging required)
![[Visual] Product Analytics - what is CSQ](http://images.ctfassets.net/gwbpo1m641r7/2lKqeqxLEjPIs84XY7rkYb/aa6b6d500efab80700a6880e48bccc9e/Product_Analytics_.png?w=3840&q=100&fit=fill&fm=avif)
Tracking feature retention in Contentsquare Product Analytics
Marketing teams rely on Heatmaps and Journey Analysis to see which campaigns convert, where users bounce, and what content actually drives revenue
UX and design teams use Session Replay and Frustration Score to quickly identify struggle points—like rage clicks or hesitation—and watch the exact moments that need fixing
CX and research teams use Voice of Customer tools to collect in-the-moment feedback, run usability tests, and analyze sentiment—then connect it directly to behavioral data to uncover what users say and do
![[Visual] nps-survey-results-Contentsquare](http://images.ctfassets.net/gwbpo1m641r7/695PUA91x9RjSrFEJnn8s4/412d0c29784aa3aaf64fd05c3a548d25/nps-survey-results-Contentsquare.png?w=3840&q=100&fit=fill&fm=avif)
Tracking NPSⓇ survey results in Contentsquare
Customer support teams resolve issues faster with Error Analysis and linked replays, seeing exactly what went wrong in the customer journey
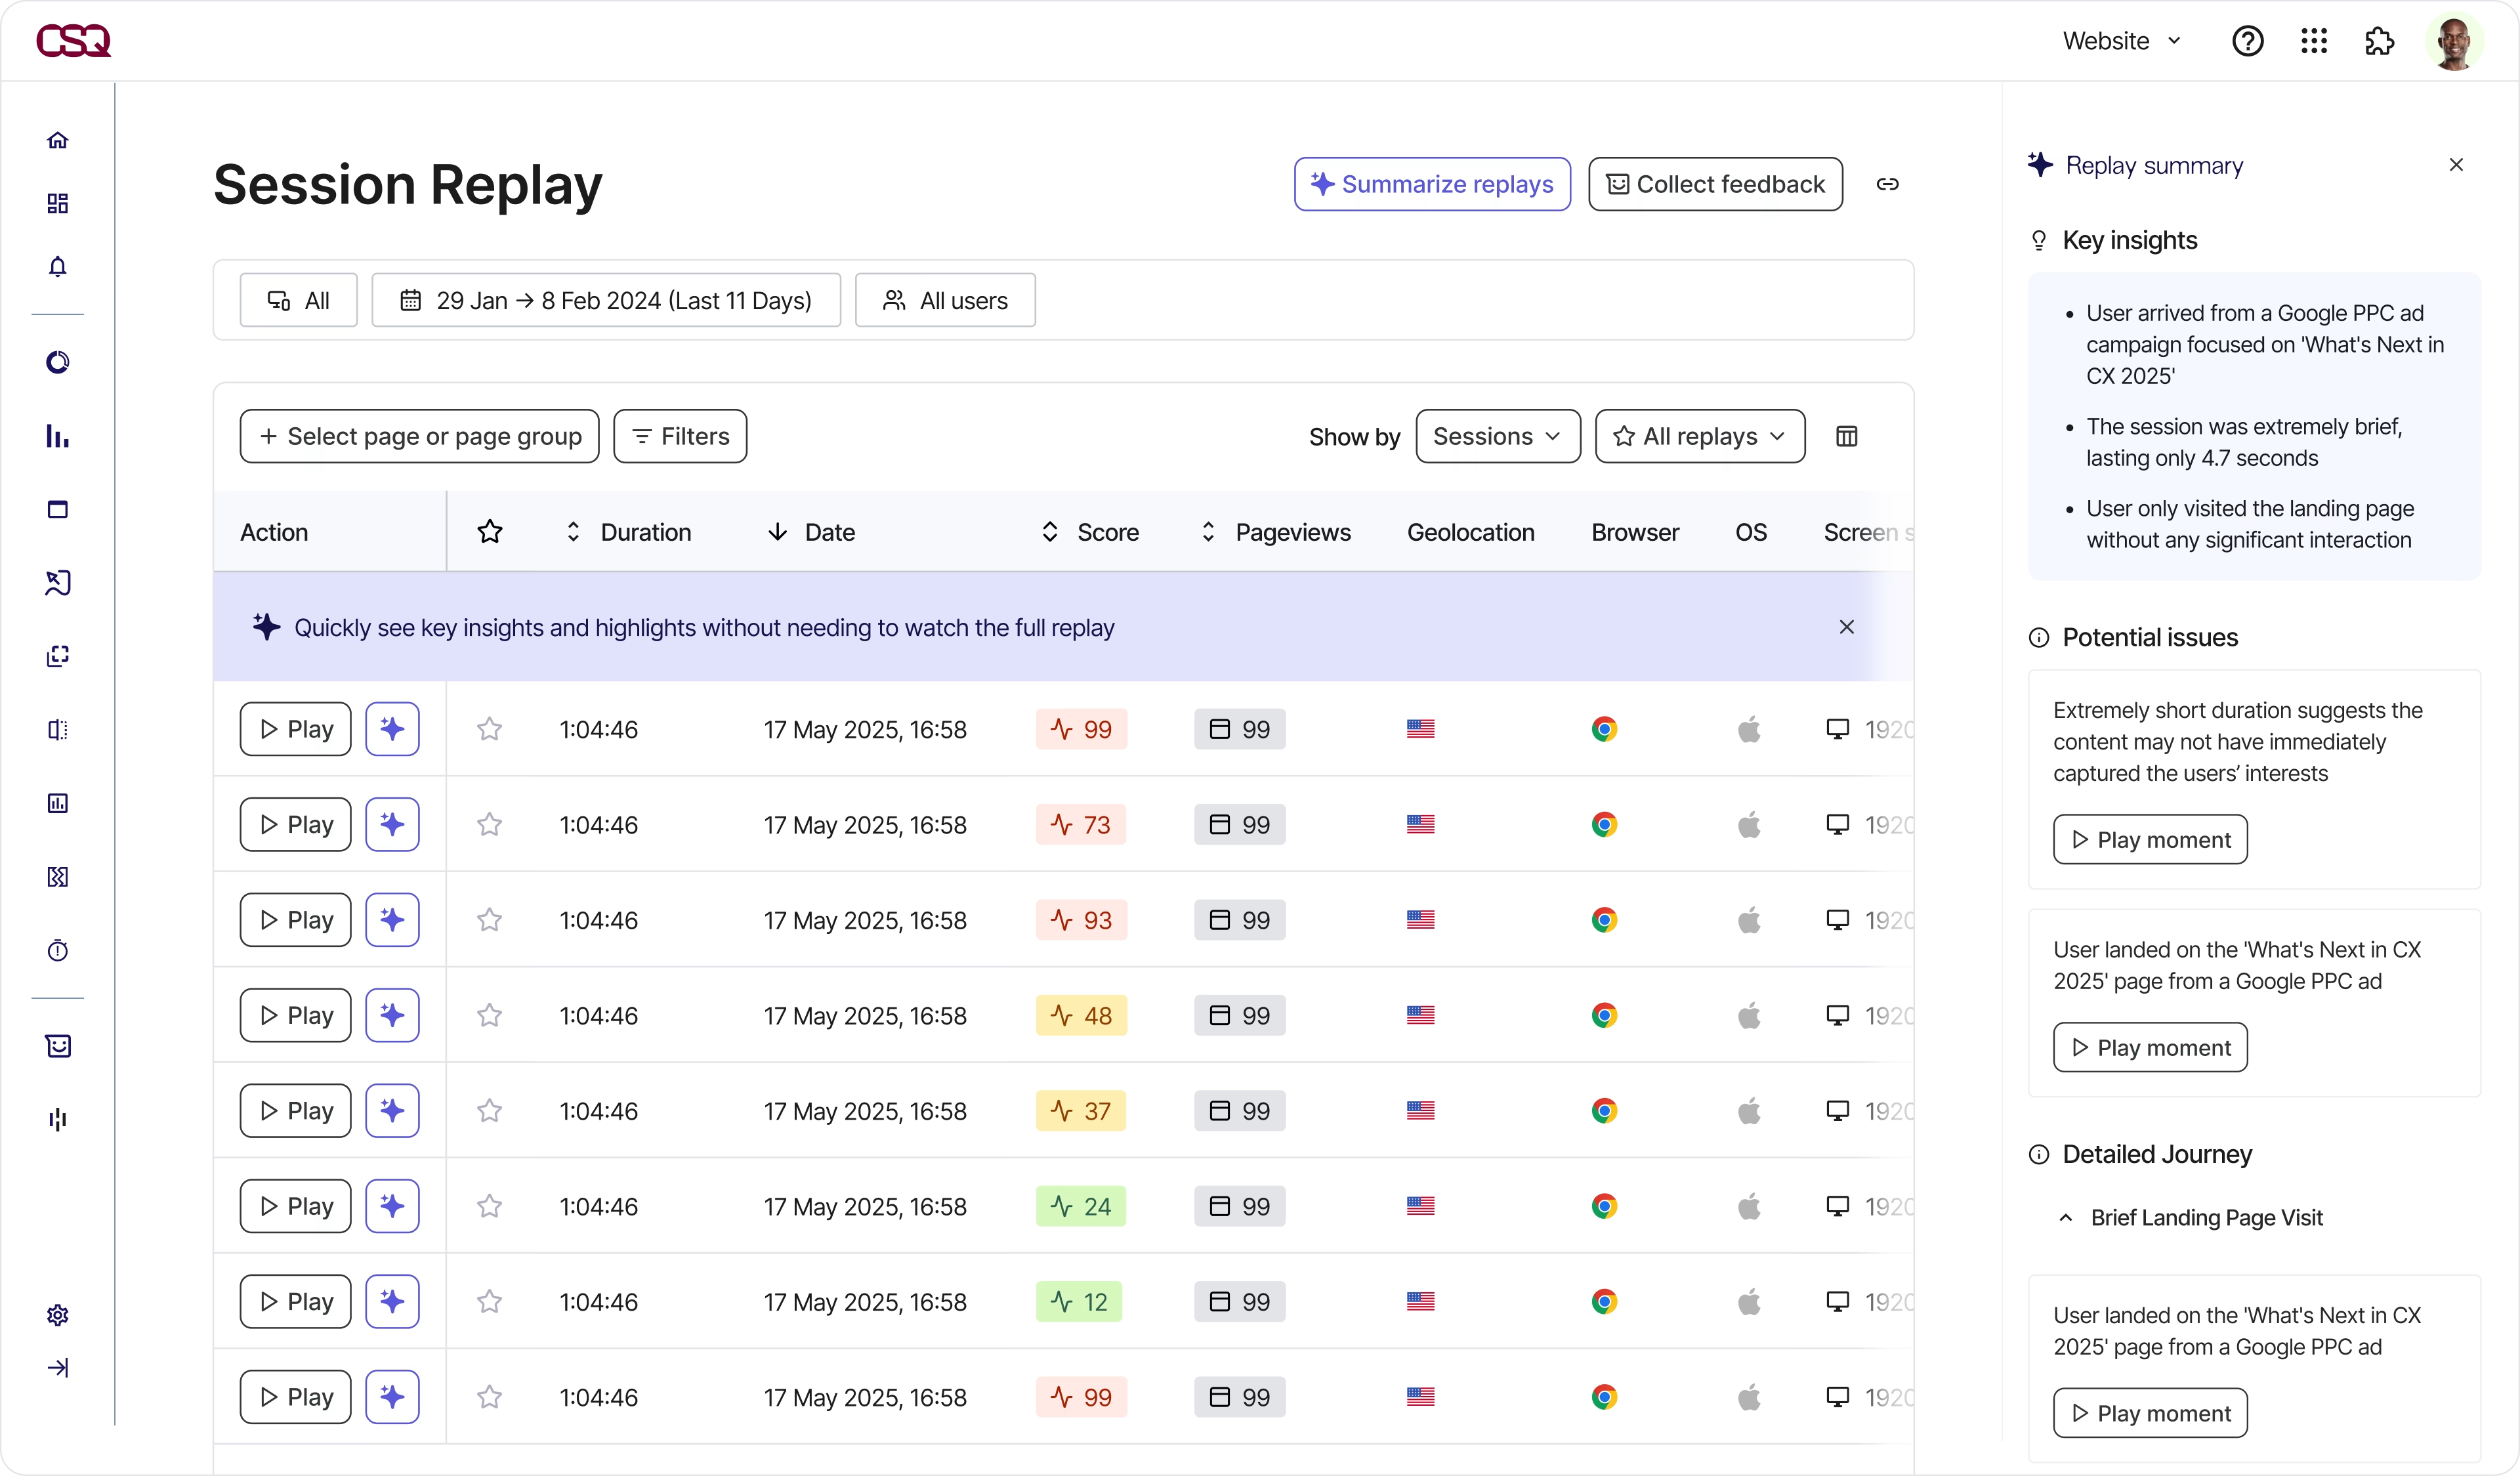
Leadership and strategy teams use AI CoPilot to ask natural-language questions like “Where are users hesitating most?” and get visual, instant answers
Any team can explore experience metrics live on their company’s website with the CS Live Chrome Extension,
Every Contentsquare plan includes unlimited seats. That means everyone, from support to strategy, can explore, share, and act on insights.
With one platform, one dataset, and no barriers to access, Contentsquare turns digital experience into a shared language—and a smarter way to grow.
“Contentsquare provides a common source of truth for all our teams, allowing us to make the right decisions and achieve the company's objectives.”
2. Smarter insights from day one—no tagging, no delays
Most analytics platforms require you to define what to track before you can get value. Contentsquare works differently.
From the moment the tag goes live, Smart Capture automatically collects every user interaction across your site or app—clicks, taps, scrolls, field interactions, hesitations, rage clicks, slowdowns, and errors. No tagging, no engineering, no missed data.
And because the data is retroactive, your team can answer new questions any time—even if the event wasn’t labeled in advance.
To help you make sense of everything that’s captured, Contentsquare includes built-in intelligence designed to surface what matters most:
Visual data labeling: use a simple point-and-click interface to label important behaviors and keep your workspace focused—while keeping all other events in the background for deeper exploration (Contentsquare vs Heap)
Frustration Score: automatically detects signals like rage clicks and repeated actions so you can instantly spot where users are struggling
![[Visual] Frustration score](http://images.ctfassets.net/gwbpo1m641r7/7pI87Hr7R09euoIW2AGziS/c95d2b851d25ee2e6a97f49baba2703e/Screenshot_2024-11-04_at_23.18.45.png?w=3840&q=100&fit=fill&fm=avif)
Automatically see what’s making people leave with Frustration Score
Headlines: delivers weekly updates on what’s changed in your experience, why it happened, and what to prioritize next
Chat with Sense: lets anyone ask plain-language questions, such as “What’s causing the drop in conversions?”, and get a clear, chart-illustrated answer on the spot
![[Visual] Contentsquare-AI-CoPilot](http://images.ctfassets.net/gwbpo1m641r7/1556CfiS0NNAdoVEJT855b/f2ab2bb90a02b05e7c44d10fe0688869/Contentsquare-AI-CoPilot.png?w=3840&q=100&fit=fill&fm=avif)
Generate answers and analytics charts using plain language prompts with Sense
Smart segmentation: quickly filter behavior by device, channel, campaign, or audience—without building custom reports or writing SQL
AI-powered Voice of Customer analysis: automatically generate survey questions, tag open text feedback, and analyze sentiment—so you can understand not just what users say, but what their feedback means and what to do next
With Contentsquare, intelligence is built in, not bolted on. You get the full picture from day one—automatically captured, intelligently organized, and ready for action.
“With other tools, it will take you six weeks to get extra data on your next question. With Heap [now, Contentsquare Product Analytics] you can get answers in fifteen minutes.”
3. Revenue-backed prioritization
Most analytics platforms show you what happened. Contentsquare shows you what it’s worth.
With Impact Quantification, you can see exactly how much revenue is being lost to friction, whether it’s being caused by a rage click on a broken filter, a slow-loading checkout step, or a buried CTA on a high-traffic page.
This lets your teamS
Focus on the issues that actually move the needle
Align priorities across product, UX, and marketing
Make business cases that are grounded in real numbers—not opinions
They can even view revenue impact directly within tools like
Heatmaps: see which buttons, banners, or links are generating value—and which are being ignored
![[Visual] heatmaps-zoning-elements](http://images.ctfassets.net/gwbpo1m641r7/3DqJkn0v2NqzqliOf9X4WI/0e17fdec33256700832ec903dc6dd449/image.png?w=3840&q=100&fit=fill&fm=avif)
Only Contentsquare’s zone-based heatmaps show you which elements drive revenue
Funnel Analysis: pinpoint where users drop off and how much each step is costing you in missed conversions
Session Replay: click straight from a replay to quantify how widespread a behavior is—and what fixing it is worth to you
![[visual] Click to quantify the revenue or conversion impact of any error you find in Session Replay](http://images.ctfassets.net/gwbpo1m641r7/4Ax2KjWFwK4G68yup4RIPq/f613c474aeea6e4964e9e00f757cff4b/click-to-quantify-session-replay-issues-in-Contentsquare__1_.png?w=1920&q=100&fit=fill&fm=avif)
Click to quantify the revenue or conversion impact of any error you find in Session Replay
With Contentsquare, teams don’t just get to see where users struggle. They also know which fixes will have the biggest impact, so they can prioritize with confidence and prove the ROI of every experience improvement.
How to use Contentsquare to turn insight into action
Different teams need different things from their analytics. Product teams want to boost adoption. UX teams want to reduce friction. Marketing wants to know what’s working—and why.
Contentsquare brings everyone onto the same page with shared insights, visual tools, and revenue-backed priorities that make it easy to take action.
Keep reading to see how teams across product, design, marketing, and digital experience use Contentsquare to solve problems faster, validate decisions, and drive growth—without jumping between tools or waiting on analysts.
🛠️ Fix leaky journeys and optimize conversions
The problem Users are dropping off—abandoning carts, bouncing from key pages, or failing to complete journeys. Traditional funnels show you where this happens, but not why.
What you can do with Contentsquare
Journey Analysis: uncover the real paths users take across sessions, devices, and channels—not just predefined funnels. Spot unexpected drop-offs and detours at a glance
Heatmaps: use zonal analysis to see exactly how users interact with every element on your high-value pages (like checkout and lead gen forms). Identify which CTAs are working—and which are being ignored
Session Replay with Frustration Scoring: watch replays of sessions flagged for issues like rage clicks, hesitations, or broken elements. See the behavior behind the drop-off
Impact Quantification: measure how much each friction point or UX issue is costing you in lost conversions or revenue. Prioritize fixes based on business impact—not gut feel
Voice of Customer: pair behavioral insights with user feedback, such as that provided by an exit survey. Use AI to analyze feedback themes and identify what’s making people leave
AI-powered Session Replay Summaries give you instant insights, while the Frustration Score reveals the most damaging (and costly) areas of user friction
The outcome You’ll know where user friction is, why it matters, and what to fix first to unlock more conversions, faster.
See it in action Action camera company GoPro used Contentsquare to redesign their Hero7 product detail page (PDP).
After leveraging Journey Analysis, Heatmaps, and Session Replay, GoPro pinpointed key friction points and optimized user flow leading to an 80% increase in conversions.
🚀 Boost product adoption and retention
The problem
You launch new features... and no one uses them. Churn is creeping up, and it’s hard to tell what’s driving loyalty—or pushing users away. Traditional product analytics show usage rates, but not the experience behind them.
What you can do with Contentsquare
Product Analytics (powered by Heap): automatically track feature adoption, onboarding completion, and repeat usage—no manual tagging required. Group users by cohorts and analyze retention trends over time
Session Replay + Heatmaps: see how users actually interact with new features. Are they engaging? Confused? Abandoning midway? Visualize usage patterns and uncover UX friction
Integrated Voice of Customer: pair user feedback with behavioral data to understand the why behind poor adoption or drop-off. Was it a usability issue? Misaligned expectations? Feature fatigue?
Impact Quantification: compare features not just by usage—but by the value they generate. Identify which experiences drive stickiness, and which ones are quietly pushing users out the door
![[visual] Analyze product feedback quicker with AI sentiment tagging](http://images.ctfassets.net/gwbpo1m641r7/188W3gZ3ALnAitGz9XmOoS/031f34c9cb41c6cd52042af3131f6d3a/Contentsquare-product-feedback-analysis.jpeg?w=3840&q=100&fit=fill&fm=avif)
Analyze product feedback quicker with AI sentiment tagging
The outcome
Know what’s driving engagement, what’s stifling it, and how to build product experiences that keep users coming back.
See it in action
Scheduling app PocketSuite used Heap (now Contentsquare Product Analytics) to identify the behaviors of their most successful users and revamp onboarding based on real activation data.
By tailoring flows to different user segments and removing guesswork with retroactive insights, the team cut paid user churn by 30%.
⚠️ Find and fix experience issues before users complain
The problem
Bugs, broken elements, slow pages, or confusing flows silently block conversions—but you often don’t hear about them until they hit support tickets (if at all). APM tools like Datadog or Dynatrace flag issues, but don’t show the user experience behind them.
What you can do with Contentsquare
Digital Experience Monitoring (DEM): automatically detect technical issues like JavaScript errors, failed API calls, and slow load times—alongside their business impact
Frustration Detection: use AI to surface sessions with signs of struggle: rage clicks, repeated interactions, dead clicks, and hesitations. Let the data tell you where users are getting stuck
Session Replays: replay impacted sessions with full technical context—network requests, error types, device details—so product and dev teams can reproduce and resolve issues fast
Impact Quantification: instantly see how much revenue is being lost to a single error or slowdown. Prioritize fixes that actually move the needle
![[Visual] Error analysis](http://images.ctfassets.net/gwbpo1m641r7/6ELBPV051gA5ePLDZOiFEG/8352c504a71e140b84d4b0587b2c446c/eyJwYXRoIjoiY29udGVudHNxdWFyZVwvZmlsZVwvZHVGZlF4bWVzMjU0WGhkNXExOXcucG5nIn0_contentsquare_-5dJe5Xqp6vEwH1Gl8wqmZQXmHHT4auNG_.png?w=3840&q=100&fit=fill&fm=avif)
Effortlessly monitor your website and mobile app’s performance with Experience Monitoring
The outcome
Spot and solve issues before they show up in your inbox—and protect conversion rates without waiting on complaints.
See it in action
Optical and audiology retailer Specsavers used Experience Monitoring to identify and fix slow-loading pages, which were directly impacting conversion rates.
By integrating Speed Analysis with behavioral data, they saw that users with slower page load times (LCP > 4 seconds) were more likely to bounce and less likely to convert.
After optimizing site speed, they achieved a +33% boost in conversion rate and a +24% increase in eCommerce purchases—all before these issues hit their support team.
📈 Turn campaign traffic into revenue
The problem
You’re paying more for traffic—but getting less in return. According to our 2025 Digital Experience benchmarks report, paid social alone brought +12% more traffic, but drove -10.6% lower conversions.
Contentsquare helps you negotiate this challenge by analyzing landing pages, understanding user behavior by source, and empowering you to fix what’s holding users back.
What you can do with Contentsquare
Heatmaps: see which campaign elements (headlines, CTAs, offers) are getting attention, engagement—and revenue. Visualize which sections of your landing pages actually drive results
Segmented Journey Analysis: compare how different traffic sources (paid, organic, social, email) navigate your site. Spot which journeys convert—and where specific audiences drop off
Side-by-side comparisons: analyze A/B test variants visually to understand behavioral differences, not just conversion deltas. See what made the winning version work
Autocapture plus retroactive analysis: instead of forcing you to manually tag every campaign element like you would in GA4 or Adobe, Contentsquare Smart Capture simply captures everything from the moment you implement it. You can analyze any instance of user behavior from the date of install—even if you forgot to tag something
![[visual] Journey Analysis showing how an API error makes users bounce](http://images.ctfassets.net/gwbpo1m641r7/447rDhfFAaCxBEC9zUdX0h/e1d6f86f94f42e220b8911ba848935d1/error_analysis_in_Contentsquare_Journeys.png?w=3840&q=100&fit=fill&fm=avif)
Use Journey Analysis to compare side-by-side customer journeys by any segment
The outcome
Stop guessing why pages don’t convert. See exactly how users engage, and turn every campaign into a smarter, more profitable one.
See it in action
Supplement brand OLLY used Heatmaps and Journey Analysis to optimize campaign landing pages based on real customer behavior.
After identifying missed opportunities in CTA placement and product visibility, the team made targeted layout changes—resulting in a +20% increase in website revenue and a +3% lift in average order value.
Contentsquare vs competitors: which is best for your team?
There’s no shortage of platforms promising insights into your digital experience. Some specialize in feedback. Others focus on product analytics or backend performance. A few offer glimpses of behavior—but leave you to figure out the rest.
Only Contentsquare brings together visual behavior analytics, built-in intelligence, and revenue-backed prioritization in a single platform your whole team can use.
If your goal is to
Understand how users really experience your site or app
Prioritize the fixes and features that actually drive growth
Empower every team to take action without tagging or technical delays
… then Contentsquare is built for you.
Whether you're just starting out or running digital operations at global scale, Contentsquare fits your stage. Choose a free forever plan to get going, or scale up with the platform trusted by leading brands like Visa, Bose, Samsung, and Zoom.
The results speak for themselves: According to Forrester, businesses using Contentsquare see a 602% ROI and recover over $3.2 million in revenue by fixing friction in the digital journey.
FAQs about Contentsquare alternatives
Contentsquare is the all-in-one Experience Intelligence platform designed to be easily used by anyone that cares about digital journeys. With our flexible and scalable platform, you quickly get a deep understanding of your customers’ whole online journey.
Leading brands use Contentsquare to grow their business, deliver more customer delight, and move with greater agility in a constantly changing world. Contentsquare insights are used to optimize the experience on over 1.3 million websites worldwide.
Founded in Paris in 2012 by Jonathan Cherki, Contentsquare has raised over $1.4 billion in funding and acquired tools like Pricing Assistant and Clicktale (2019), Hotjar (2021), and Heap Analytics (2023). Today, Contentsquare has a team of +1,800 across 16 global offices.
Net Promoter®, NPS®, NPS Prism®, and the NPS-related emoticons are registered trademarks of Bain & Company, Inc., NICE Systems, Inc., and Fred Reichheld. Net Promoter ScoreSM and Net Promoter SystemSM are service marks of Bain & Company, Inc., NICE Systems, Inc., and Fred Reichheld.
![[Visual] Contentsquare's Content Team](http://images.ctfassets.net/gwbpo1m641r7/3IVEUbRzFIoC9mf5EJ2qHY/f25ccd2131dfd63f5c63b5b92cc4ba20/Copy_of_Copy_of_BLOG-icp-8117438.jpeg?w=1920&q=100&fit=fill&fm=avif)
We’re an international team of content experts and writers with a passion for all things customer experience (CX). From best practices to the hottest trends in digital, we’ve got it covered. Explore our guides to learn everything you need to know to create experiences that your customers will love. Happy reading!