
Heatmaps, evolved
Everything you love about heatmaps, now with an AI layer that goes beyond clicks and scrolls to show you exactly which content drives attention, conversions, and revenue—across every zone of every page. Get a visual breakdown of what's working and what's not, so you can make faster, smarter decisions.
Trusted by 3,000 enterprise and mid-market brands and 1.3+ million websites
Digital experience, your next revenue driver

increase in ecommerce purchase rate, +33% conversion rate of optics booking


QA analysis outcome score has gone up by 15% from 85% percent to 98%
Optimize your pages based on helpful behavior insights
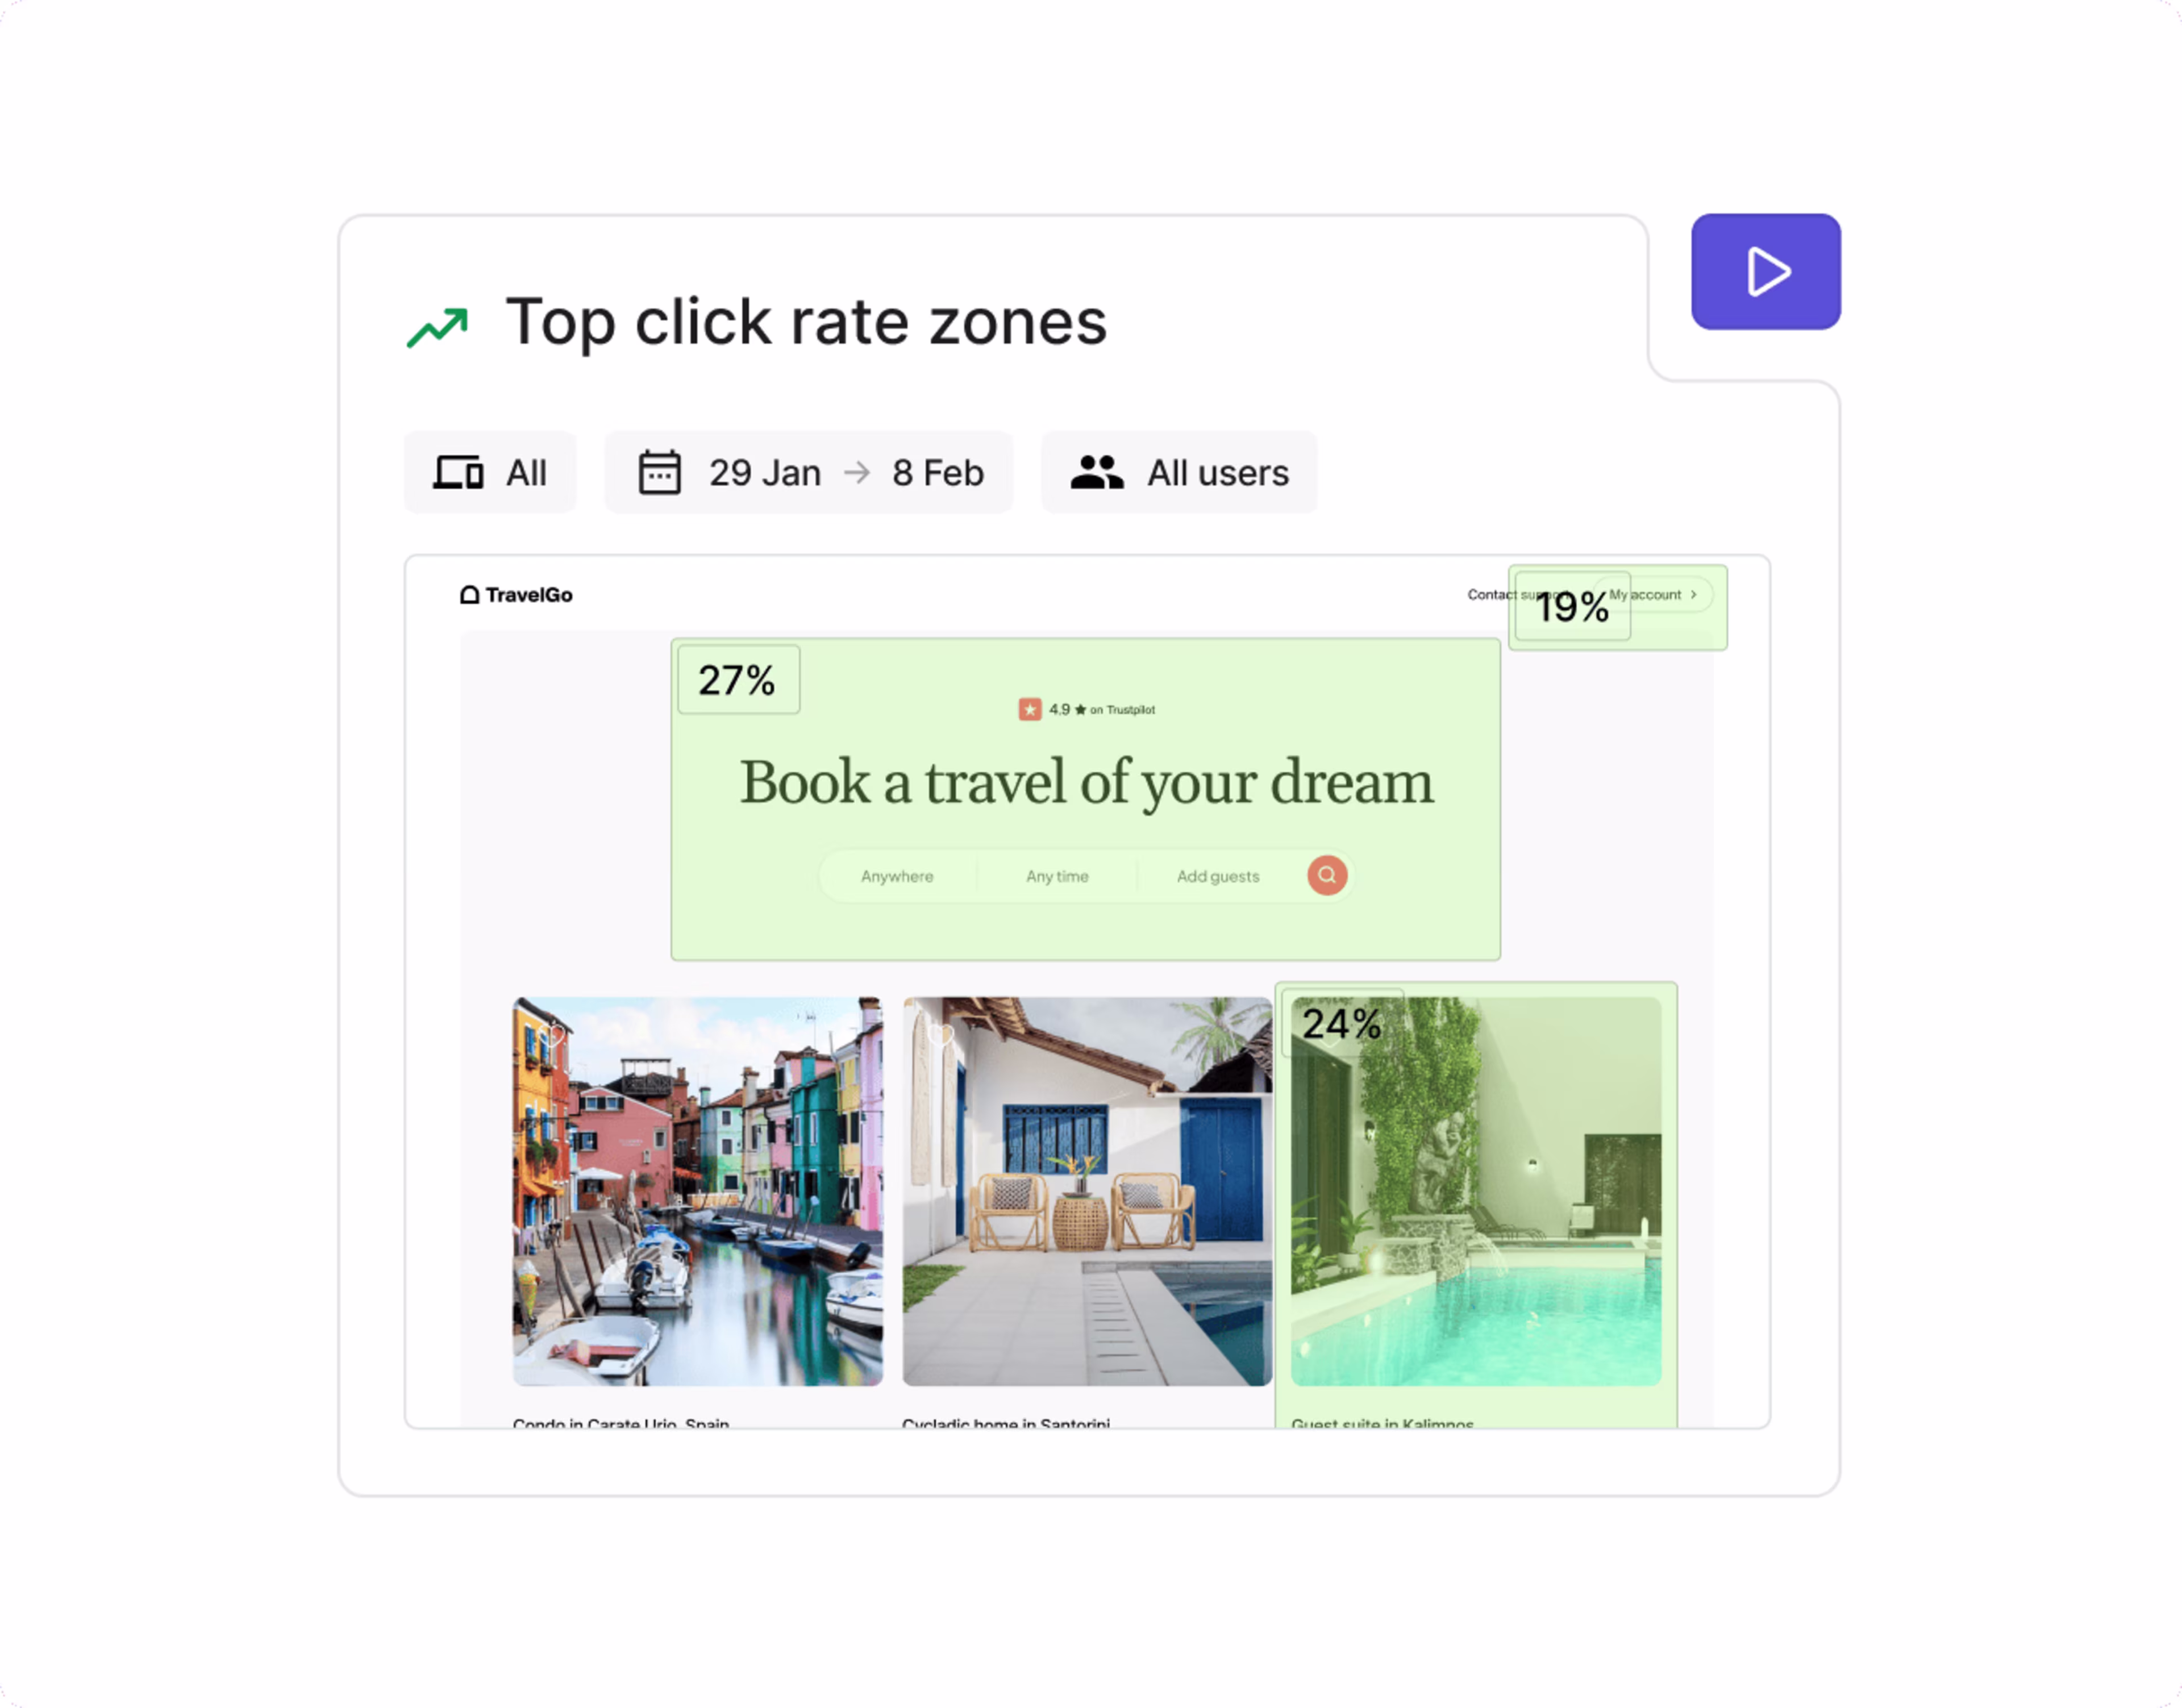
Find out which page elements deliver the best outcomes
Traditional heatmaps show you which page elements get the most clicks. Zone-based heatmaps go further, showing how each element contributes to goals like conversions and revenue. Find out which images and links drive your desired outcomes, then optimize customer journeys to highlight them even further.
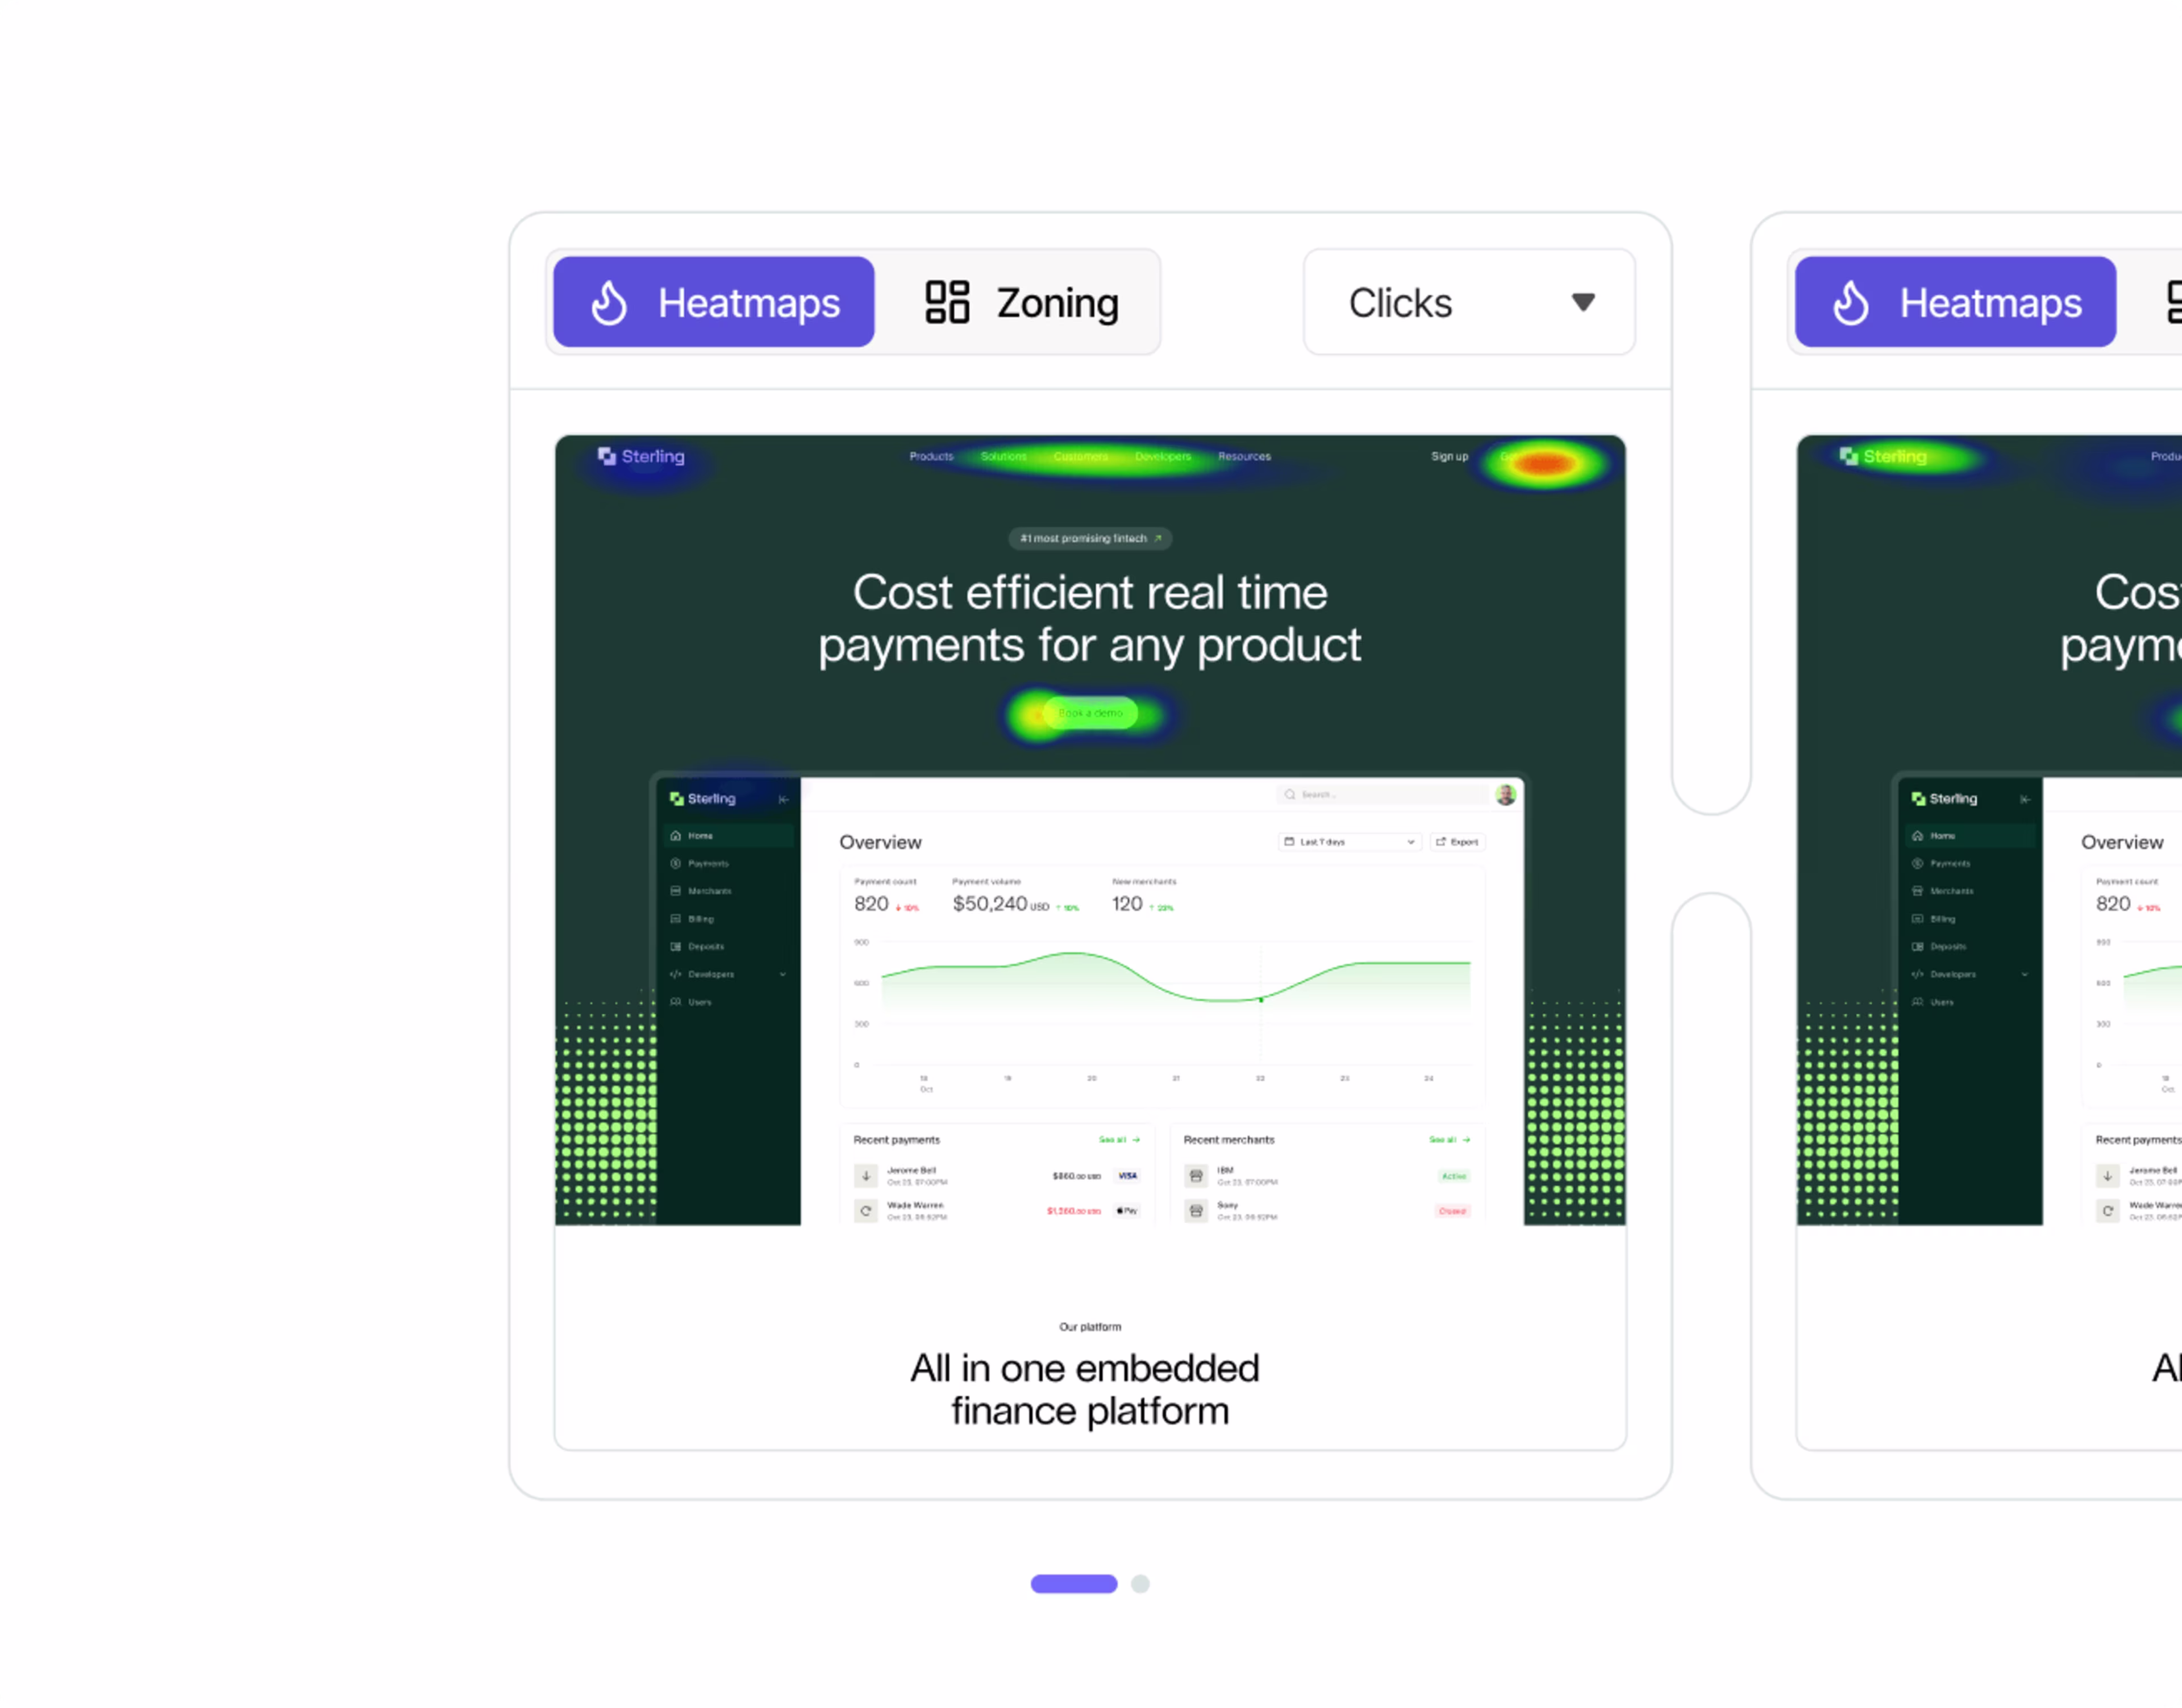
See how different page elements stack up in different scenarios
Want to learn more about your content? Try viewing different zone-based heatmaps side-by-side. Compare heatmaps from different time periods, traffic sources, and more to see how audiences performed. Or compare two heatmaps from your A/B tests to understand why one variant outperformed the other.
Understand which parts of your forms are confusing or frustrating users
Use form analysis to see helpful metrics, like how many users completed the form or dropped off. Find out which fields are often left blank, and check heatmaps to see signs of struggle. Jump to related session replays to see users navigating forms in real time (with their personal details hidden automatically by Contentsquare).

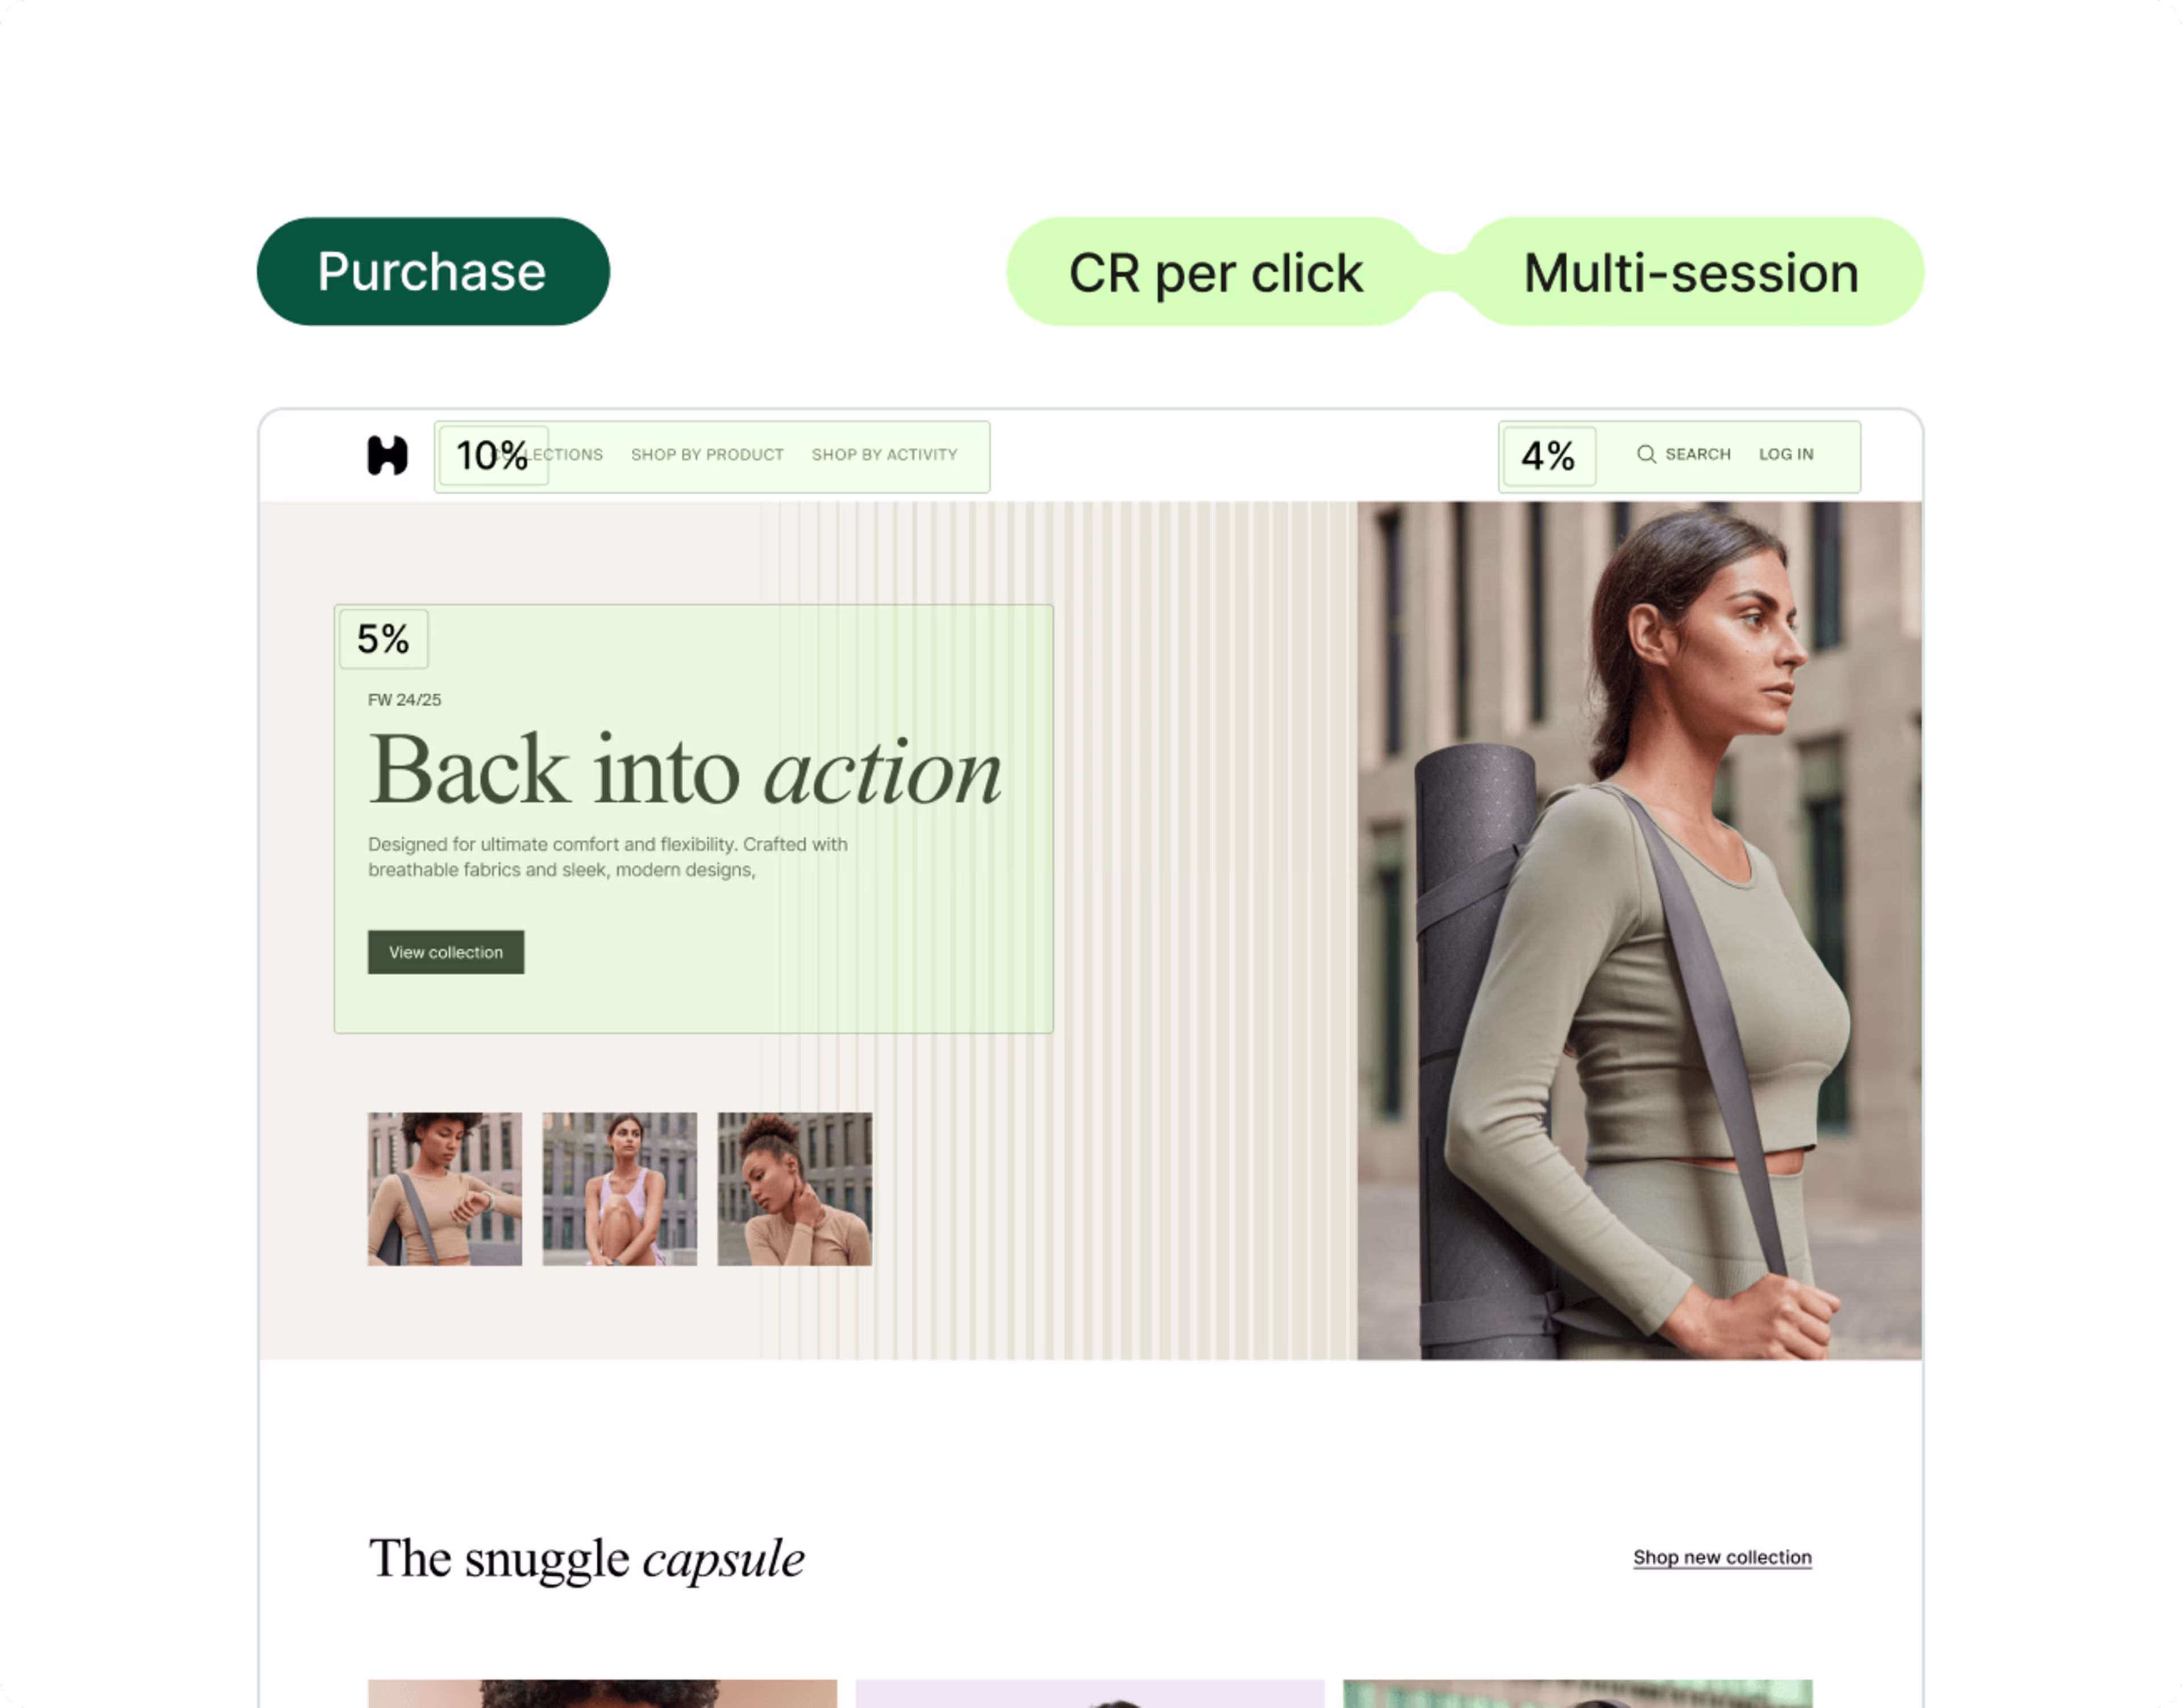
Zone-based heatmaps break down behavior from repeat visitors
See how page elements affect behavior across sessions—like when users visit multiple times before purchasing. Understand which page elements get clicked most by repeat visitors, and which ones generate the most purchases over time.
Frequently asked questions
A heatmap tool is a visual analytics tool that provides insights into user interaction on a webpage. Using color-coded overlays, it displays where users click, move the cursor, or spend the most time. This helps you understand user behavior and optimize website design for a better user experience.