
Customer experience (CX) is the sum of every interaction a customer has with your brand, and is an important indicator of how likely they are to return or recommend you to others.
This guide covers 10 essential customer experience metrics, explains how to calculate each one, and shows you how to choose the right metrics for your business and act on what you learn.
Key takeaways
Customer experience metrics measure satisfaction, loyalty, effort, and business outcomes across the customer journey
Core metrics include customer satisfaction score (CSAT), Net Promoter Score® (NPS®), customer effort score (CES), customer sentiment, churn rate, retention rate, customer lifetime value (CLV), referral rate, first response time (FRT), and average resolution time (ART)
Choose metrics based on your business model, customer journey stage, and specific improvement goals
Combine quantitative metrics with qualitative feedback to understand the 'why' behind the numbers
CX metrics comparison table
Metric | What it measures | Calculation | Best for | Benchmark range |
|---|---|---|---|---|
CSAT | Satisfaction with specific interaction | (4-5 ratings / total responses) × 100 | Post-purchase, post-support | 75-85% |
CES | Effort required to complete action | Sum of ratings / number of responses | Post-transaction, post-support | 5+ on 7-point scale |
NPS® | Likelihood to recommend | % promoters - % detractors | Relationship health | Above 0 (50+ excellent) |
Customer sentiment | Emotional tone of feedback | AI/NLP analysis of responses | Early warning detection | Trending positive |
Churn rate | Customer loss rate | (Customers lost / starting customers) × 100 | Subscription businesses | 2-8% monthly |
Retention rate | Customer loyalty over time | (End customers / start customers) × 100 | All business models | 85-95% annually |
CLV | Revenue per customer over time | Varies by business model | Revenue forecasting | Industry-specific |
Referral rate | Active customer advocacy | (Referring customers / total) × 100 | Growth-focused teams | 10%+ is strong |
FRT | Speed of initial response | Sum of response times / number of issues | Support operations | Channel-dependent |
ART | Speed of issue resolution | Total resolution time / number of tickets | Support quality | 24-48 hours typical |
10 customer experience metrics to track
CX metrics fall into three main categories: satisfaction metrics (how customers feel), retention metrics (whether they stay), and operational metrics (how efficiently you serve them). Here are the 10 metrics that matter most.
1. Customer satisfaction score (CSAT)
Customer satisfaction score (CSAT) is a simple measure of user satisfaction with a product, website, or service. A standard CSAT survey asks, 'How satisfied were you with [product/website] today?' on a scale of 1 to 5, where 1 is very unsatisfied and 5 is very satisfied.
Measure CSAT by asking customers how satisfied they are at a relevant part of the customer journey, for example on a purchase confirmation page or when a user is logging out. The best time to ask is immediately after an interaction, while the experience is fresh.
A good CSAT score typically falls between 75-85%, though benchmarks vary by industry. Scores below 70% signal a need for immediate investigation.
How to calculate CSAT
Add up the number of 4 and 5 ratings, divide by the number of responses, and multiply by 100.
Set up a CSAT survey in minutes with survey templates with Contentsquare's Surveys.
Add a survey to any website page, and trigger CSAT follow-up questions if customers leave low ratings to find out why they aren't satisfied. Not sure what to ask? Let Contentsquare's AI, Sense, generate questions for you. You can also collect CSAT responses from customers at any point in the user journey with our Feedback button.
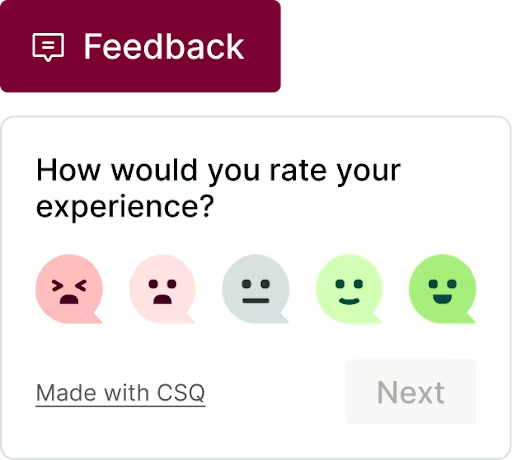
Contentsquare's feedback widget captures customer sentiment in the moment.
2. Customer effort score (CES)
Customer effort score (CES) measures the amount of effort a customer has to exert to perform an action (Ex: purchase a product, find information, or resolve a problem). CES is usually rated on a scale of 1 to 5 or 7, from very difficult to very easy.
Measure CES by asking customers, 'How easy was it for you to [insert action here]?' when they complete a key action, for example:
After making a purchase
After using a service
After talking to customer support
After completing account setup or onboarding
You want CES to be as high as possible—a low customer effort score means customers find your website difficult to use or customer support unhelpful. Asking a follow-up question on low CES ratings will help you find out what's holding customers back, identifying specific pain points and adding friction to their journey.
A CES of 5 or higher (on a 7-point scale) indicates a low-effort experience. Anything below 4 suggests friction that needs attention.
How to calculate CES
Add all customer effort ratings and divide them by the total number of survey responses to get your average CES.
Set up a CES survey in minutes with survey templates with Contentsquare's Surveys.
Use Contentsquare's Session Replays to see how customers navigate your site. Look for rage clicks (rapid, frustration-induced clicks or taps on certain elements), as these customers might be putting in a lot of unnecessary effort to get something done.
![[Visual] Rage clicks](http://images.ctfassets.net/gwbpo1m641r7/4Pq9iLl1o4oFPFyqUdrCed/a38f3e461ca77264c698318b54c869ab/Screenshot_2024-12-04_at_13.30.20.png?w=1280&q=85&fit=scale&fm=avif)
Use Contentsquare to find rage clicks and watch related session replays.
3. Net Promoter Score (NPS®)
Net Promoter Score (NPS®) is a customer loyalty and satisfaction metric obtained by asking customers how likely they are to recommend your product or service to others on a scale of 0 to 10.
Collect NPS® responses by asking the standard NPS® question ('On a scale of 0–10, how likely are you to recommend us?') after a customer has received delivery of a purchase or used a service for a reasonable amount of time.
NPS® scores above 50 considered excellent and above 70 world-class. Track NPS® by customer segment (new vs. returning, by product line, by region) to identify where loyalty is strongest and where it needs work.
How to calculate NPS
Categorize responses into detractors (0 to 6), passives (7 and 8), and promoters (9 and 10), and subtract the percentage of detractors from the percentage of promoters. Or, take a shortcut with Contentsquare's free NPS® calculator.
Use Contentsquare's Surveys to set up an NPS® survey in minutes.
Pro tip: NPS® is a useful (and popular) benchmark to help alert you to customer experience problems, but without follow-up questions, you won't be able to fix them.
Ask these follow-up survey questions to find out more:
For those who score you 9 and 10 (i.e. your promoters) ask: 'We're thrilled you feel that way. What's the main reason for your score?"
For those who score you 6 or less (i.e. your detractors) ask: 'What can we do to improve your experience and your score?'
Ask everyone: 'If we could do anything, what could we do to wow you?'
Use Contentsquare's Slack integration and send these responses to a dedicated channel so team members can stay on top of customer sentiment. The responses to these follow-up questions can help you plan your roadmap, better align with customer needs, and make improvements to your product.
![[Visual] Share in real time via Slack](http://images.ctfassets.net/gwbpo1m641r7/NrQzonnNWGmn6RAF33WFI/ea4eb10640a11305675b4c4df6b0b0e1/Real_time_dashboards__1_.png?w=1280&q=85&fit=scale&fm=avif)
Contentsquare's integration with Slack means you can get alerts directly in your team's communication channel.
4. Customer sentiment
Customer sentiment measures whether customers have a positive, negative, or neutral emotional response to your brand or specific interactions. While NPS® tells you if customers would recommend you, sentiment analysis reveals the emotional tone behind their feedback.
You can measure sentiment through:
Survey analysis: open-ended responses analyzed for emotional tone
Social listening: monitoring brand mentions across social platforms
AI-powered analysis: using natural language processing (NLP) to automatically categorize feedback
Sentiment tracking helps you catch emerging issues before they show up in your NPS or CSAT scores. A sudden shift toward negative sentiment in support tickets, for example, might signal a product issue that hasn't yet affected your broader metrics.
Use Contentsquare's Sense to automatically categorize survey responses as positive, neutral, or negative, giving you an at-a-glance view of how customers feel without manually reading every response.
![[Visual] Capabilities - Surveys - Use Cases - End to End Research - Sentiment analysis segmentation](http://images.ctfassets.net/gwbpo1m641r7/2WOOH1zq9QU9AIt9t8wiTf/bbcf48f43b9ba6885567c675ed693e18/Conduct_end-to-end_user_research.svg?w=654&q=85&fit=scale)
Categorize sentiment and compare between customer segments with Contentsquare.
5. Customer churn rate
Customer churn rate measures the percentage of customers who stop subscribing to or buying products from a company over a given period. High churn indicates something might be wrong with the customer experience, prompting customers to leave.
For most businesses, monthly churn rates between 2-8% are typical, though this varies significantly by industry. SaaS companies often target monthly churn below 5%, while ecommerce businesses may see higher rates due to the transactional nature of purchases.
How to calculate churn rate
For SaaS and subscription businesses: divide the number of customers lost during a period by the number of customers at the start of that period, then multiply by 100.
Example: if you started the month with 1,000 customers and lost 50, your monthly churn rate is 5%.
Set up your own B2B churn survey in moments with Contentsquare's survey templates.
6. Customer retention rate
Customer retention is a business's ability to keep its customers over time—the flip side of churn. High retention rates indicate customers find ongoing value in your product or service.
How to calculate retention rate
For SaaS and subscription businesses: calculate monthly retention by dividing the number of active customers at the end of the month by the number of active customers at the beginning of the month.
For ecommerce businesses: calculate retention by using cohort analysis to group customers who made repeat purchases in a chosen time frame. For example, of customers who first purchased in January, what percentage purchased again within 90 days?
Use Contentsquare's Journey Analysis to visualize the full customer journey across sessions, pages, and channels, allowing teams to see where users drop off, convert, or loop.
Then, use Contentsquare's Impact Quantification tool to tie issues back to conversion rates so you can prioritize changes that will have the biggest impact on retention.
![[visual] Contentsquare automatically finds high impact optimizations for](http://images.ctfassets.net/gwbpo1m641r7/3AVqp8bjKGWJOHkBIZfkNm/4e33410c569a6e180901aad7b1992fc8/Contentsquare-competitors-impact-analysis.png?w=1280&q=85&fit=scale&fm=avif)
Understand the business impact of customer actions across your product or service.
7. Customer lifetime value (CLV)
Customer lifetime value (CLV) is the average revenue a customer is expected to bring to your company over time. While it's primarily a revenue metric, CLV also reflects customer loyalty and satisfaction—happy customers stay longer and spend more.
How to calculate CLV
For SaaS companies: CLV is measured by dividing monthly recurring revenue (MRR) by the total number of customer accounts, then dividing the result by user churn rate.
For ecommerce businesses: CLV is calculated by multiplying the average order value (AOV) by purchase frequency and estimated customer lifespan.
CLV might first and foremost be considered a revenue metric, but it also represents customer loyalty and satisfaction. The happier your customers are, the more likely they are to buy from you again or stay subscribed. The result? Increased CLV and business revenue.
Improving CX directly impacts CLV by fostering deeper customer engagement. Reducing friction in the purchase process, resolving support issues faster, and delivering consistent quality all contribute to longer customer relationships and higher lifetime value.
Use Contentsquare's Advanced Journey Analytics to measure and analyze customer interactions across all touchpoints and campaigns to see how you can increase CLV.
8. Customer referral rate
Customer referral rate measures the percentage of customers who refer new customers to your business. It's a direct indicator of customer advocacy and ties closely to your NPS promoters—customers who score you 9 or 10 are most likely to actively refer others.
How to calculate referral rate
Divide the number of customers who made referrals by your total number of customers, then multiply by 100.
Example: if 200 of your 2,000 customers referred someone in the past quarter, your referral rate is 10%.
Track referral rate alongside NPS® to see if your promoters are actually taking action. A high NPS® with a low referral rate might indicate you need to make it easier for satisfied customers to spread the word.
![[Visual] Meet up event feedback survey](http://images.ctfassets.net/gwbpo1m641r7/6JaKIovRKhnH2TcMdHER3Q/9cf8574d490138596540de8eb9da59d8/Group_1948760392__1_.png?w=1280&q=85&fit=scale&fm=avif)
Understand your NPS® score directly in Contentsquare's dashboad.
9. First response time (FRT)
First response time (FRT) is a customer service metric that measures the average time it takes customer support teams to respond to a customer issue or request. FRT can be measured in days or hours, depending on your business, contact center volume, and support channels.
Benchmark FRT targets vary by channel:
Email: within 24 hours (under four hours is excellent)
Live chat: 1-2 minutes
Phone: under three minutes
Social media: within one hour
How to calculate FRT
Add up all first response times and divide the result by the number of customer issues received.
Hiring more customer support staff will likely shorten first response times, but another way to achieve the same outcome is to optimize your website or product to reduce the number of support requests you receive. Faster responses correlate directly with higher customer satisfaction—customers who wait too long often churn before you can help them.
10. Average resolution time (ART)
Average resolution time (ART) is the average time it takes a customer success team to successfully resolve each customer support request. Like FRT, ART can be measured in days or hours.
Industry benchmarks for ART vary widely, for example:
Simple inquiries: same day
Technical issues: 24-48 hours
Complex problems: 3-5 business days
How to calculate ART
Add up the total duration of all customer conversations and divide the result by the number of customer chats or tickets.
Generally, the quicker the ART, the more likely a customer is to be satisfied and have enjoyed a positive experience with your service or product.
To streamline operations and reduce ART without sacrificing quality:
Build a comprehensive knowledge base for common issues
Empower frontline agents to resolve issues without escalation
Use behavioral analytics to understand what's causing support requests in the first place
How to choose which CX metrics to track
You don't need to track all 10 metrics from day one. Start with the metrics that align with your business model and current priorities, then expand as your CX program matures.
Match metrics to your business model
Different business models call for different metric priorities:
SaaS and subscription businesses: prioritize churn rate, retention rate, NPS®, and CLV. These metrics directly reflect whether customers find ongoing value in your product.
Ecommerce: focus on CSAT, CES, and referral rate. Transaction-based businesses benefit from understanding satisfaction at key moments and whether customers advocate for the brand.
B2B services: emphasize NPS®, CLV, and ART. Long sales cycles and high-touch relationships make loyalty and support quality critical.
Align metrics with customer journey stages
Consider which metrics matter most at each stage of the customer journey:
Acquisition: referral rate, NPS® (from existing customers)
Activation/onboarding: CES, CSAT
Retention: churn rate, retention rate, CLV
Support: FRT, ART, CSAT (post-support)
Advocacy: NPS®, referral rate, sentiment
Start by identifying where you're losing customers or seeing the most friction, then choose metrics that illuminate those specific stages.
How to collect customer experience data
CX metrics require data from multiple sources. Here's how to gather what you need.
Surveys and direct feedback
Surveys remain the most direct way to measure customer experience. Deploy them strategically:
Transactional surveys (CSAT, CES): trigger immediately after key interactions
Relationship surveys (NPS®): send quarterly or after significant milestones
Exit surveys: capture feedback when customers churn
Keep surveys short—1-3 questions maximum for transactional surveys. Always include at least one open-ended follow-up question to understand the 'why' behind scores.
Behavioral analytics and session data
Survey responses tell you what customers say. Behavioral data shows you what they actually do.
Qualitative customer data like behavior analytics insights complement survey metrics by revealing friction you might not hear about directly. Customers don't always report frustration—they just leave.
Session replays lets you watch exactly how customers navigate your site, revealing hesitation, confusion, and frustration that never makes it into a survey response. Pair this with your frustration score to automatically surface sessions where customers struggled most.
![[Visual] session reply 462](http://images.ctfassets.net/gwbpo1m641r7/3Z1nZV1xpxLpQjoBtGAJWt/a8e8056db4d86209c46d23207fe3c25b/session_reply_462.webp?w=1172&q=85&fit=scale&fm=avif)
Watch back exactly how users move through your site.
How to act on CX metrics
Collecting metrics is only valuable if you use them to drive improvement. Here's how to close the loop.
Connect metrics to business outcomes
Every CX improvement should tie back to a business result. When prioritizing what to fix:
Calculate the revenue impact: a 5% improvement in retention might translate to significant revenue gains
Quantify support costs: reducing ART by 20% frees up agent time and reduces cost per ticket
Project CLV changes: improving CSAT at key moments can extend customer relationships
Impact Quantification calculates the revenue and conversion impact of specific issues, helping you prioritize fixes based on business value rather than gut instinct.
Build a continuous improvement process
CX measurement isn't a one-time project. Build an ongoing cycle:
Measure: collect metrics across touchpoints
Analyze: identify patterns and root causes
Prioritize: focus on high-impact opportunities
Act: implement changes
Validate: confirm improvements in your metrics
With Contentsquare's Journey Analysis, you can see customer paths affect conversion and retention, helping you identify which touchpoints have the biggest influence on overall experience—and where improvements will have the greatest impact.
Start tracking CX metrics that drive results
Tracking, evaluating, and improving customer experience metrics is essential if you want more satisfied customers. Start with the metrics that matter most for your business model, combine quantitative scores with qualitative feedback, and build a process for turning insights into action.
Want to know how customers really feel about their experience with your brand? Try Contentsquare and start collecting actionable insight, today!
FAQs about customer experience metrics
Customer experience metrics measure how easy, enjoyable, and useful customers find their experience with your business across the entire customer journey.
Quantitative CX metrics like CSAT and CES let you track customer sentiment numerically so you can see at a glance when your customers are happy and identify areas for improvement when they're not
Qualitative customer data like survey feedback (Ex: responses from open-ended questions and behavior analytics insights like session replays) provide a more detailed view of what's happening behind the metrics and help explain why customers are satisfied or not
![[Visual] Contentsquare's Content Team](http://images.ctfassets.net/gwbpo1m641r7/3IVEUbRzFIoC9mf5EJ2qHY/f25ccd2131dfd63f5c63b5b92cc4ba20/Copy_of_Copy_of_BLOG-icp-8117438.jpeg?w=946&q=85&fit=scale&fm=avif)
![[Guide] [User segmentation] Homepage Cover](http://images.ctfassets.net/gwbpo1m641r7/53sOKQ0v1wuBATrABpN3zA/d7ca98630c3f6267df7a6b9b507eea17/pexels-fauxels-3184639.jpg?w=624&q=85&fit=scale&fm=avif)
![[Visual] Churn prevention - stock image](http://images.ctfassets.net/gwbpo1m641r7/1pt2xn0ppryr3YCMcnF22C/58b89c56360789c3df903a756975a35c/AdobeStock_520992702.png?w=624&q=85&fit=scale&fm=avif)