Trusted by 3,000 enterprise and mid-market brands and 1.3+ million websites

Want to know what’s clicking on your pages?
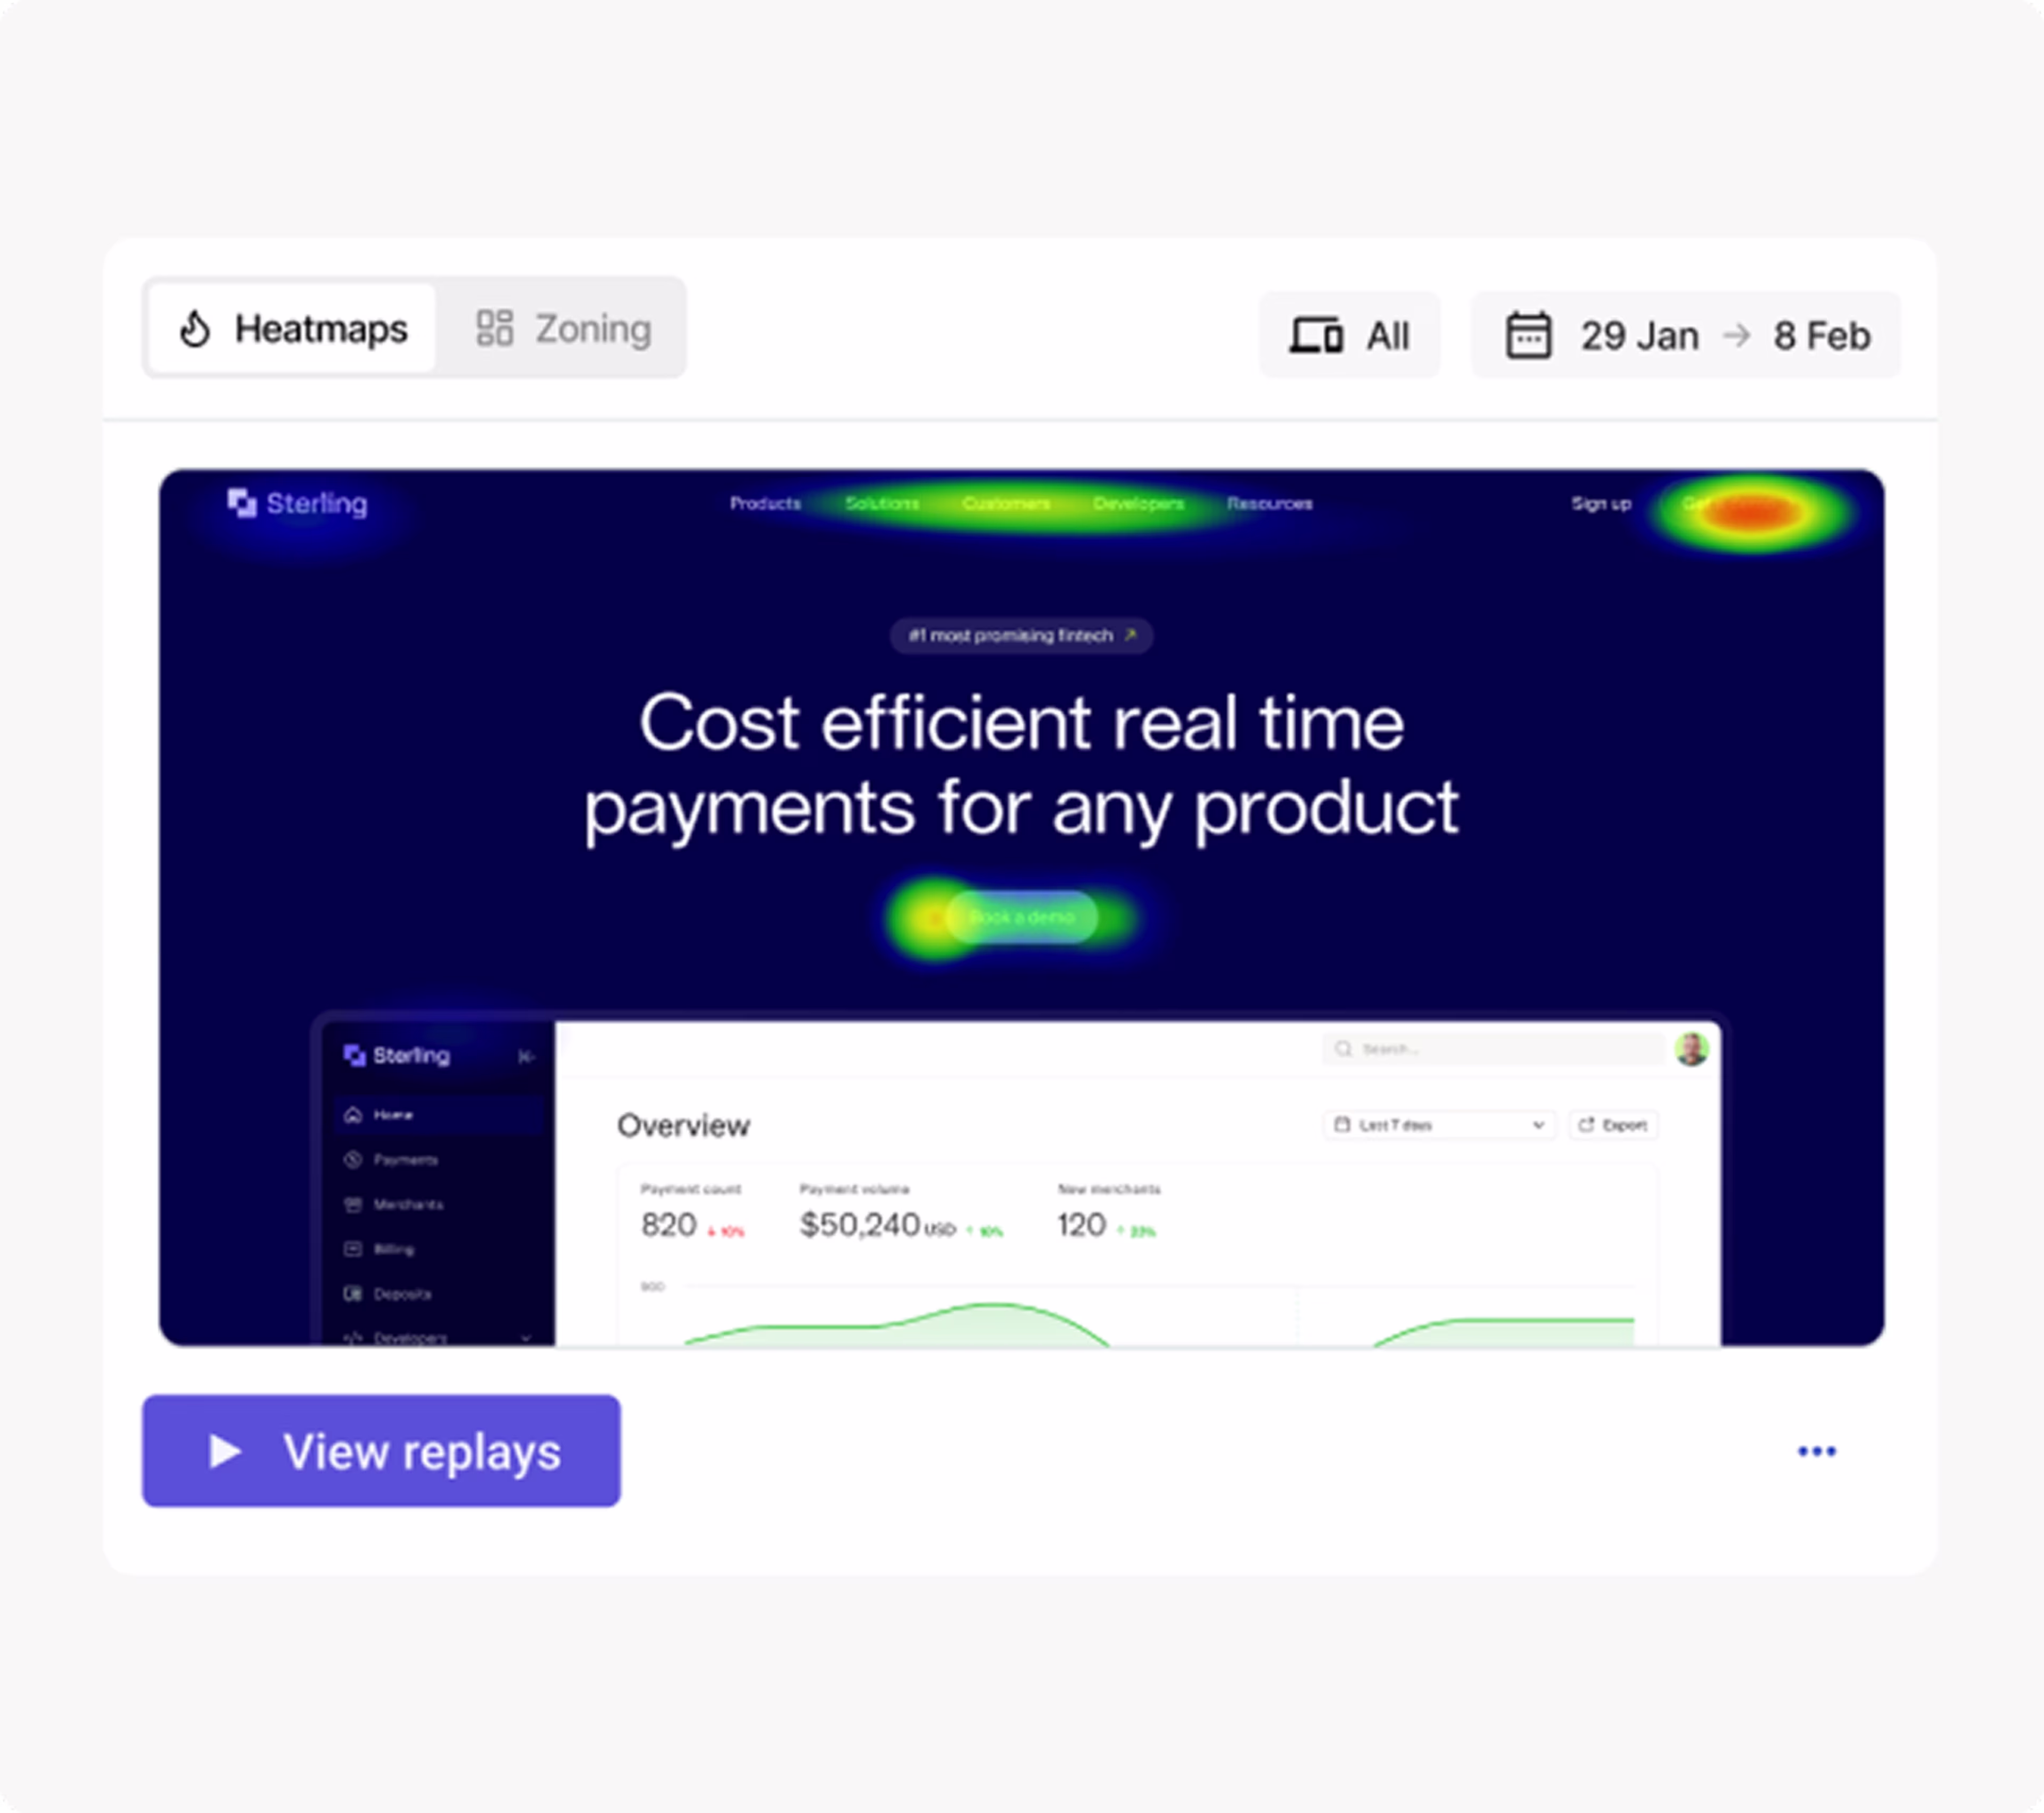
Heatmaps show where on your page users click (or tap on mobile), scroll, and move their mice. See the hottest spots in red and the coldest in blue to get a fast overview of how users interact with the page.
Analyze heatmaps on key pages to figure out what’s working and falling flat. For example, use them to find the average drop-off point on blog posts. Or find out if people are clicking non-clickable page elements in your checkout process.
Measure what matters
Contentsquare’s Zone-based Heatmaps capability reveals how each page element impacts business outcomes, like sales and conversions.
You’ll see where people hesitate, what gets clicked, and which elements are helping— or hurting—your bottom line. You get deeper insights compared to standard heatmaps, and a smarter way to fine-tune your pages.

Get everyone on the same page—literally
When you’re trying to create better customer experiences, your team can’t rely on gut feelings. Instead, use heatmaps to answer questions like:
Why are visitors dropping off here?
Is our call-to-action button getting seen?
What’s actually grabbing attention?
When you find that “aha!” insight, sharing it with colleagues is simple. Send a heatmap with one click and align your team around real data, not hunches.
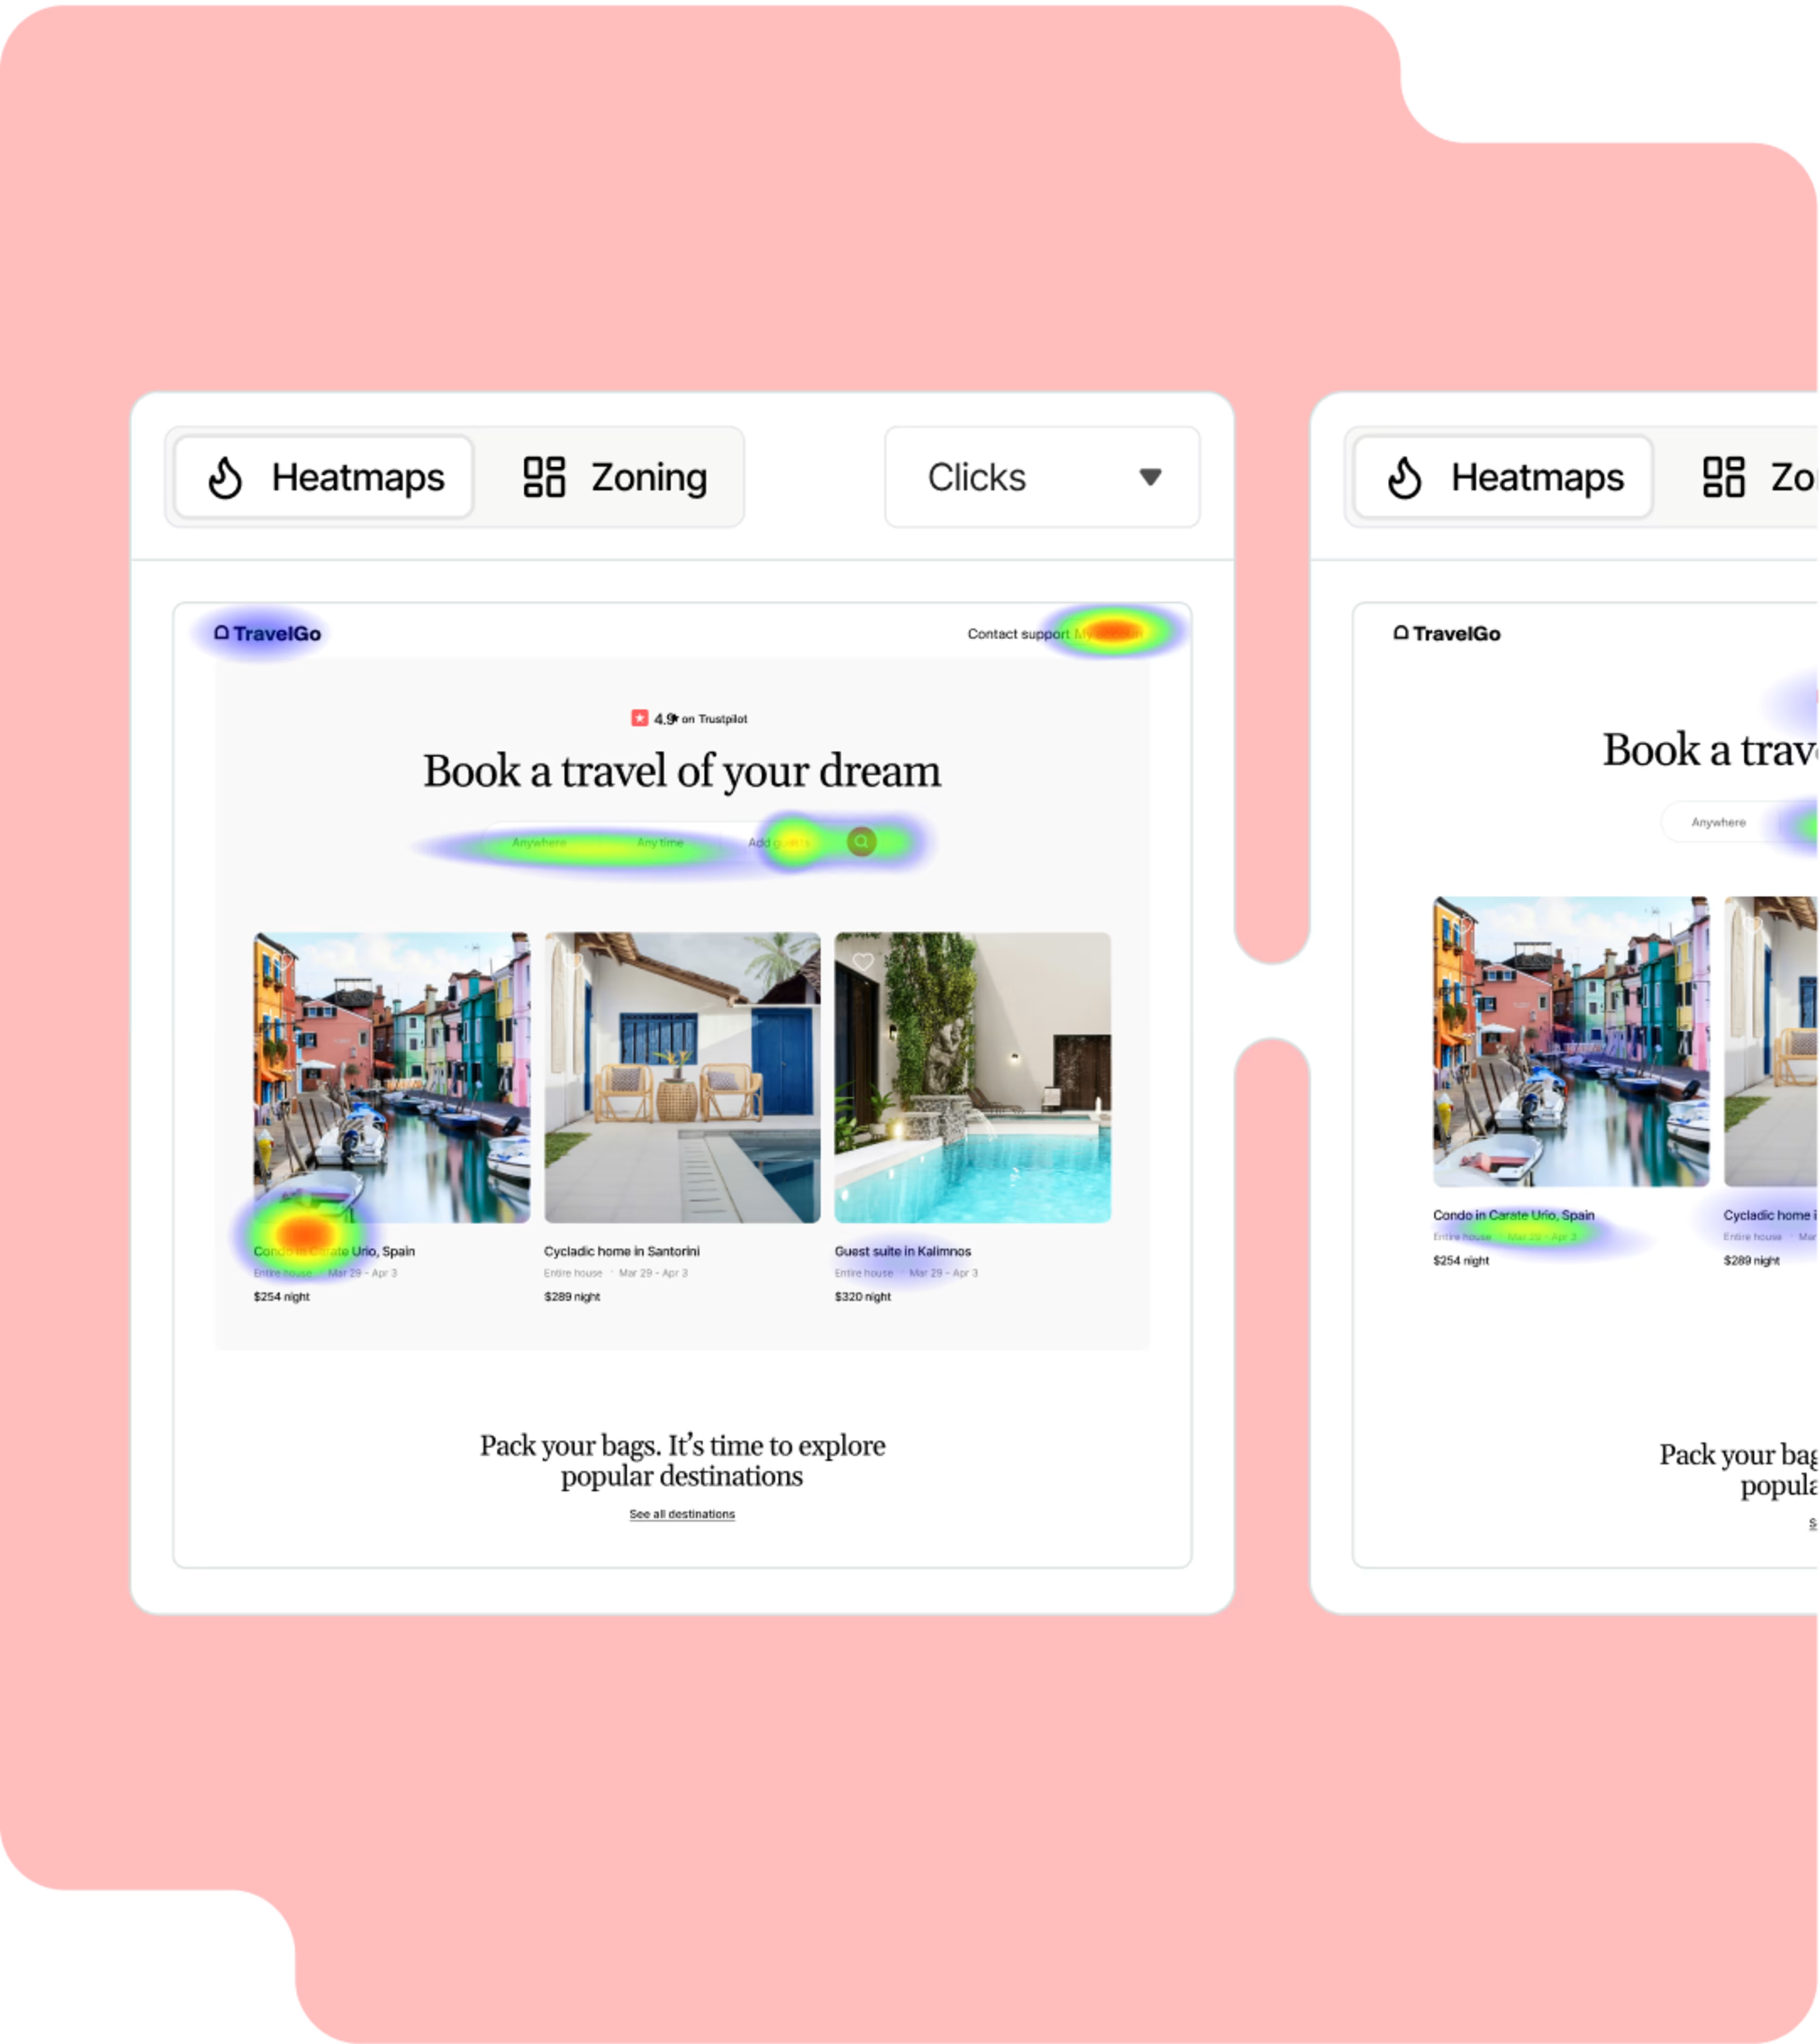
Learn more from A/B tests
Your A/B test metrics tell you which variant won. But wouldn’t it be even better to understand why?
Use Contentsquare’s side-by-side heatmap comparisons to spot what really influenced results—like button placement or image choice. Because sometimes the smallest change makes the biggest impact.
Frequently asked questions
Contentsquare Heatmaps gives you a visualization of what visitors did (as a group) on any page. This lets you see how people have interacted with your pages over time—but not in real time.
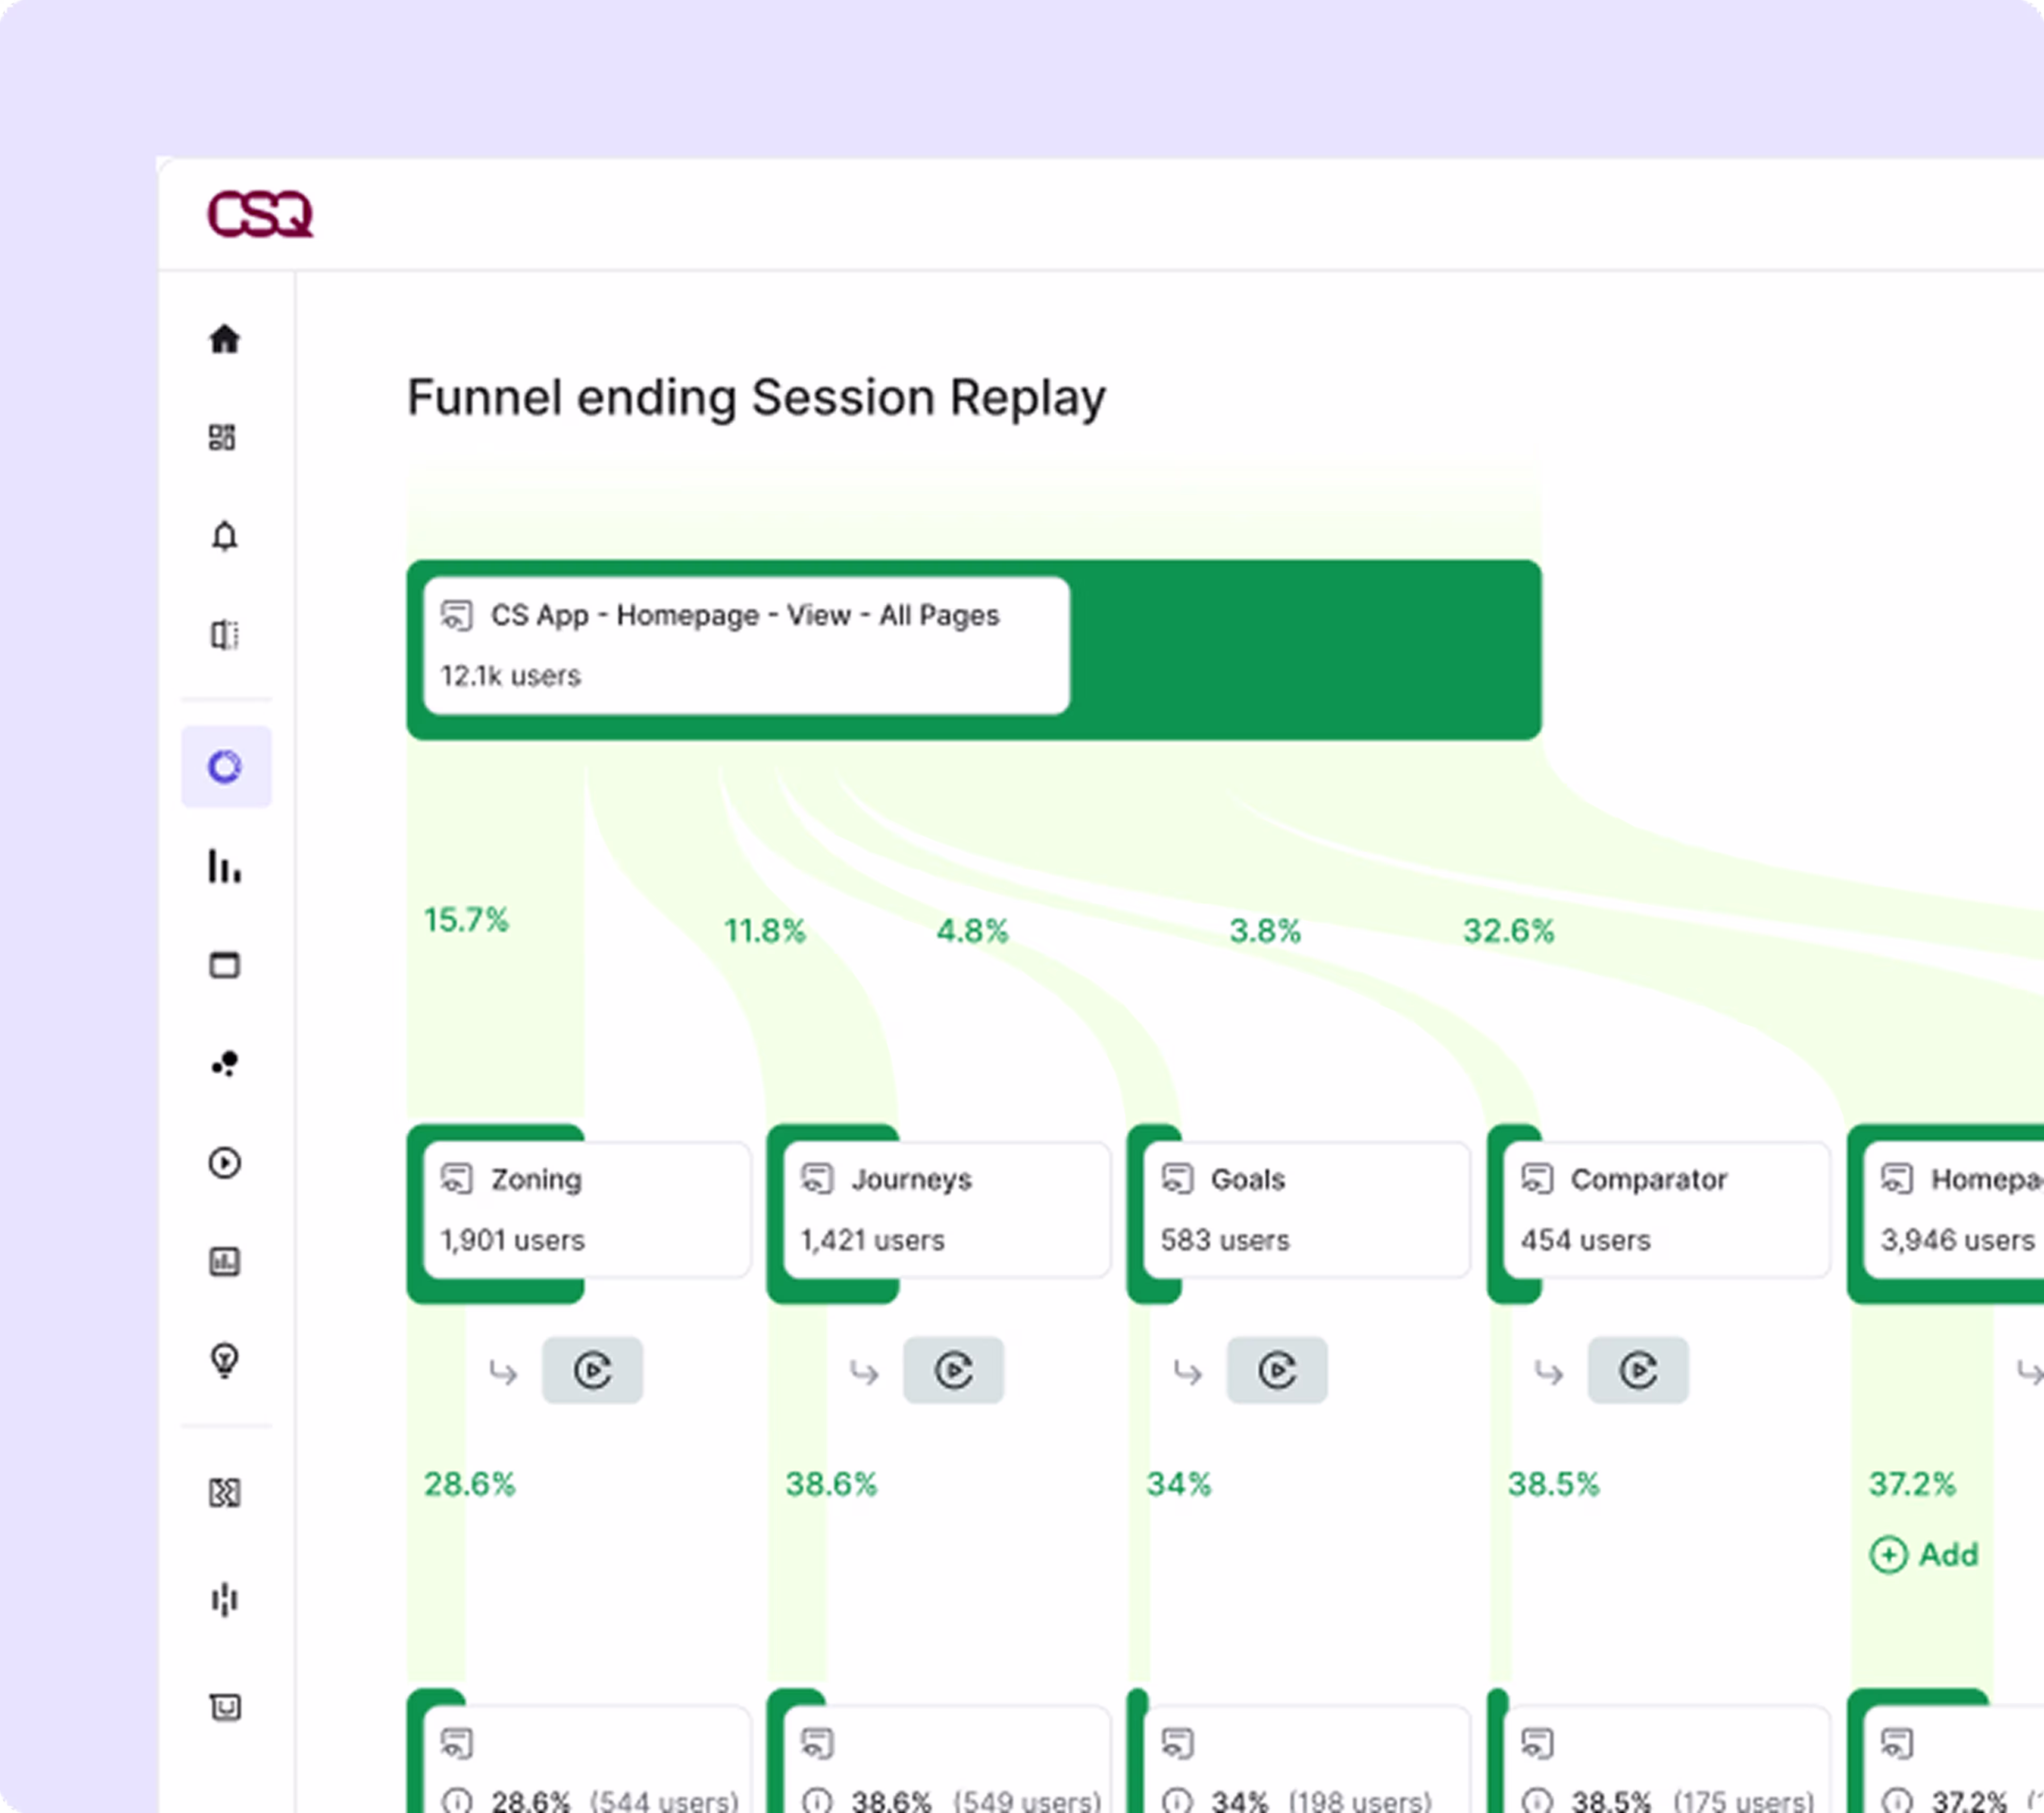
But if you do want to see journeys through your visitors’ eyes, Session Replay has got you covered. Use it to view any individual person’s journey as it happened, including every click, scroll, tap, or mouse movement.