![[Visual] Content marketing home - stock](http://images.ctfassets.net/gwbpo1m641r7/44YRc4qbR13Ihi3Dz9zUfZ/7b2208c5e039b5990d83190eda6903bf/Untitled_design__2_.jpg?w=3840&q=100&fit=fill&fm=avif)
For the travel and hospitality (T&H) industry, a great online experience is now a crucial part of the customer's journey. Travelers expect a lot—smooth, intuitive, and memorable digital interactions—and those expectations are constantly rising.
At Contentsquare, we help you meet these demands by providing the tools and insights you need to understand and optimize your digital experience, making complex concepts simple and bringing value to your efforts.
Key data points on travel and hospitality traffic
Our 2026 Digital Experience Benchmarks report provides a comprehensive look at key trends affecting digital customer experience in the travel & hospitality industry, based on data from over 700+ websites and apps, and 5+ billion anonymized user sessions across 4 sub-industries:
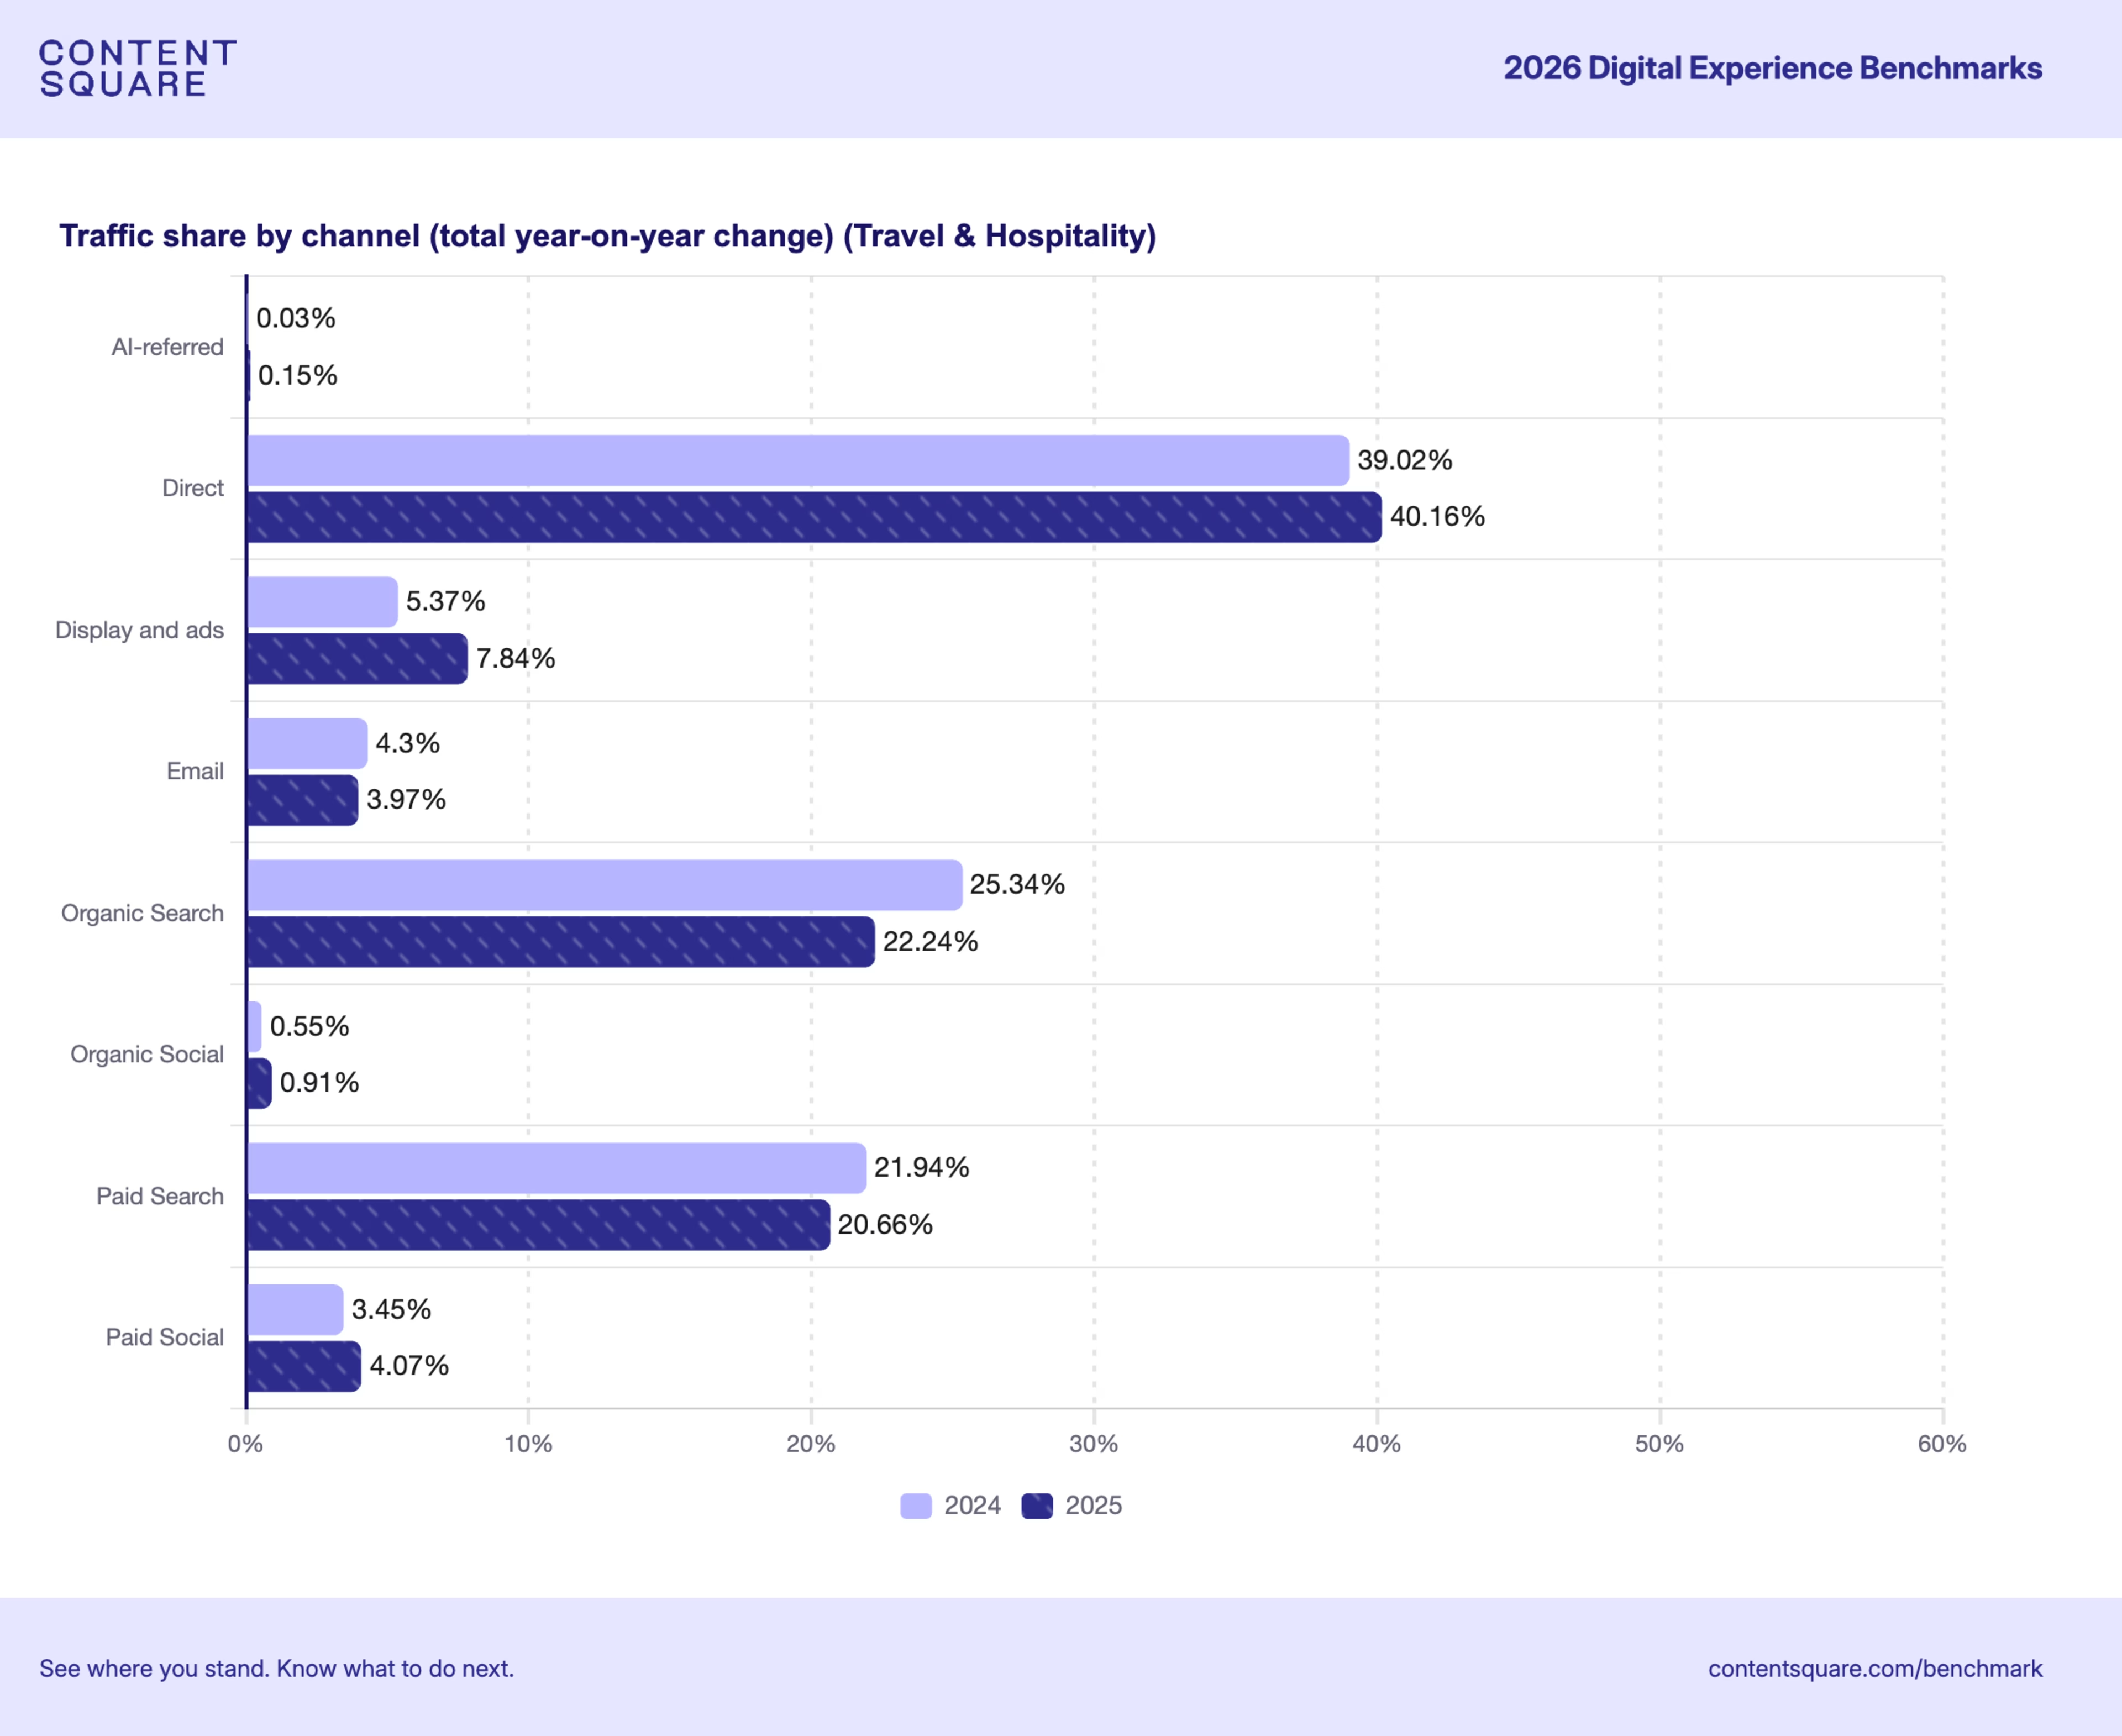
Overall traffic in the travel and hospitality industry is down by -0.6% compared with -3.8% across all industries
Nearly 83% of visits to T&H sites originate from the 3 major channels: direct, organic search, and paid search
However, the channel mix is changing: organic traffic decreased by -3.1% year-on-year. This decline is influenced by algorithm updates, AI-driven discovery (like holiday planning via ChatGPT), and users staying on apps and social media instead of browsing directly on sites.
Brands are compensating for organic losses by investing more in paid channels, which now account for 32.6% of all visits
Paid social saw a modest increase of 0.62% year-on-year (from 3.45% to 4.07%)
Despite this growth, paid social traffic exhibits a high bounce rate of 69.8%
These insights highlight the need for a strategic approach to traffic acquisition, focusing on understanding customer intent and optimizing the experience accordingly.
4 strategies to optimize traffic and maximize ROI
To attract more high-quality traffic to your T&H site, you need to understand where your visitors come from and why they’re there. Our platform helps you make the most of every visit. Keep reading to find out how.
1. Understand your traffic sources
Different traffic sources indicate different user intents. For example, a user arriving from an inspirational Instagram ad might be in an earlier stage of their journey compared to someone landing from an AI-driven search, who is likely further along in their research.
Contentsquare's Acquisition Analysis empowers your marketing teams to understand how various acquisition sources correlate with journey success, allowing you to link traffic directly to engagement and conversion. You can use this to identify which acquisition channels and page views need optimization to increase conversion rates, impacting your return on ad spend (ROAS) and customer acquisition cost (CAC).
For instance, you can use acquisition segments to identify sources with high bounce rates or low engagement, and then adjust your targeting to attract more relevant traffic. This competitive insight helps you determine if and where your acquisition strategy needs to shift, prompting exploration of alternative, high-intent channels.
![[visual] Acquisition analysis shows you which sources drive your most valuable users, not just your highest click rates](http://images.ctfassets.net/gwbpo1m641r7/5E9yUsl3EU6s7kXwPyfn6b/d8825409a0683610e4f7dffb2c9bbee1/Contentsquare-user-lifecycle-aquisition-analysis.png?w=3840&q=100&fit=fill&fm=avif)
The Journey Analysis tool, on the other hand, gives you a comprehensive view of complex booking journeys, helping you visualize the actual paths travelers take from initial inspiration to final booking, so you can identify where and why drop-offs occur.
The tool highlights successful paths, like when visitors browse "Things to Do" pages before booking, and uses reverse journey tracking to reveal what drives conversions. This allows you to spot bottlenecks, segment journeys by traffic source, and compare traveler behavior across devices and seasons, ultimately reducing friction in your booking flows to create seamless journeys that convert browsers into bookers.
![[Visual] Journey analysis on reference mapping](http://images.ctfassets.net/gwbpo1m641r7/30V6WdNQ7xg3mlOFV7DkmY/0e2235977563e2c759fdbd873d51ae59/01-Masthead__1_.png?w=3840&q=100&fit=fill&fm=avif)
🤖 And when it's time to dig deeper, our AI agent, Sense, is ready to help. Sense is a superhero for your data, connecting the dots across all your sources to deliver clear, actionable recommendations in minutes.
It automatically summarizes session replays to highlight exactly where friction points are, so you can diagnose checkout drop-offs. It's also a pro at sniffing out the patterns behind frustrating mobile UX issues like crashes or rage clicks.
2. Identify and fix friction points
Even after you've successfully brought visitors to your site, friction can still cause them to leave early or fail to convert. The travel and hospitality industry, in particular, faces high digital frustration rates. This includes issues like rage clicks, slow page loads, and JavaScript errors. But don't worry, Contentsquare provides several tools to help you smooth out these bumpy rides.
🔁 Session Replay is a great place to start, as it uncovers the precise reasons for drop-offs by showing you exactly what users saw and experienced. This lets you validate issues, accelerate bug resolution, and get all your teams aligned with a single customer view. Our AI-powered session replay summaries quickly reveal key behaviors and user frustrations across sessions.
![[Visual] Session replays AI summaries](http://images.ctfassets.net/gwbpo1m641r7/513RGRBy7acZFtxrrMg1cE/7f6851e3d8f3c4ca804c3e8cde0f847a/Session_replays_summaries.png?w=3840&q=100&fit=fill&fm=avif)
Then, there's Error Analysis, which makes it easy to find JavaScript, API, and custom errors impacting your conversions and revenue. You can jump directly to related session replays to see what users experienced, helping you prioritize fixes and create support tickets with confidence. Plus, our generative AI provides clear, non-technical summaries of these errors, explaining their impact on users and your business so you can focus on what matters most.
![[Visual] Error analysis](http://images.ctfassets.net/gwbpo1m641r7/6ELBPV051gA5ePLDZOiFEG/8352c504a71e140b84d4b0587b2c446c/eyJwYXRoIjoiY29udGVudHNxdWFyZVwvZmlsZVwvZHVGZlF4bWVzMjU0WGhkNXExOXcucG5nIn0_contentsquare_-5dJe5Xqp6vEwH1Gl8wqmZQXmHHT4auNG_.png?w=3840&q=100&fit=fill&fm=avif)
Zone-based Heatmaps helps you visually compare how different visitor segments, like organic vs. paid traffic, interact with key elements like calls to action or promotional banners, so you get a clear understanding of what content and elements are truly engaging your audience.
We also offer Impact Quantification, a capability that lets you validate whether you're getting valuable clicks for your money. By connecting behavioral data to business outcomes, this tool helps you quantify opportunities and issues to prioritize what will generate the most revenue.
To catch customers before they leave, our Voice of Customer (VoC) tools are a game-changer. Our exit-intent surveys do just that, giving you crucial feedback to understand where they're getting stuck. The best part? Our VoC features seamlessly integrate with tools like Session Replay and Heatmaps, connecting what users say with what they do. You can even whip up a new survey in seconds with our AI-powered survey generator.
![[Visual] AI survey > survey goal](http://images.ctfassets.net/gwbpo1m641r7/2YHLhJlL1JQqhMWO0gMYyr/d8003cbda13fd6bf1932a1f98ae7aa8f/VoC_-_Create_a_survey_with_AI.png?w=1920&q=100&fit=fill&fm=avif)
Finally, since many travel sites struggle with performance, monitoring Core Web Vitals is crucial. Contentsquare integrates these metrics to analyze website performance and their direct impact on user experience and business outcomes. Our Speed Analysis (Real User Monitoring) tool tracks the Web Vitals of real users, giving you an accurate picture of site performance.

3. Optimizing the user journey
Once you understand your traffic and identify friction, the next step is to guide visitors smoothly through their journey on your site.
That’s why personalization is key. You need to visualize engagement across multiple sessions and identify elements users interact with most, allowing for smarter personalization of return journeys.
Dynamic CTAs and personalized homepages can draw users in by creating tailored experiences. Heatmaps can then verify if these elements are effective.
![[Visual] Heatmaps types](http://images.ctfassets.net/gwbpo1m641r7/44qPX6Nyu2v2i9pGM8JdIE/e1ccfd573959295483bb4b867ca7e57f/Heatmaps___Engagements__3_.png?w=2048&q=100&fit=fill&fm=avif)
Streamlining checkout is vital. Consider adding progress indicators, auto-fill, and one-click payment options to simplify the process. For instance, AccorHotels boosted bookings by 15% after clarifying breakfast inclusion on their reservation page, a simple change identified through session replays and zone-based heatmaps. Forge Holiday Group also increased booking completion by 5.3% by fixing a leaky checkout, using A/B tests and heatmaps to identify and address friction.
Contentsquare's Headlines feature on the homepage provides a clear overview of recent site activity and offers guidance for future actions, helping you stay ahead of performance changes.
These headlines are triggered by significant variations in metrics like conversion rate, bounce rate, and frustration score.
![[Visual] session-conversion-bounce-rates](http://images.ctfassets.net/gwbpo1m641r7/nNI2BHnYx3gqDFhCRBXJa/c6d167f63ffd10449f021c869a80f375/-Visual-_ession-conversion-bounce-rates.jpg?w=1920&q=100&fit=fill&fm=avif)
4. Leverage data integration for deeper insights
To truly optimize traffic and deliver exceptional digital journeys, integrate your data for a holistic view.
Contentsquare's Data Connect allows you to automatically export behavioral, performance, and error data directly to your data warehouse. This enables you to combine Contentsquare insights with other data sources, transforming insights into action for optimizing journeys, predicting churn, and personalizing experiences without manual data wrangling.
Data Connect fuels AI and machine learning models for churn prediction and anomaly detection, leveraging your Contentsquare data. It provides self-serve access, ensuring data quality, and helps democratize insights across teams.
⚡️Real-world impact: Royal Caribbean’s success
Royal Caribbean, a leader in cruise innovation, wanted to increase bookings on its website and mobile app, reducing reliance on costly travel agencies. However, slow page loads and friction in the booking process were getting in the way of a smooth customer experience.
Senior Product Manager Jessica Dewing and her team turned to Contentsquare to tackle the problem. She spearheaded an initiative to get her colleagues to use the platform beyond basic analytics, proving that it could provide the insights they needed to make data-driven decisions.
The team started by analyzing their mobile checkout process and discovered an unexpected issue. They had introduced an autofill feature for logged-in customers, but it was actually causing conversion rates to drop, especially on mobile. Using Contentsquare's Heatmaps, they uncovered the problem: the log-in banner was taking up too much screen space, pushing critical form fields out of view.
With this insight, Jessica's team redesigned the banner, making it much smaller and less intrusive. They then ran an A/B test, and the results were clear: the optimized banner led to a 4% increase in mobile conversion rates.
![[Visual] Royal Caribbean 4percent](http://images.ctfassets.net/gwbpo1m641r7/ebv8p15KWjxg4dHObwJ1T/468530726f5c0a09a88af796642fae25/royal_Caribbean_4percent.jpg?w=1920&q=100&fit=fill&fm=avif)
By making these data-driven changes, Royal Caribbean not only improved their mobile checkout process and reduced bounce rates but also enhanced the overall user experience. This success story proves the power of using behavioral data to identify and fix friction points, leading to a more seamless journey for every customer.
As Jessica Dewing, Senior Product Manager at Royal Caribbean, explains, the company's success with Contentsquare wasn't just about having the right tools, but about using them effectively:
I was thrilled to find out that Royal Caribbean had Contentsquare because, honestly, I can't do my job effectively without it—at least not at the level I was used to. But when I got there, I quickly realized that no one [in product] was really using the platform. They saw it as just an analytics tool. I had to explain that its purpose is to allow non-analysts to use data to make decisions.
Moving forward with Contentsquare
Creating better digital experiences is an ongoing process that involves attracting the right traffic, keeping visitors engaged, reducing frustration, boosting conversions, and retaining loyal customers. With Contentsquare's all-in-one experience intelligence platform, you can deepen your understanding of digitally inclined travelers and refine your website experience.
![[Visual] Contentsquare's Content Team](http://images.ctfassets.net/gwbpo1m641r7/3IVEUbRzFIoC9mf5EJ2qHY/f25ccd2131dfd63f5c63b5b92cc4ba20/Copy_of_Copy_of_BLOG-icp-8117438.jpeg?w=1920&q=100&fit=fill&fm=avif)