![[Stock] CRO Cart abondoment Stock photo](http://images.ctfassets.net/gwbpo1m641r7/7fFJ2IkPNULSfMm7GJ3Gwu/c2d807aa55f9593f17d4c65d13be31f4/5961638.jpg?w=3840&q=100&fit=fill&fm=avif)
For the travel & hospitality (T&H) industry, a great online experience is no longer a luxury; it's a crucial part of the customer's journey. Travelers today expect smooth, intuitive, and memorable digital interactions, and those expectations are constantly rising.
At Contentsquare, we're here to help you meet these expectations. We provide the tools and insights you need to understand and optimize your digital experience, turning complex customer data into clear insights.
Key frustration data points in Travel & Hospitality
Our 2026 Digital Experience Benchmark report offers a comprehensive look at key trends affecting the digital customer experience in the T&H industry. Here’s what we found regarding user frustration:
Overall frustration in T&H is on the rise (+7.6% YoY), driven largely by a surge in technical errors — API error rates (+20.6%) and Javascript errors (+20.0%) — as well as multiple button clicks (+14.3%) and rage clicks (+7.4%). The one bright spot: slow page loads improved significantly (-10.6%), suggesting progress on performance
T&H has the highest rage click rate across all industries, reaching 2.4% per page — significantly above sectors like Media (1.9%), Manufacturing (1.4%), and the lower end of the spectrum such as Retail (1.0%) and Software (0.8%)
Rage clicks have a direct impact on engagement in T&H: visitors experiencing the least rage clicks view nearly twice as many pages (6.5) compared to those with the most rage (3.4), highlighting how frustration significantly cuts short the browsing journey
Nearly 4 in 10 T&H sessions involve at least one frustration signal (38%), with Javascript errors (14.5%), slow page loads (12.3%), and rage clicks (10.1%) being the top contributors — pointing to both technical performance issues and unmet user expectations as the primary drivers of friction.
These insights underscore the importance of understanding and addressing every point of friction to create seamless journeys for your customers.
![[Image] T&H benchmarks > Frustration](http://images.ctfassets.net/gwbpo1m641r7/67VU9jVGXoLXhp7rofio3/19098231ea0aedc2c874c1c6844e1c0d/contentsquare__frustration-factor-change_travel--hospitality.png?w=3840&q=100&fit=fill&fm=avif)
How Contentsquare helps you smooth out friction
You can't fix frustration if you don't know its source. Our platform equips you with the tools and techniques to uncover issues quickly and act with confidence.
Surface frustration points fast
Our experience intelligence platform helps you pinpoint where users are getting stuck so you can focus on what's truly hurting your user experience and conversion rates.
For example, our frustration score feature immediately tells you the level of difficulty a user encounters on a page or during their entire session. This AI-powered metric automatically detects and quantifies user frustration signals, such as rage clicks, excessive scrolling, or slow page loads, and combines them into a single, easy-to-understand score from 0-100. The higher the score, the more frustration your customer is experiencing.
Instead of searching through hundreds of sessions to find problematic experiences, the frustration score acts as a filter, surfacing the most critical points of friction so you can prioritize and fix issues fast.
This is particularly powerful when assessing high-traffic pages or whether your user experience (UX) improvements are actually reducing user frustration over time.
For teams managing multiple websites or large volumes of traffic, our frustration score becomes an essential triage tool that helps allocate resources where UX improvements will have the greatest impact.
![[Visual] CSQ-Frustration-Score](http://images.ctfassets.net/gwbpo1m641r7/42XUbRA4QZNcWpukMpln1m/44c3ab68cd5de383e3811680e94bd8a5/CSQ-Frustration-Score.png?w=3840&q=100&fit=fill&fm=avif)
Need help with anything?
Our AI agent Sense is a superhero for your data. It goes beyond analysis, providing clear steps for immediate impact. Sense ensures you're only seeing issues that truly frustrate users, not just random errors, and connects the dots across multiple user visits to reveal recurring problems in the customer journey.
Additionally, AI-Powered Session Replay Summaries automatically create easy-to-read summaries of user sessions, so your team can understand key issues in minutes instead of hours, helping you get to the root of the problem fast.
Curious about Sense AI? Watch this video for a deeper dive
Our Headlines feature automatically provides a clear overview of recent site activity on your homepage. These headlines are triggered by significant changes in key metrics such as frustration score, as well as conversion rate, or bounce rate, guiding you where to focus your attention next. They even offer root cause suggestions and recommendations for next steps.
Catch errors harming your conversions
Technical glitches and errors are particularly devastating in the Travel & Hospitality industry, where complex booking processes and high-stakes transactions make every technical failure a potential lost customer. Our platform helps travel brands see what's happening behind the scenes and quantify the business impact.
For example, our Error Analysis capability automatically detects, categorizes, and prioritizes JavaScript, API, and custom errors based on their business impact, rather than just technical severity.
![[Visual] Error analysis](http://images.ctfassets.net/gwbpo1m641r7/6ELBPV051gA5ePLDZOiFEG/8352c504a71e140b84d4b0587b2c446c/eyJwYXRoIjoiY29udGVudHNxdWFyZVwvZmlsZVwvZHVGZlF4bWVzMjU0WGhkNXExOXcucG5nIn0_contentsquare_-5dJe5Xqp6vEwH1Gl8wqmZQXmHHT4auNG_.png?w=3840&q=100&fit=fill&fm=avif)
You can jump directly from an error report to related sessions to put yourself in your customer's shoes and watch precisely how they experience your site or app. Our Session Replay capability lets you see exactly what your customer experienced during their session, from mouse movements through to page swipes. You can jump straight from Session Replays into other capabilities to better understand the root cause of an issue, whether it's a technical error, a sign of frustration, or a design flaw.
While Session Replay shows you individual user journeys, our Heatmaps capability looks at user behavior at page level, revealing where users collectively click, scroll, and move their mouse, helping you identify broader trends and problem areas.
![[Visual] Heatmaps types](http://images.ctfassets.net/gwbpo1m641r7/44qPX6Nyu2v2i9pGM8JdIE/e1ccfd573959295483bb4b867ca7e57f/Heatmaps___Engagements__3_.png?w=2048&q=100&fit=fill&fm=avif)
You can segment our Heatmaps capability into different categories. Click heatmaps let you see where users are trying to interact (including non-clickable elements that cause frustration). Scroll heatmaps reveal how far users get down a page before dropping off, and move heatmaps indicate where attention is focused.
Zone-based heatmaps go beyond traditional click tracking to show how each page element contributes to conversions and revenue, making it easy to prioritize optimizations based on business impact.
You can seamlessly jump from Heatmap insights to related session replays to see the individual user experience behind the patterns, creating a complete picture of both the ‘what’ and the ‘why’ of user behavior.
For critical issues, our real-time AI Alerts capability notifies you when significant anomalies occur, using automatic AI thresholds that intelligently adapt to your site's past trends and seasonality, helping you filter out noise and focus on what truly needs immediate action.
⚡️Success story: how Royal Caribbean boosted mobile conversions using Contentsquare insights
Leading cruise line Royal Caribbean International faced a challenge familiar to many in T&H: to empower customers to book online to reduce the reliance on travel agencies. However, friction in their mobile checkout process was causing issues.
Senior Product Manager Jessica Dewing and her team turned to Contentsquare to tackle the problem head-on. Using Heatmaps, they discovered an autofill feature meant to speed things up was actually hurting conversions. A bulky log-in banner was pushing critical form fields out of view, especially on mobile devices.
Armed with this insight, Jessica's team redesigned the banner to be smaller and less intrusive, which led to a +4% increase in mobile conversion rates. This data-driven change not only improved their mobile checkout process but also significantly enhanced the overall user experience.
Read the full case study here.
Monitor your site's performance
Slow websites are frustrating, and in T&H, every second of delay can cost you a booking. Contentsquare integrates Google’s Core Web Vitals to analyze site performance and its direct impact on user experience and business outcomes—crucial for an industry where customers are actively comparing multiple options and will quickly abandon slow-loading sites.
For travel brands, site speed directly impacts revenue. Our Speed Analysis capability leverages real user monitoring (RUM) to track site performance data on real users across different devices and connection speeds—crucial when customers book on mobile devices with varying network conditions.
Speed Analysis is particularly vital for travel booking flows, where complex multi-step processes like flight selection, hotel comparison, and payment processing, are especially vulnerable to performance issues. Slow load times during these critical booking moments can cause travelers to abandon their purchase and book with competitors instead.
Hear directly from your customers
Our Voice of Customer (VoC) product is a game-changer for capturing valuable feedback. Use the product’s AI-powered Surveys capability to create surveys in seconds and collect responses within minutes. Then, use AI-powered summary reports, sentiment analysis, and automated tags to quickly analyze open-text responses, saving you hours of manual work.
![[Visual] NPS 72](http://images.ctfassets.net/gwbpo1m641r7/3dJgRt2xeBZkkzd9KuIARp/4922fd68538b55e540cb8ff54bf98c25/NPS_72.jpg?w=1920&q=100&fit=fill&fm=avif)
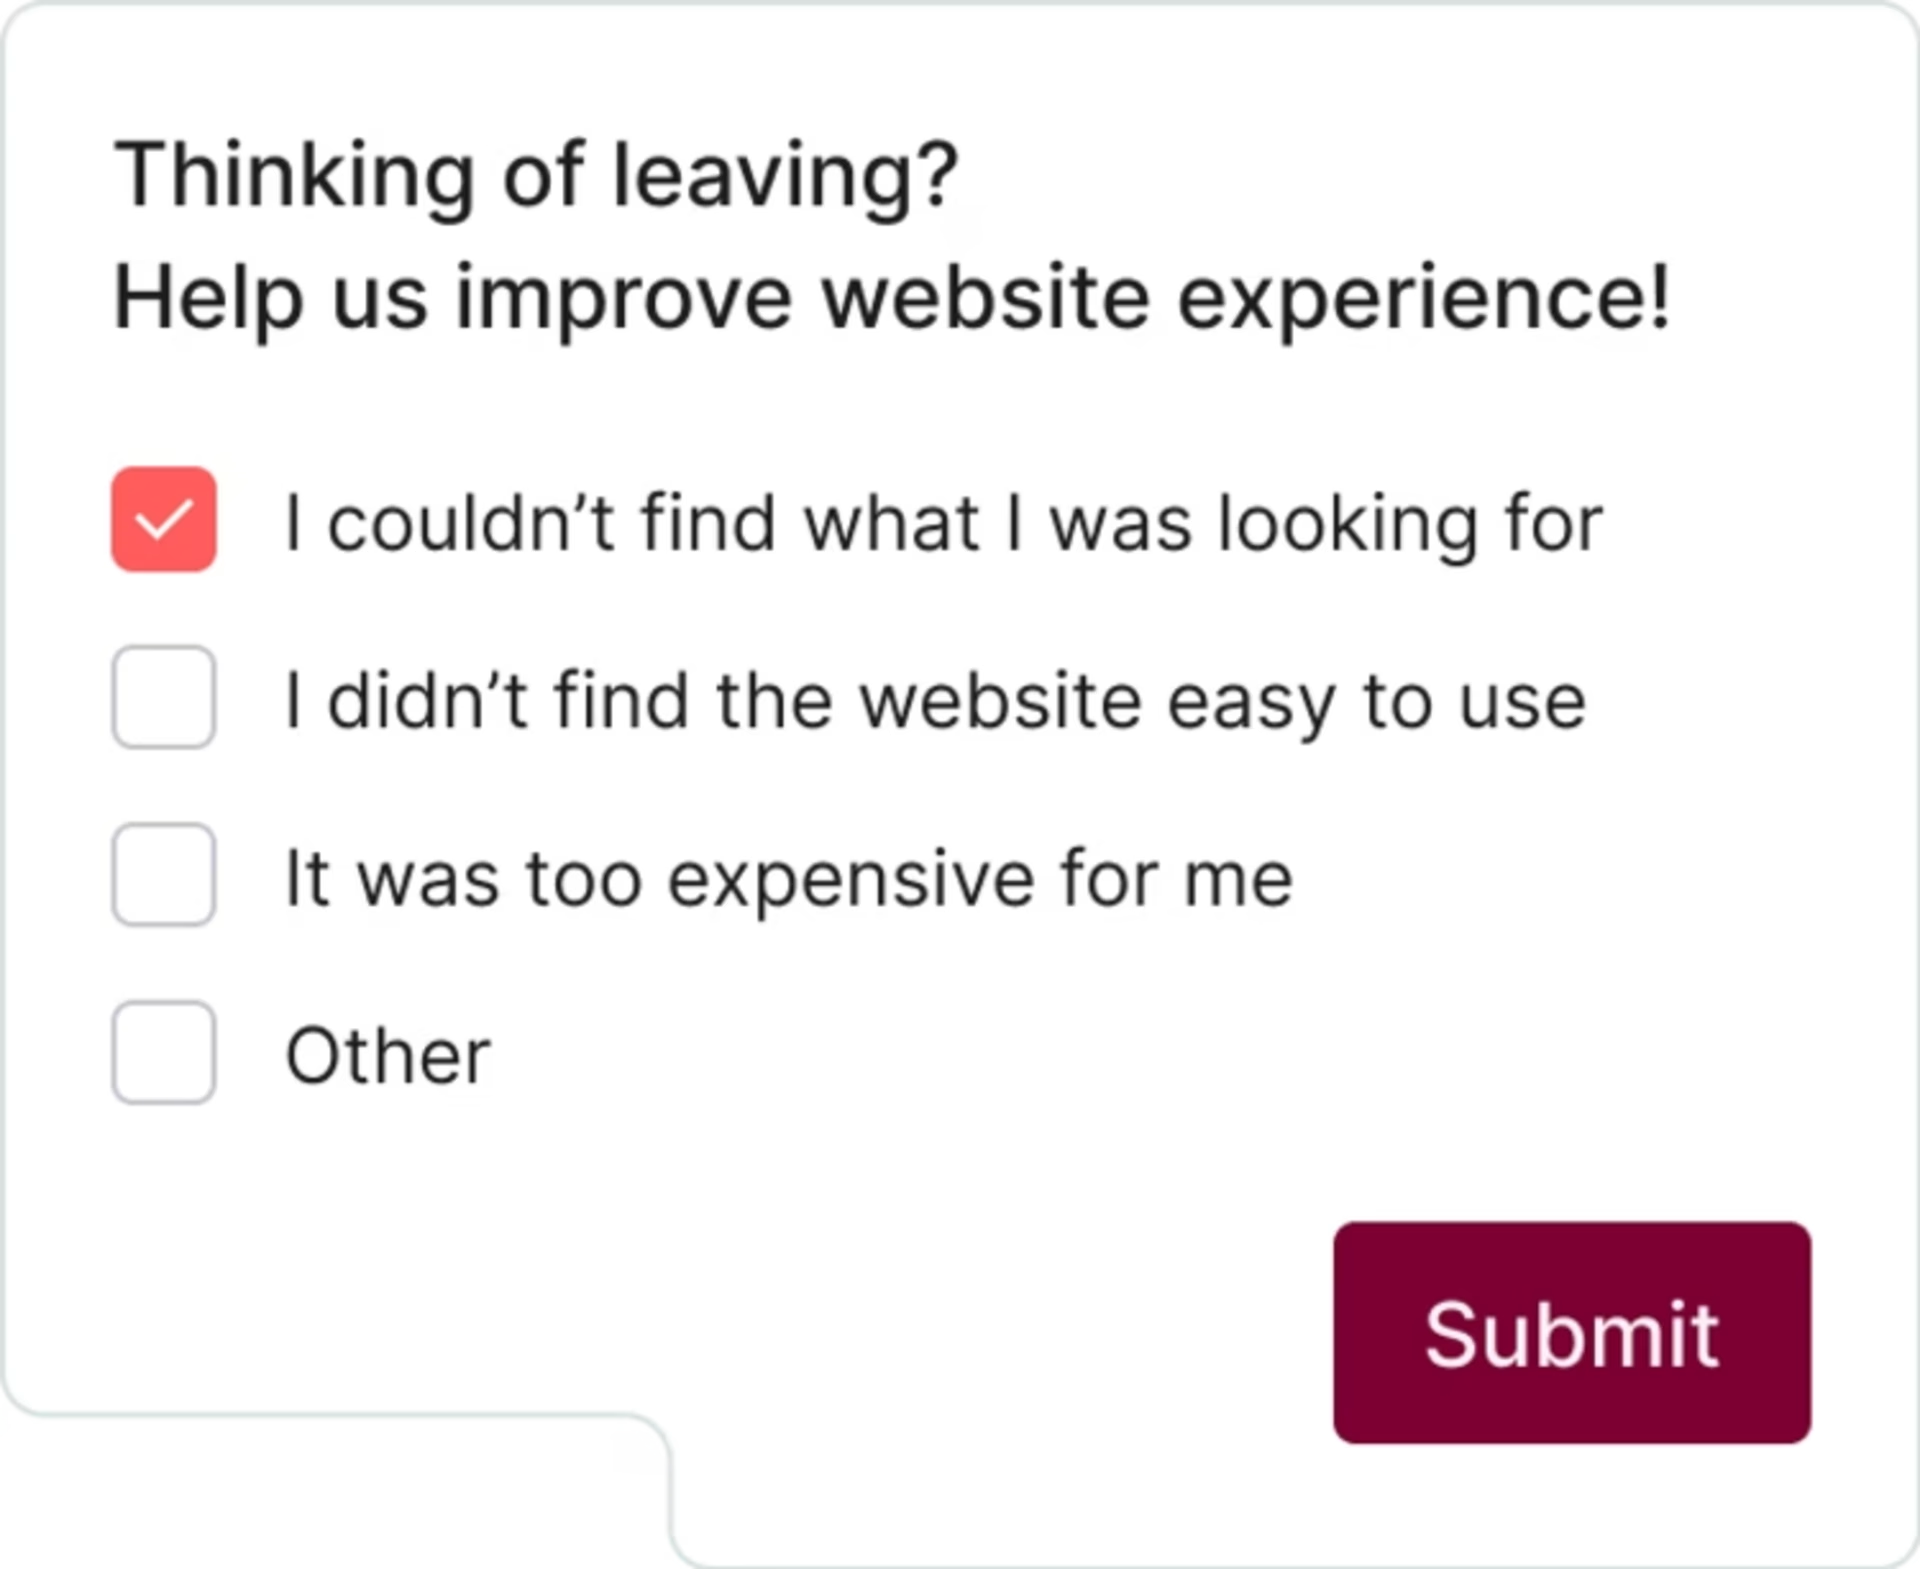
In the travel and hospitality industry, VoC tools are particularly powerful for capturing feedback at critical booking moments when travelers are most likely to abandon their purchase due to complex multi-step processes, pricing concerns, or technical issues. Use our exit-intent surveys to reveal why customers are leaving at critical points, such as during a flight selection, hotel booking, or payment stages to gain insights that traditional analytics miss.
Move forward, friction-free
Creating better digital experiences is an ongoing process that involves not only attracting the right traffic, but also keeping visitors engaged, frustration-free, and loyal to help boost conversions.
With our all-in-one experience intelligence platform, you can deepen your understanding of digitally inclined travelers and continuously refine your website experience.
Our AI-powered insights provide those ‘aha’ moments you need to deliver the right experiences, helping you work faster and smarter to improve your digital presence.
![[Visual] Contentsquare's Content Team](http://images.ctfassets.net/gwbpo1m641r7/3IVEUbRzFIoC9mf5EJ2qHY/f25ccd2131dfd63f5c63b5b92cc4ba20/Copy_of_Copy_of_BLOG-icp-8117438.jpeg?w=1920&q=100&fit=fill&fm=avif)