![[Visual] Website metrics stock](http://images.ctfassets.net/gwbpo1m641r7/5MIcS2nwtCpFlpmcyyEDUv/8f7d4973395834424161ad428ebbdf7c/Untitled_design__1_.jpg?w=3840&q=100&fit=fill&fm=avif)
With declining overall traffic and rising acquisition costs, maximizing the value of every single retail visit has become more critical than ever.
This guide delves into the current retail traffic landscape and outlines actionable strategies for using Contentsquare's comprehensive platform to enhance acquisition efforts and improve return on investment.
Key data points on the current traffic landscape for retail sites
The retail sector experienced a challenging year regarding website traffic. According to Contentsquare’s Benchmark report:
Overall traffic to retail sites dropped by 2.6% in 2025. This suggests relatively stable demand despite broad acquisition pressure
Specific industries saw even steeper declines, with home goods & furnishings traffic down by -5.8% and outdoors & sporting goods by -5.6%
Consumer electronics traffic increased by 1% and department & big box rose by 1.8%
Organic search fell by -4% while paid search declined by -2.5%, a sign that traditional discovery is under pressure as more consideration happens offsite
At the same time, paid social keeps gaining ground. It now drives 13% of retail traffic, up +18% year over year
77% of traffic to retail sites came from mobile devices, desktop accounting for 23% only
New and returning users amounted to the same proportion of traffic on retail sites, at 49.2% and 50.8% respectively
50.6% of traffic is paid and 49.4% is unpaid
![[Image] Benchmark retail traffic](http://images.ctfassets.net/gwbpo1m641r7/BeYeos8jHkNqzVbNmCx1E/5164f729cd9e561342a6320ead7c977d/image.png?w=2048&q=100&fit=fill&fm=avif)
3 strategies for boosting traffic and maximizing ROI
With acquisition costs on the rise, you need to make the most of every visit by engaging customers and preventing frustration from the moment they land on your site. We’ll show you how Contentsquare, an experience intelligence platform, addresses these challenges across the customer journey.
1. Deep dive into customer acquisition channels
It is crucial to understand where your customers are coming from and how each acquisition channel influences their subsequent journey, including whether they add items to their basket or complete a checkout.
Leverage Contentsquare's Journey Analysis and Acquisition Analysis
These powerful capabilities allow marketing teams to see which channels drive users to their site and, more importantly, how that channel impacts what happens next in their journey. By analyzing these insights, you can direct your efforts and budget towards traffic sources that deliver the most value and have a higher correlation with journey success, directly impacting your Return on Ad Spend (ROAS) and Customer Acquisition Cost (CAC).
![[Visual] acquisition-analysis](http://images.ctfassets.net/gwbpo1m641r7/12HAt7kCh8dBN8YH7Ng2NQ/cf28a76c809ac2e5d979a1402dfd0970/acquisition-analysis.png?w=3840&q=100&fit=fill&fm=avif)
Acquisition Analysis in Experience Analytics lets you identify where your traffic comes from and how each acquisition channel performs against key session metrics.
Curious to see how your users navigate your retail site? That’s where Journey Analysis comes in. Identify your users’ journey, where they dropped off, where they converted, and more.
🤖 Need help with the analysis? Simply chat with Contentsquare’s AI agent Sense in natural language. For instance, you could ask Sense to analyze the path of paid users specifically, or to compare the paths of users coming via organic traffic vs emails.
![[Visual] Journey analysis chat with sense](http://images.ctfassets.net/gwbpo1m641r7/6YNHotl47smcAth67LaC0I/e581cde99764a2de42248c1fbc6c5415/Journey-analysis-chat-with-sense.png?w=3840&q=100&fit=fill&fm=avif)
Rethink your acquisition mix
Given the disruption in search behavior caused by AI-powered tools like ChatGPT and Perplexity, earning and tracking organic traffic is becoming more challenging.
Contentsquare's Benchmarks allows you to compare the performance of your traffic channels against your competitors. This competitive insight helps you identify if and where your acquisition strategy needs to shift, prompting exploration of alternative, high-intent channels like industry media networks or app-based platforms.
![[Product screenshot] Benchmark feature in CSQ platform](http://images.ctfassets.net/gwbpo1m641r7/1NsHvbMjkFAkgVWfr4n11x/0fe14034f7e4f22222f2e63830e35b2f/-Product_screenshot-_Benchmark_feature_in_CSQ_platform.png?w=3840&q=100&fit=fill&fm=avif)
Compare your traffic distribution to that of your competitors to get insights on where to shift your priorities.
2. Optimize for multi-session and cross-device journeys
Today's shopper journey often spans multiple devices and sessions. A customer might discover a product on social media, visit your website on mobile, leave, and then return later on a desktop to complete the purchase. To accurately measure and optimize this complex journey:
Unify traffic data with Product Analytics and Experience Analytics
Contentsquare enables you to link product analytics and web analytics to unify traffic data across multi-session journeys and different channels, devices, and digital properties.
Product Analytics by Contentsquare powered by Heap, provides a broad understanding of user behavior over time, answering "what," "who," and "when" users interact across multiple sessions and devices, from traffic acquisition to customer retention. It allows you to analyze how many sessions users need before converting, which is crucial for high-consideration purchases.
For example, the Users module in Product Analytics allows for in-depth analysis of individual users, including their demographics and activity patterns over time and across devices. You can build and leverage segments to understand user behavior and increase Customer Lifetime Value (CLV).
![[Product screenshot] Product Analytics (PA) – Heap – Users module](http://images.ctfassets.net/gwbpo1m641r7/iXLfJ3ir9kRqvAxALg7gl/15c34258bf8442d4aa2b930190f87938/-Product_screenshot-_Product_Analytics__PA__â___Heap_â___Users_module.png?w=3840&q=100&fit=fill&fm=avif)
Experience Analytics complements Product Analytics by identifying in-session friction and the depth of engagement within individual sessions, explaining "why" issues are happening and "how" to fix them with capabilities like Heatmaps and Session Replay.
Or, you could segment your traffic to focus on your high-conversion audience instead, and look for patterns. With Zoning in Heatmaps, you may realize that visitors who interact with a quick filter carousel on your top-performing product detail page (PDP) bounce and exit less, and convert more than those who didn’t. With that insight in mind, you could add a quick filter carousel to your ‘Flash Sale’ page and measure the results.
![[Product screenshot] Zoning Analysis : Zone-based heatmap – revenue per click retail –CSQ platform](http://images.ctfassets.net/gwbpo1m641r7/7DUXOfRgoSobw4rovnZ3wJ/c007a54ff7068465fddfb8e6692fbe15/-Product_screenshot-_Zoning_Analysis___Zone-based_heatmap_â___revenue_per_click_retail_â__CSQ_platform.png?w=3840&q=100&fit=fill&fm=avif)
💡 Wondering how valuable your traffic is over time? Contentsquare's Zoning and Page Comparator modules include "Average lifetime revenue per user," "Multi-session purchase rate," and "User retention" metrics, helping you identify which pages or elements drive loyal, returning customers who generate higher long-term value.
Together, Product Analytics and Experience Analytics offer a 360-degree view of your customers, providing both breadth (lifetime value, cross-device, multi-channel journeys) and depth (rich behavioral and contextual in-session data).
Leverage Data Connect for comprehensive insights
Contentsquare's Data Connect solution automatically exports behavioral, performance, and error data directly to your data warehouse.
This allows you to blend Contentsquare insights with data from other tools, enabling a holistic view of user behavior and business impact without manual data wrangling.
This seamless integration helps marketing teams generate smarter retargeting, personalization, and A/B test insights. Its retroactive sync ensures you have historical data even if goals or events are defined later.
3. Set up performance tracking proactively to anticipate peak season
Traffic surges during peak seasons can overwhelm sites, leading to slow performance and frustrated customers who have many alternative options. Proactive website monitoring and optimization are key to mitigating these risks.
Combat frustration with Experience Monitoring
Contentsquare's Experience Monitoring tools allow you to keep a close eye on your entire shopping experience to identify and fix points of friction.
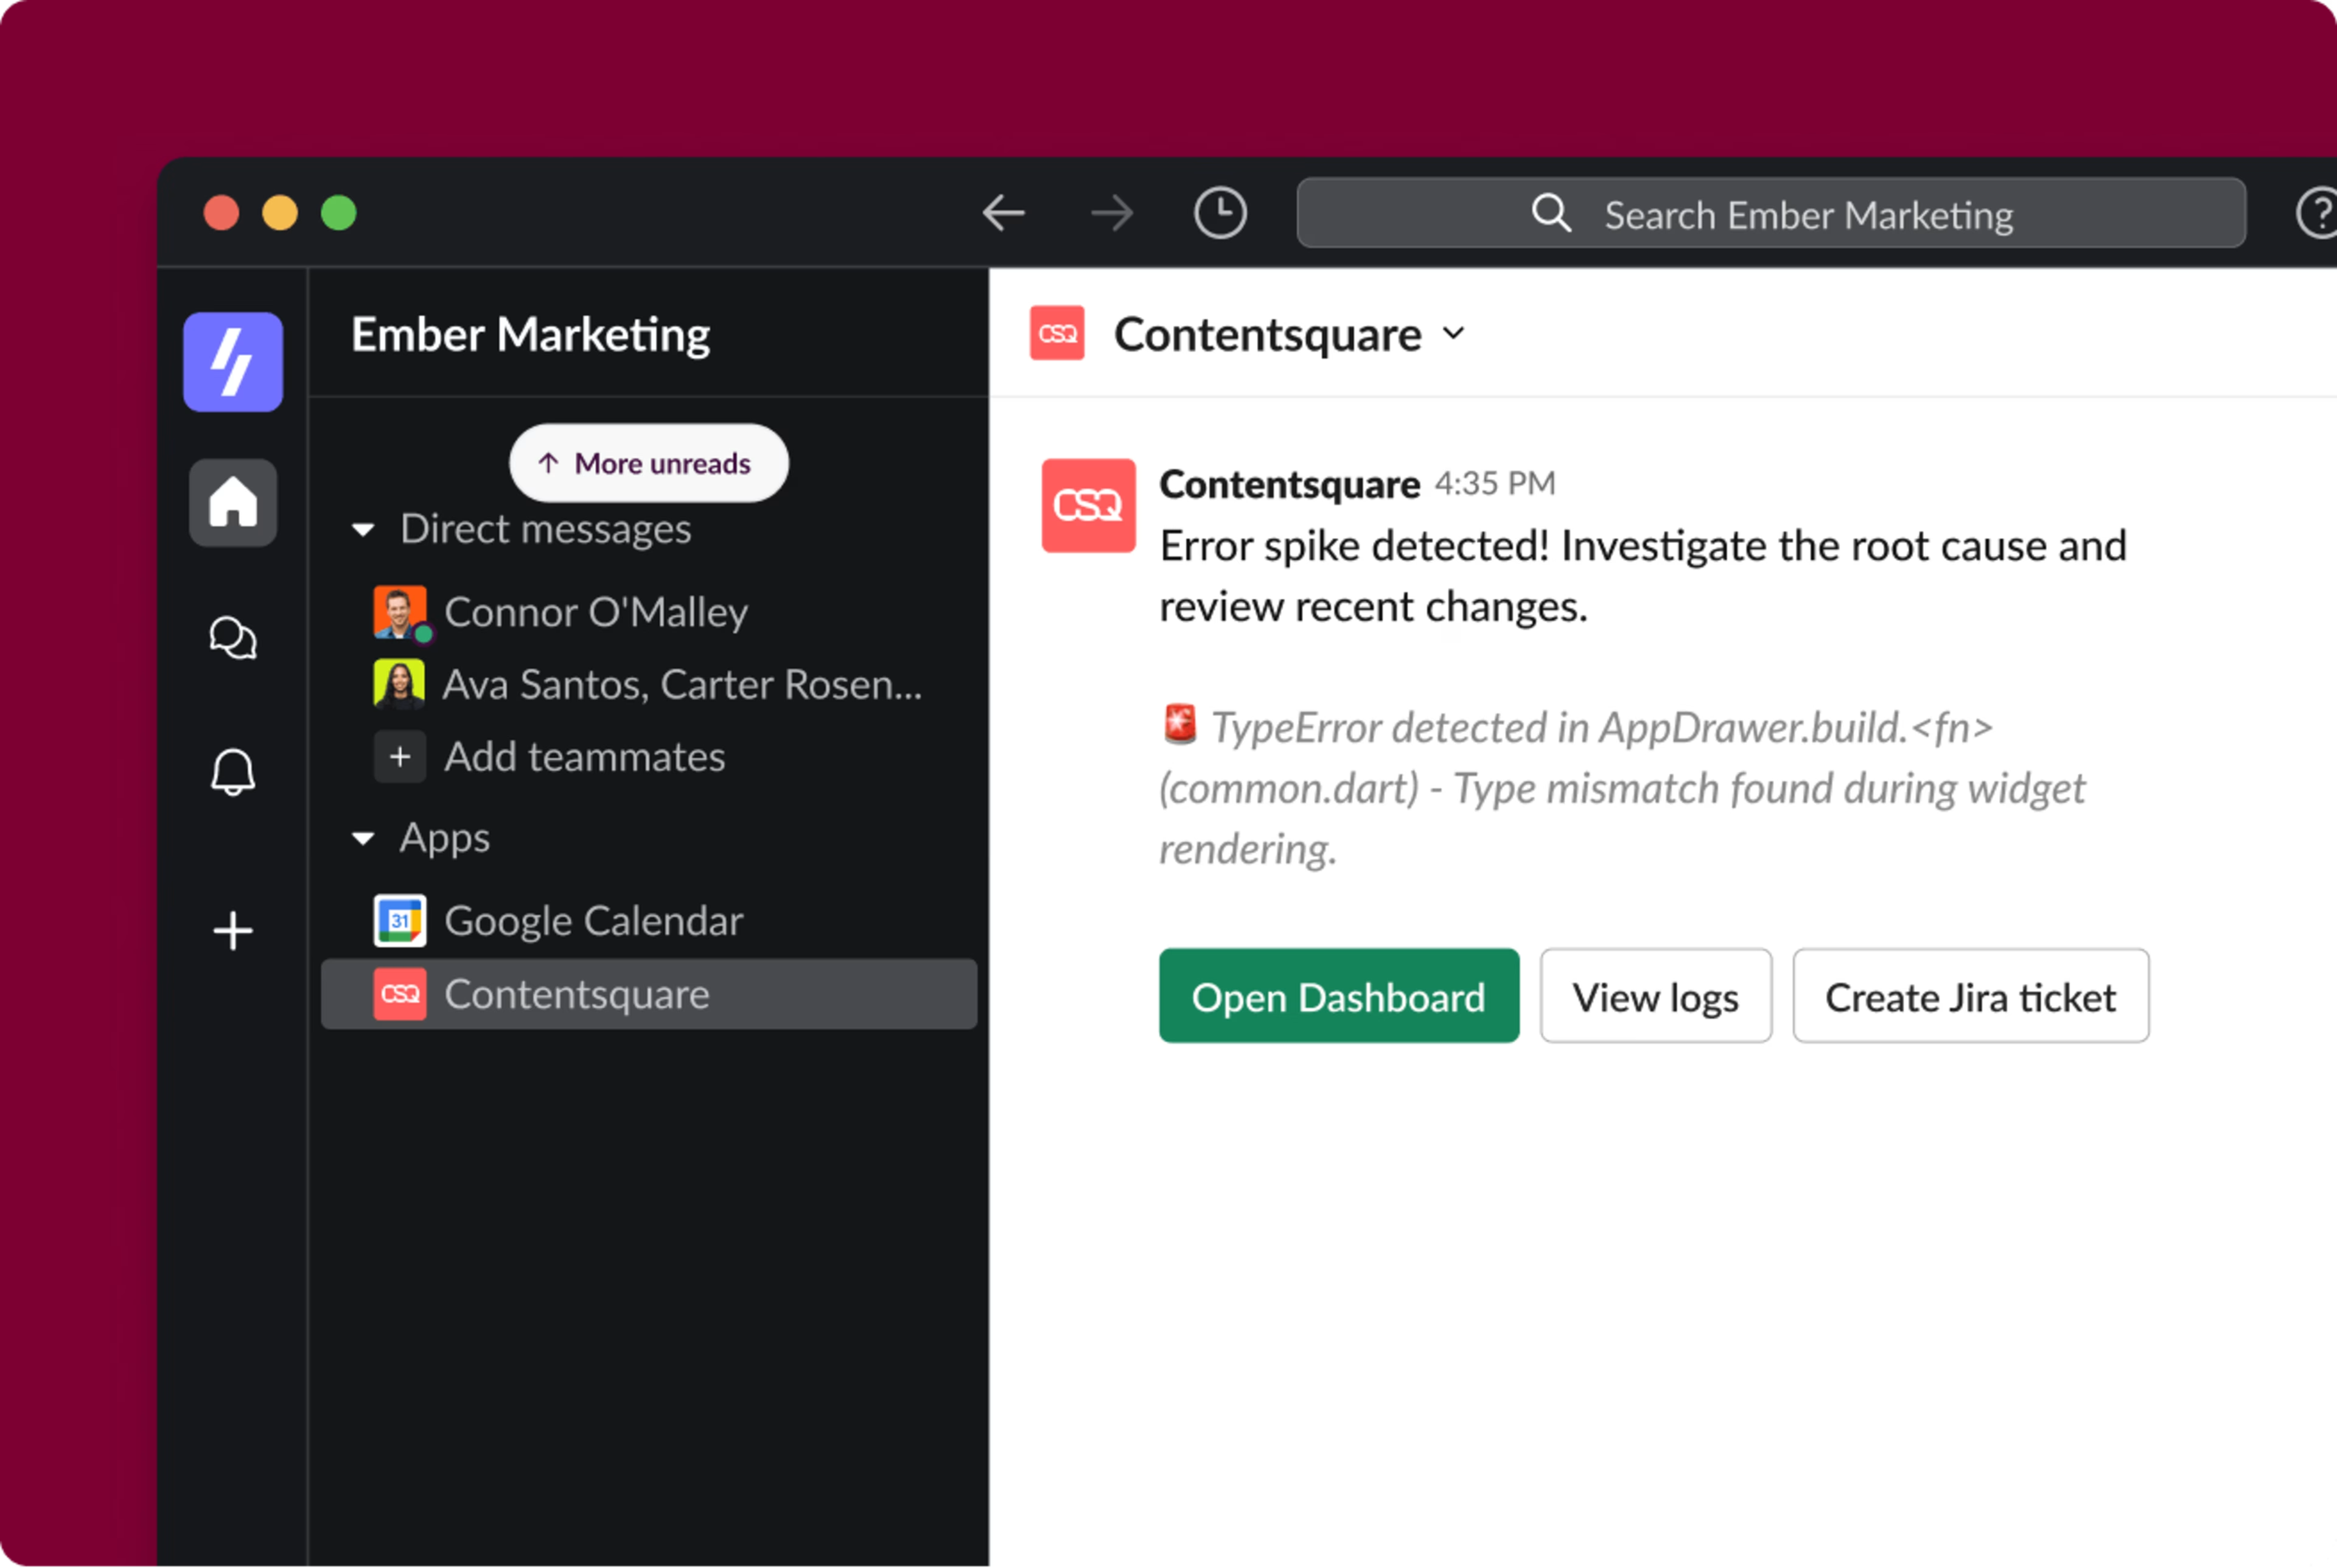
Error Analysis helps you continuously track performance errors like JavaScript errors (affecting 20.5% of sessions) and slow page loads (affecting 15.6% of sessions) in real-time, preventing them from damaging the customer experience.

🎥 Pro tip: once you’ve identified errors, jump into Session Replay to watch recordings of actual users experiencing the issue and better understand what’s happening.
What more could you do with Session Replay? Use Sense to get a summary of an individual or a set of sessions. Sense will highlight key insights and potential issues experienced by users during their session.
![[Product screenshot] Session Replay summary – Sense AI](http://images.ctfassets.net/gwbpo1m641r7/nlg5vootccUxdOYItZBXE/f6b8b7e42ce62f2f8f283fefa64eaae8/Platform___Session_Replay___AI_summary.png?w=3840&q=100&fit=fill&fm=avif)
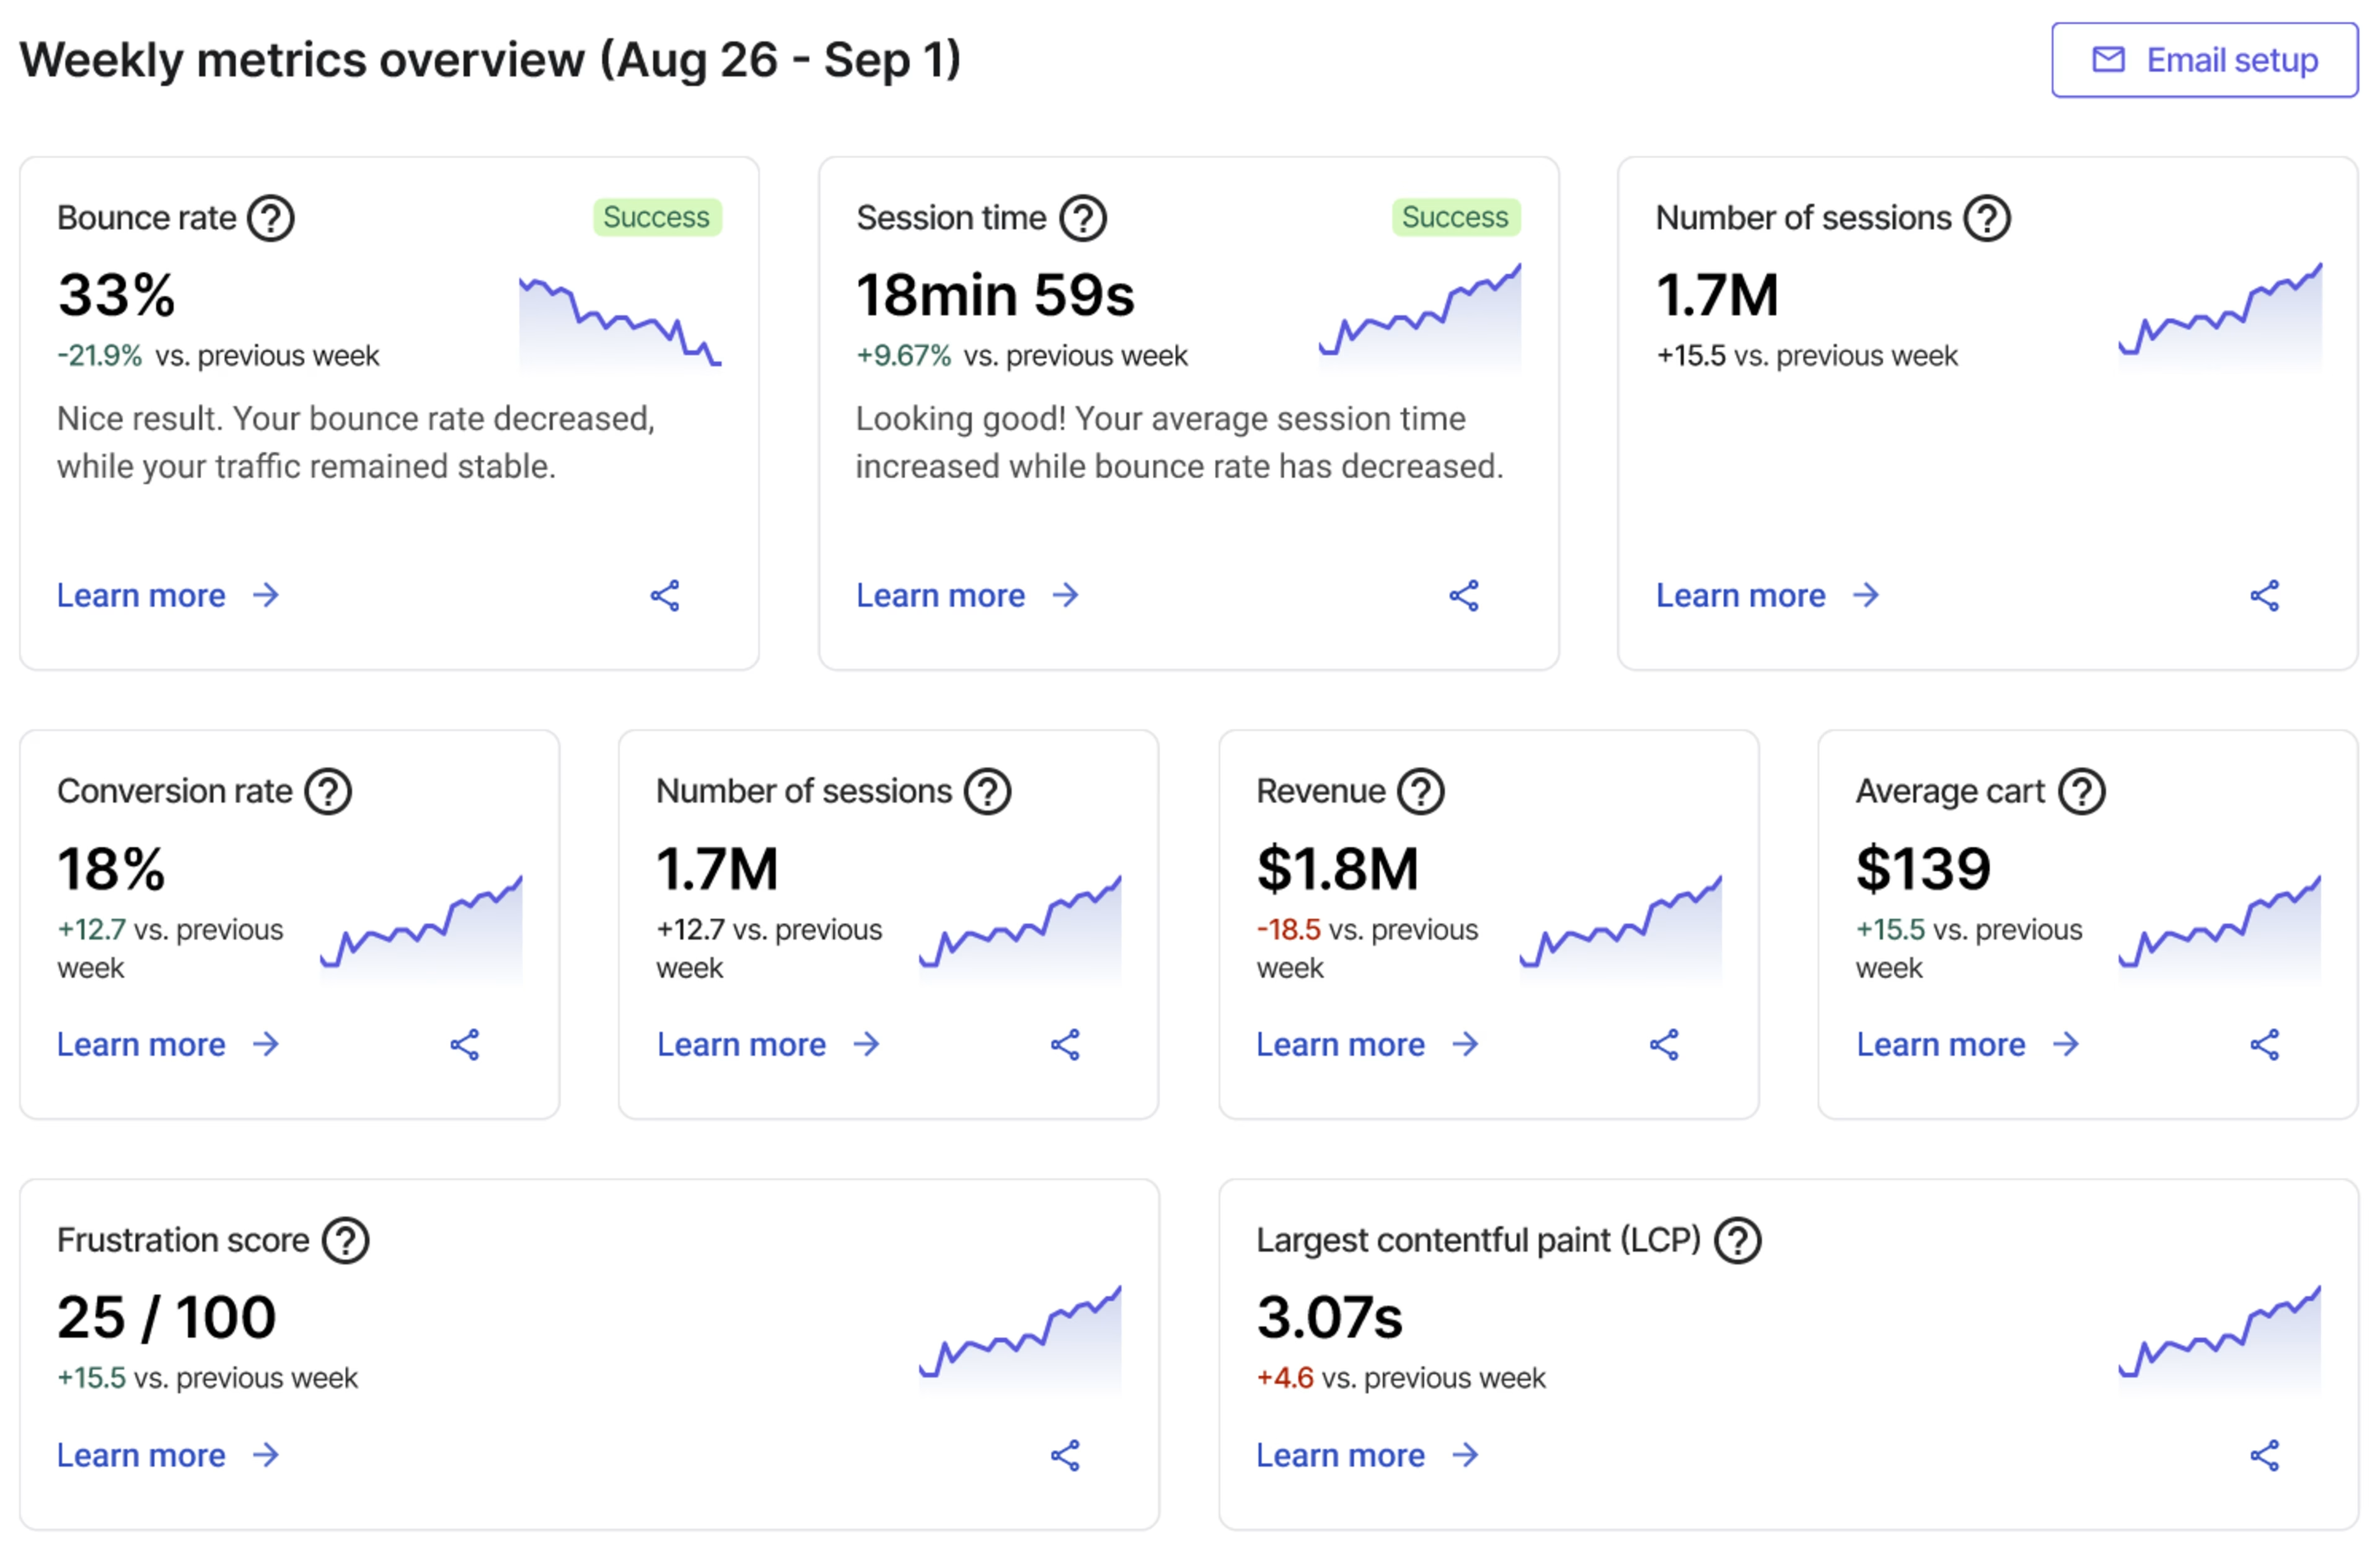
Speed Analysis helps you improve web performance by analyzing the speed at which the browser responds to user interactions. It can test single pages, monitor page groups, and analyze user journeys using synthetic data, as well as track real user Core Web Vitals (like Largest Contentful Paint, Cumulative Layout Shift, First Input Delay).
![[Visual] Speed Analysis & Improvements](http://images.ctfassets.net/gwbpo1m641r7/3jmq50umWVasSMqnBb56fk/a22722e210677f5530f79dbce1f37434/Speed_Analysis___Improvements__2_.png?w=3840&q=100&fit=fill&fm=avif)
Speed Analysis even includes recommendations to help you boost page loading speed.
Fix your site’s performance issues before peak season to improve SEO performance and capture more traffic, but also to ensure that once they click-through to one of your pages, users don’t bounce because they take too long to load.
Set up real-time alerts and headlines
To stay ahead of sudden spikes in frustration or performance issues, especially during high-stakes periods, you can set up real-time alerts with Contentsquare.

These AI Alerts use past trends, including seasonality and growth, to automatically detect unusual variations in metrics and filter out noise, providing more reliable anomaly detection than fixed thresholds. For rapid response, these alerts can be integrated directly into your team's workflow tools like Slack or Jira.
Gain quick overviews with hHadlines
The Headlines feature on the Contentsquare homepage provides automated weekly insights into key performance metrics like conversion rate, bounce rate, frustration score, session time, and error rate.
"Urgent" headlines signal when immediate action is required due to significant shifts, offering root cause suggestions and recommendations for further investigation, with direct links to relevant modules like Error Analysis and Journey Analysis.
⚡Real-world impact: Cotton On Group's success
A testament to the power of these strategies is the Cotton On Group, a global retail player. They recognized that their acquisition strategies were attracting customers who weren’t the right fit and were abandoning quickly.
By leveraging Contentsquare's experience intelligence platform, the Cotton On Group team built dashboards to meticulously analyze the performance of their website's various acquisition channels.
This enabled them to pinpoint which channels were attracting customers with a higher propensity to become loyal and make repeat purchases, significantly improving their retention and satisfaction rates. As a result, they were able to refine their less effective strategies and tailor marketing messages more effectively to high-value customer segments.
Ecommerce leaders within the Cotton On Group are now using Contentsquare. As a result, they're able to see where customers are landing on the website and where they're going to, which helps them to quickly conclude where they're bouncing.

Try Contentsquare to improve digital experiences on your retail site
By embracing these comprehensive strategies and utilizing Contentsquare's advanced tools, retailers can move beyond just driving traffic, focusing instead on acquiring higher-quality visitors, optimizing their digital experience at every touchpoint, reducing friction, boosting conversions, and ultimately building lasting customer loyalty.
![[Visual] Contentsquare's Content Team](http://images.ctfassets.net/gwbpo1m641r7/3IVEUbRzFIoC9mf5EJ2qHY/f25ccd2131dfd63f5c63b5b92cc4ba20/Copy_of_Copy_of_BLOG-icp-8117438.jpeg?w=1920&q=100&fit=fill&fm=avif)