![[Visual] Man at computer - stock](http://images.ctfassets.net/gwbpo1m641r7/7GloM7xPXUs1M75nfaIWtr/6566092d4d853e43c29d9df2bf791fd1/AdobeStock_540624504__1_.png?w=3840&q=100&fit=fill&fm=avif)
Winning and keeping customer attention on retail websites is a constant battle. Victory goes to those who truly understand how users engage with content and can perfect their online journey.
This guide dives into the current retail content consumption landscape and outlines actionable strategies for using Contentsquare's comprehensive platform to enhance engagement efforts and improve return on investment.
Key data points on content consumption and engagement for retail sites
The retail sector experienced a challenging year regarding content engagement.
Retail engagement declined more sharply than average this year. Consumption fell -14%, signalling shorter, more compressed shopping sessions
Alongside this, content consumption, measured by session depth, time spent on site, and scroll rate, also fell across devices, reflecting a simple reality: attention is scarce
Mobile consumption remains under pressure across most retail sub-industries. Fashion, grocery, and health & beauty each saw mobile consumption fall by -15%
Over 1 out of 3 visits start on a product page and PDPs account for 41% of total page views but, the highest bounce rates are also found on PDPs
![[Screenshot] Engagement by page type retail](http://images.ctfassets.net/gwbpo1m641r7/1viLMqqEIxGhcLuwcqaYYD/558783f2d482d831187a0d9671be1c6c/contentsquare__engagement---by-page-type_retail.png?w=3840&q=100&fit=fill&fm=avif)
Source: Contentsquare’s Benchmark report (filtered by ‘Retail)
3 strategies to boost engagement and content consumption on retail sites
1. Optimize high-performing elements for maximum impact
To encourage content consumption, it's essential to understand which page elements truly resonate with your audience. By identifying these high-performing elements, you can strategically position them for optimal exposure and engagement.
Start by running a heatmap analysis with Contentsquare Heatmaps. Traditional heatmaps (click, move, and scroll maps) provide powerful visual insights into user interactions, revealing which elements attract attention, drive engagement, or contribute to conversions. This includes understanding clicks, hovers, and scroll behaviors.
![[Visual] heatmaps back into action](http://images.ctfassets.net/gwbpo1m641r7/1IqiRyF8JXAyYNnXT3LMyQ/32815c373967d53f2e9e84f400e23830/CSQ-heatmaps.png?w=3840&q=100&fit=fill&fm=avif)
But you could go even further in your engagement analysis with the more powerful Zone-based heatmaps. Zoning lets you break your page down into sections and analyze how they perform against a variety of metrics.
For instance, zoning measures the repartition of clicks across the page, so you can easily quantify which areas of the page users engage the most with. Filtering zones by ‘Engagement rate’ highlights the elements of the page that users interacted with.
![[Visual] Zoning and Heatmaps](http://images.ctfassets.net/gwbpo1m641r7/1fY6bBg1dnmmchw0aGq0u7/fbbc1440b4715d35ffdbf3b048eafd18/Zoning.png?w=3840&q=100&fit=fill&fm=avif)
To tie engagement to ROI, a variety of metrics are at your disposal, from ‘Revenue’ to ‘Purchase, so you can understand how many of the users who clicked the zone also completed a purchase during the same session.
These insights let you elevate effective elements and reconfigure page layouts, ensuring users are consistently drawn in from their initial landing point through to the purchase decision.
For instance, if you notice that an element at the bottom of your PDP often triggers same-session purchases, consider:
Moving it up on the page so more users see it
Duplicating it to other relevant PDPs
⚡ Real-world impact: INKEY’s success
Skincare brand INKEY successfully used Contentsquare's Zone-based heatmaps to implement UX optimizations on their results pages.
With interactive and personalized digital experiences, including an AI-powered skincare analysis tool called ‘Breakout Analyzer Pro’, they encourage users to engage with their content.
Using engagement metrics like attractiveness rate, hover time, click recurrence, and exposure rate to analyze the performance of their ‘Breakout Analyzer Pro’ and compare it to their other skincare tools, a skincare quiz and ‘Build Your Own Bundle’ feature, they identified ways to improve engagement:
Optimizing and rearranging elements with high attractiveness rates
Identifying user experience (UX) bugs in calls-to-action (CTAs)
Adding a visual breakout activity level bar, an ‘explainer below’ bar, and CTAs to retake the analysis
![[Visual] INKEY logo](http://images.ctfassets.net/gwbpo1m641r7/3d6bqvJRPqy2eitduwaYRQ/dce9c0ed940aee8a8e40c8531d159561/image3-removebg-preview.png?w=1920&q=100&fit=fill&fm=avif)
We know where and how our customers are interacting and engaging with our site at a granular page and segment level, which is something generic data reporting can’t provide context to.
![[Headshot] Jo Melville INKEY](http://images.ctfassets.net/gwbpo1m641r7/o76uPw1PorJfGs6qMXHYB/62160c0a0e1b8fb7a4ae72312d1ab25d/image6.png?w=3840&q=100&fit=fill&fm=avif)
2. Simplify the discovery process for shoppers
You’ve seen the data at the top of this page: new visitors often spend less time on site and exit quicker, especially when faced with an overwhelming amount of information.
Instead of adding friction by presenting an abundance of options, promises, return policies, and more elements that hinder their customer experience, streamlining their journey to find what they're looking for is key to keeping them engaged.
Start by setting up a feedback widget with Contentsquare Surveys to let shoppers tell you how they feel about your site and pages. Surveys lets you target specific pages where you want your feedback widget to appear. Feel free to display it on your entire site, or only on sections on which you’re seeking feedback.
Then, once answers start rolling in, use our AI-powered sentiment analysis feature to find out whether the feeling is more ‘yeh!’ or ‘meh…’.
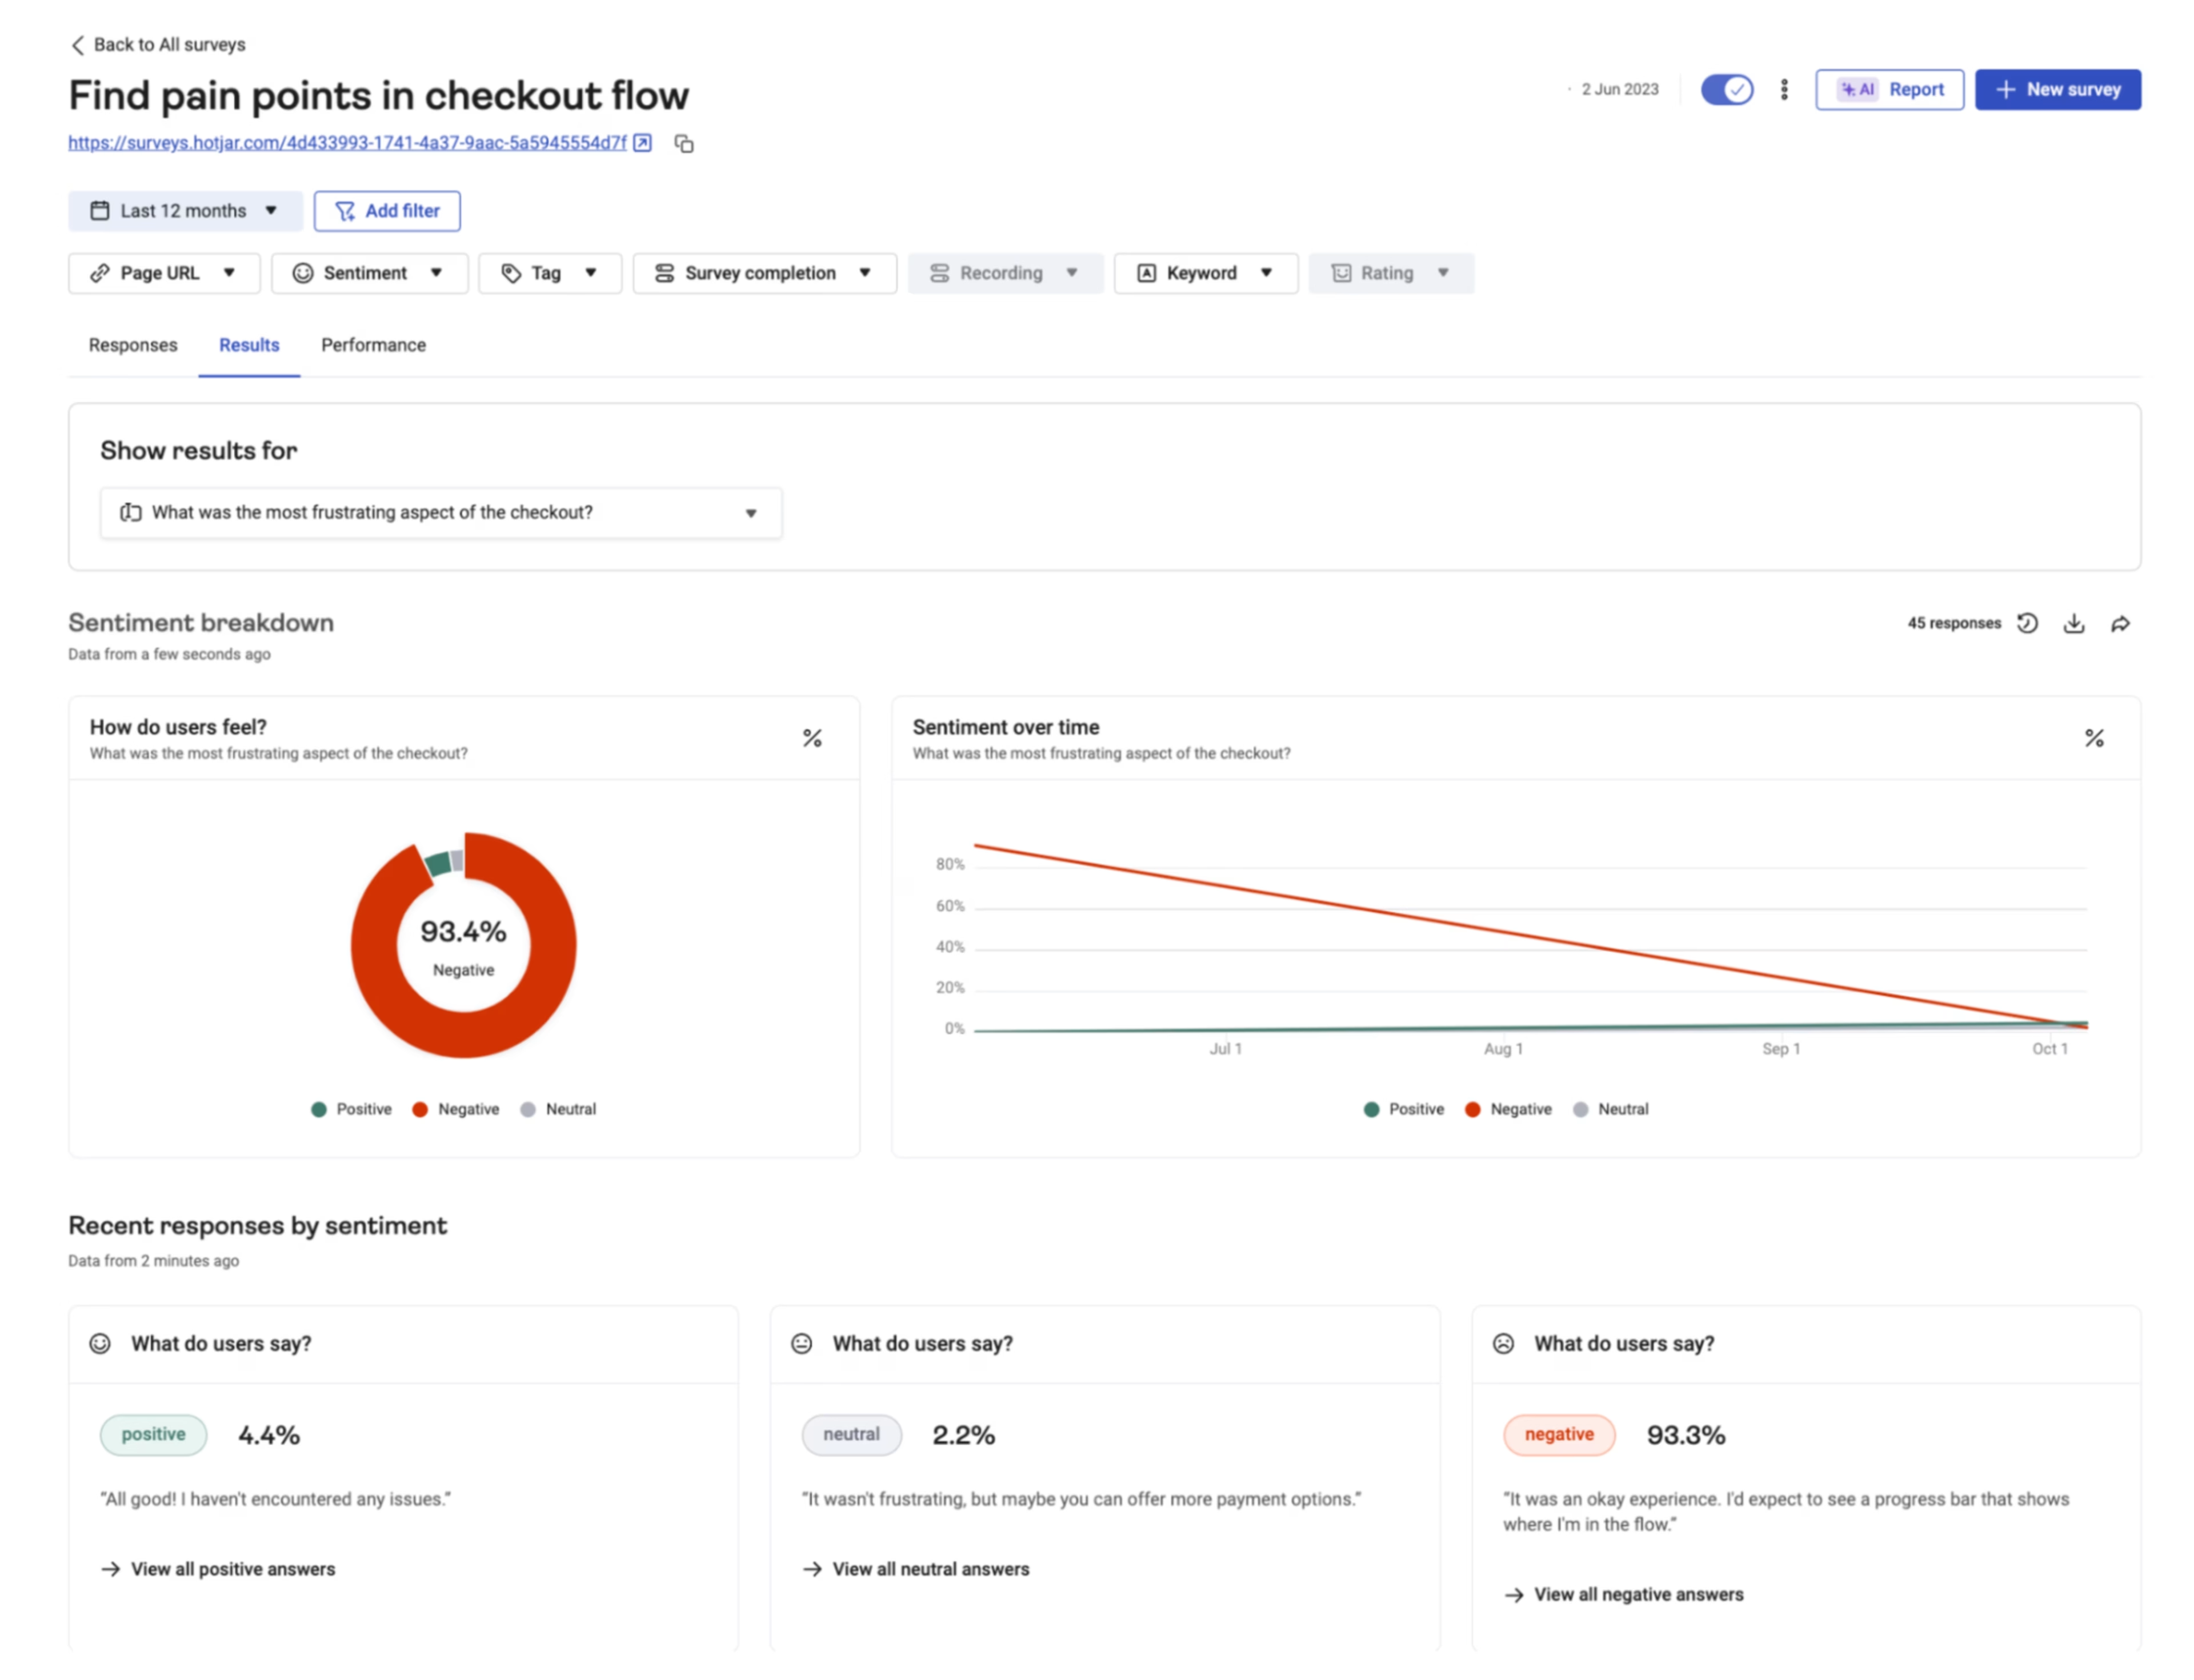
For example, users may highlight for you that some of your pages are overloaded with text, or on the contrary, that accessibility is poor because the font size is too small, inviting you to use text tooltips for key information or larger callouts instead of fine print.
But sometimes, you don’t need users to tell you they’re frustrated: you can see it for yourself. Session Replay lets you put yourself in your customers' shoes and watch their exact experience, seeing where they hesitate or struggle.
Filter by ‘frustration score’ and/or by sessions including specific pages. For example, you might be interested in learning which elements of your PDPs that users who don’t complete a purchase engage with, as opposed to those who do complete a purchase.
🤖 Pro tip: in Session Replay, save time by letting Sense AI summarize a set of recordings for you, so you spend less time gathering insights and more time acting on them.
![[Visual] AI session replay summaries](http://images.ctfassets.net/gwbpo1m641r7/3xrdkhayKftcgj7tXavwVS/bd8b2ea0930743b584316093cd8aab4d/AI_session_replay_summaries.png?w=3840&q=100&fit=fill&fm=avif)
3. Enhance Product Detail Pages (PDPs) with engaging content
PDPs are crucial for conversion, yet they often suffer from high bounce and exit rates. By enriching these pages with interactive elements and providing clear pathways to alternative items, you can significantly boost content consumption and conversion.
Here again, Contentsquare Heatmaps, and scroll maps in particular, help you ensure relevant information is above the fold so users don’t have to scroll too far to see essential information like product images, average review scores, and whether a product is out of stock.
![[Visual] Scroll map](http://images.ctfassets.net/gwbpo1m641r7/59VVM5aFLi9Er63MbUs07u/7d14276947fe5c0bc8269b2871f3454b/Scroll_map.png?w=3840&q=100&fit=fill&fm=avif)
Next, you need to understand why users who visit a product detail page are bouncing without completing a purchase.
Contentsquare's Journey Analysis allows you to understand the typical paths users take and segment those who complete high-value actions, helping you identify effective journeys to replicate. It also helps you identify "good" or "bad" exits.
Look at the journeys of users who visited a product page and from there, left your site, then investigate further.
![[Visual] Journey analysis on reference mapping](http://images.ctfassets.net/gwbpo1m641r7/30V6WdNQ7xg3mlOFV7DkmY/0e2235977563e2c759fdbd873d51ae59/01-Masthead__1_.png?w=3840&q=100&fit=fill&fm=avif)
For example, if the product a user is interested in is out of stock but they are not offered any alternative, they are likely to leave your site. Once you’ve identified such pages, make it easy for users to see similar products they may be interested in clicking on instead of bouncing, or provide an option for them to be alerted once the item in question is back in stock.
Analyzing top-performing pages and underperforming ones is made easy by Contentsquare’s Page Comparator capability. For instance, compare how they perform against key metrics "User retention" and "Multi-session purchase rate". This enables you to see if users return to your site or make future purchases after viewing specific content.
![[Visual] page comparator](http://images.ctfassets.net/gwbpo1m641r7/40q7oVyz6DyATagAoUbdVK/2ab223a89daa7f1de9793fd1d4bd05e2/page_comparator.png?w=3840&q=100&fit=fill&fm=avif)
💡 Pro tip: even if a user visits a PDP and decides they’re no longer interested after all, you still want to keep them engaged and on your site. By combining insights from PDPs with Product Listing Pages (PLPs), you can embed PLP banner menus within PDPs, guiding users to explore more options and encouraging deeper sessions, keeping the conversion window open.
4. Optimize mobile experiences
Mobile devices now dominate retail traffic, accounting for 77% of traffic share in 2023 and generating 56.3% of revenue for retailers. However, mobile visitors typically spend less time on websites, engaging in "micro visits" that are less likely to result in conversions. Optimizing the mobile experience is crucial to capture this significant audience and drive engagement.
Contentsquare provides a comprehensive mobile analytics solution, offering insights into user behavior across mobile web and native apps. The platform employs tag-free autocapture for all user interactions, simplifying setup with a single SDK and out-of-the-box dashboards.
With mobile heatmaps, you can visually understand how users interact with content on mobile screens (tap and scroll maps), revealing engagement and optimizing content for conversions.
![[Product screenshot] Mobile heatmaps - Scroll map](http://images.ctfassets.net/gwbpo1m641r7/3jxS1YG3ZX8Up69K83A0Fi/60f228ac73295e3d46ebfa24516bb574/-Visual-_Mobile_heatmaps_-_Scroll_map.png?w=3840&q=100&fit=fill&fm=avif)
Just as for websites, Session Replay for mobile allows you to watch actual mobile user sessions, identifying points of friction and understanding user behavior in context. The Page Comparator capability functions as "Screen Metrics" for mobile projects, enabling analysis of page performance and user retention across mobile devices.
Contentsquare's Experience Monitoring capabilities for mobile help surface technical issues that impact the user experience. This includes collecting and analyzing API errors, crashes, and WebView errors. The "errors after tap" metric helps you prioritize errors by correlating them with user taps, reducing false positives.
⚡Real-world impact: how CAMILLA significantly increased mobile average order value and "Add to Cart" rates
Using Contentsquare, the luxury fashion brand CAMILLA discovered that their mobile customers were experiencing friction when attempting to find the ‘Add to Cart’ button on product pages, negatively impacting engagement and conversions.
Furthermore, the Error Analysis capability also highlighted JavaScript errors that caused issues with actions like removing items from carts, which helped the team quickly address these problems.
![[Product screenshot] Error analysis - Mobile](http://images.ctfassets.net/gwbpo1m641r7/FHE26l0YrkilHY2qWhz4T/7432bc03e679fe499f47fa8f3eeb23bb/-Product_screenshot-_Error_analysis_-_Mobile.png?w=3840&q=100&fit=fill&fm=avif)
Try Contentsquare for free to improve digital experiences on your retail site
By adopting these strategies and leveraging Contentsquare’s comprehensive capabilities, you can create engaging retail experiences that not only captivate your audience but also significantly increase content consumption, engagement, and drive business growth.
Contentsquare is designed to provide smarter, AI-powered insights and clearer journeys, empowering every team to make data-driven decisions with confidence.
![[Visual] Contentsquare's Content Team](http://images.ctfassets.net/gwbpo1m641r7/3IVEUbRzFIoC9mf5EJ2qHY/f25ccd2131dfd63f5c63b5b92cc4ba20/Copy_of_Copy_of_BLOG-icp-8117438.jpeg?w=1920&q=100&fit=fill&fm=avif)