
Product design is both an art and a science. Whether you're a user experience (UX) designer, product design manager, or the head of UX, you need to blend creativity with data-driven decision-making to build products that solve real user problems.
This is where product analytics becomes your most valuable tool. It’s more than just a way to measure clicks and conversions—it’s the key to unlocking user behavior insights that transform how you design, iterate, and optimize your product.
In this article, we explore how product teams and UX designers use analytics at every stage of the design process, from discovering opportunities to refining features and aligning the team around decisions. Plus, you’ll get tips on how to use these insights and Contentsquare’s experience intelligence platform to fast-track your workflow.
Why designers need product analytics
As a product designer, your role revolves around the UX. You’re not just creating intuitive, user-friendly designs—you’re also trying to balance user needs, business goals, and team alignment, all while staying ahead of user frustrations and pain points.
You need to know how users interact with your product, which features they love, where they’re getting stuck, and how to improve usability and customer satisfaction. To do that, you need actionable insights, but the tools you're working with may feel fragmented, giving you only a partial view of the customer journey.
Product analytics offer an integrated, user-focused approach to the data that helps you optimize your design process. It helps you answer key questions like
Are users completing tasks efficiently?
Where are they dropping off in the process?
Which features are most engaging or underused?
These insights let you create user-centric designs that meet customer needs and business objectives.
7 ways to use product analytics for better, smarter design
Here’s how to integrate product analytics into your daily workflow and design experiences that truly resonate with your users.
1. Find the right people to talk to
When you're preparing to design a new feature or improve an existing one, it’s essential to collect feedback from users who actually engage with those features. Instead of just randomly sending invites for user interviews or surveys, product analytics helps you identify exactly which users are interacting with specific features. This lets you target feedback from the people who have the most relevant experience.
Why it works: by targeting the right users, you increase the relevance of your feedback and avoid wasting time surveying or interviewing users who haven’t used the feature in question.
How to do it: start by creating a chart focused on the specific feature you're working on. Track engagement metrics over time and group the data by user identity (like email) to see which users have interacted with the feature. From here, you can export the list and send targeted survey invites or schedule interviews.
Create an engagement chart in Contentsquare’s Product Analytics product, powered by Heap
💡Pro tip: too many users on your list? Narrow down to the most engaged through segmentation.
Use Contentsquare’s User Segmentation capability to automatically identify user segments based on their engagement with certain features or journeys.
This helps you narrow down the user pool to those who are most engaged with a specific feature, creating a much smaller list of users to work with. Because they use the feature frequently, they’re also more likely to give you better feedback.
![[Visual][product illustrations] segments](http://images.ctfassets.net/gwbpo1m641r7/7cCsfkeWIrOft8oOb1jqDv/ababc2c7810f40146b64144565cfed05/Segment.svg?w=1920&q=100&fit=fill)
Contentsquare uses behavioral segmentation to group users based on the actions they take on your site or product
2. Get inspired and spot new design opportunities
Product designers are constantly searching for ways to improve the user experience. Whether you’re creating end-to-end designs or leading design strategy, you need a clear understanding of what’s working—and what’s not—in your current designs.
Product analytics gives you a detailed view of how users interact with your product and user interface (UI). This lets you see how your users are engaging, what content elements make them come back to your site and app, and what drives them to convert over time.
For example, let’s say users are interacting heavily with a particular app feature page, but you hadn’t considered it a core part of the user journey. With this insight, you can dig deeper and expand on that feature to enhance the experience.
Why it works: no more guessing what resonates with users. Product analytics shows you how users naturally navigate your product, inspiring ideas for iteration and new features that are grounded in real behavior.
How to do it: use heatmaps to visualize where users are spending the most time on your page or product. This allows you to spot high-engagement areas and think about how you can make them even more intuitive.
Contentsquare’s Heatmaps capability gives you granular insights into how users interact with every part of your product, from clicks and scrolls to hovers. And with product analytic metrics such as retention rate and multi-session conversion rate displayed directly over your content elements, it’s even easier to get inspiration for new and optimized designs.
By analyzing data on clicks, scrolls, hovers, and other interactions, you see which elements capture your users’ attention and which they ignore. This helps you find hidden opportunities to improve the user experience. You can quickly spot underperforming areas of your design and rework them to delight users and drive business results. It's a data-backed way to inspire your next design iteration.
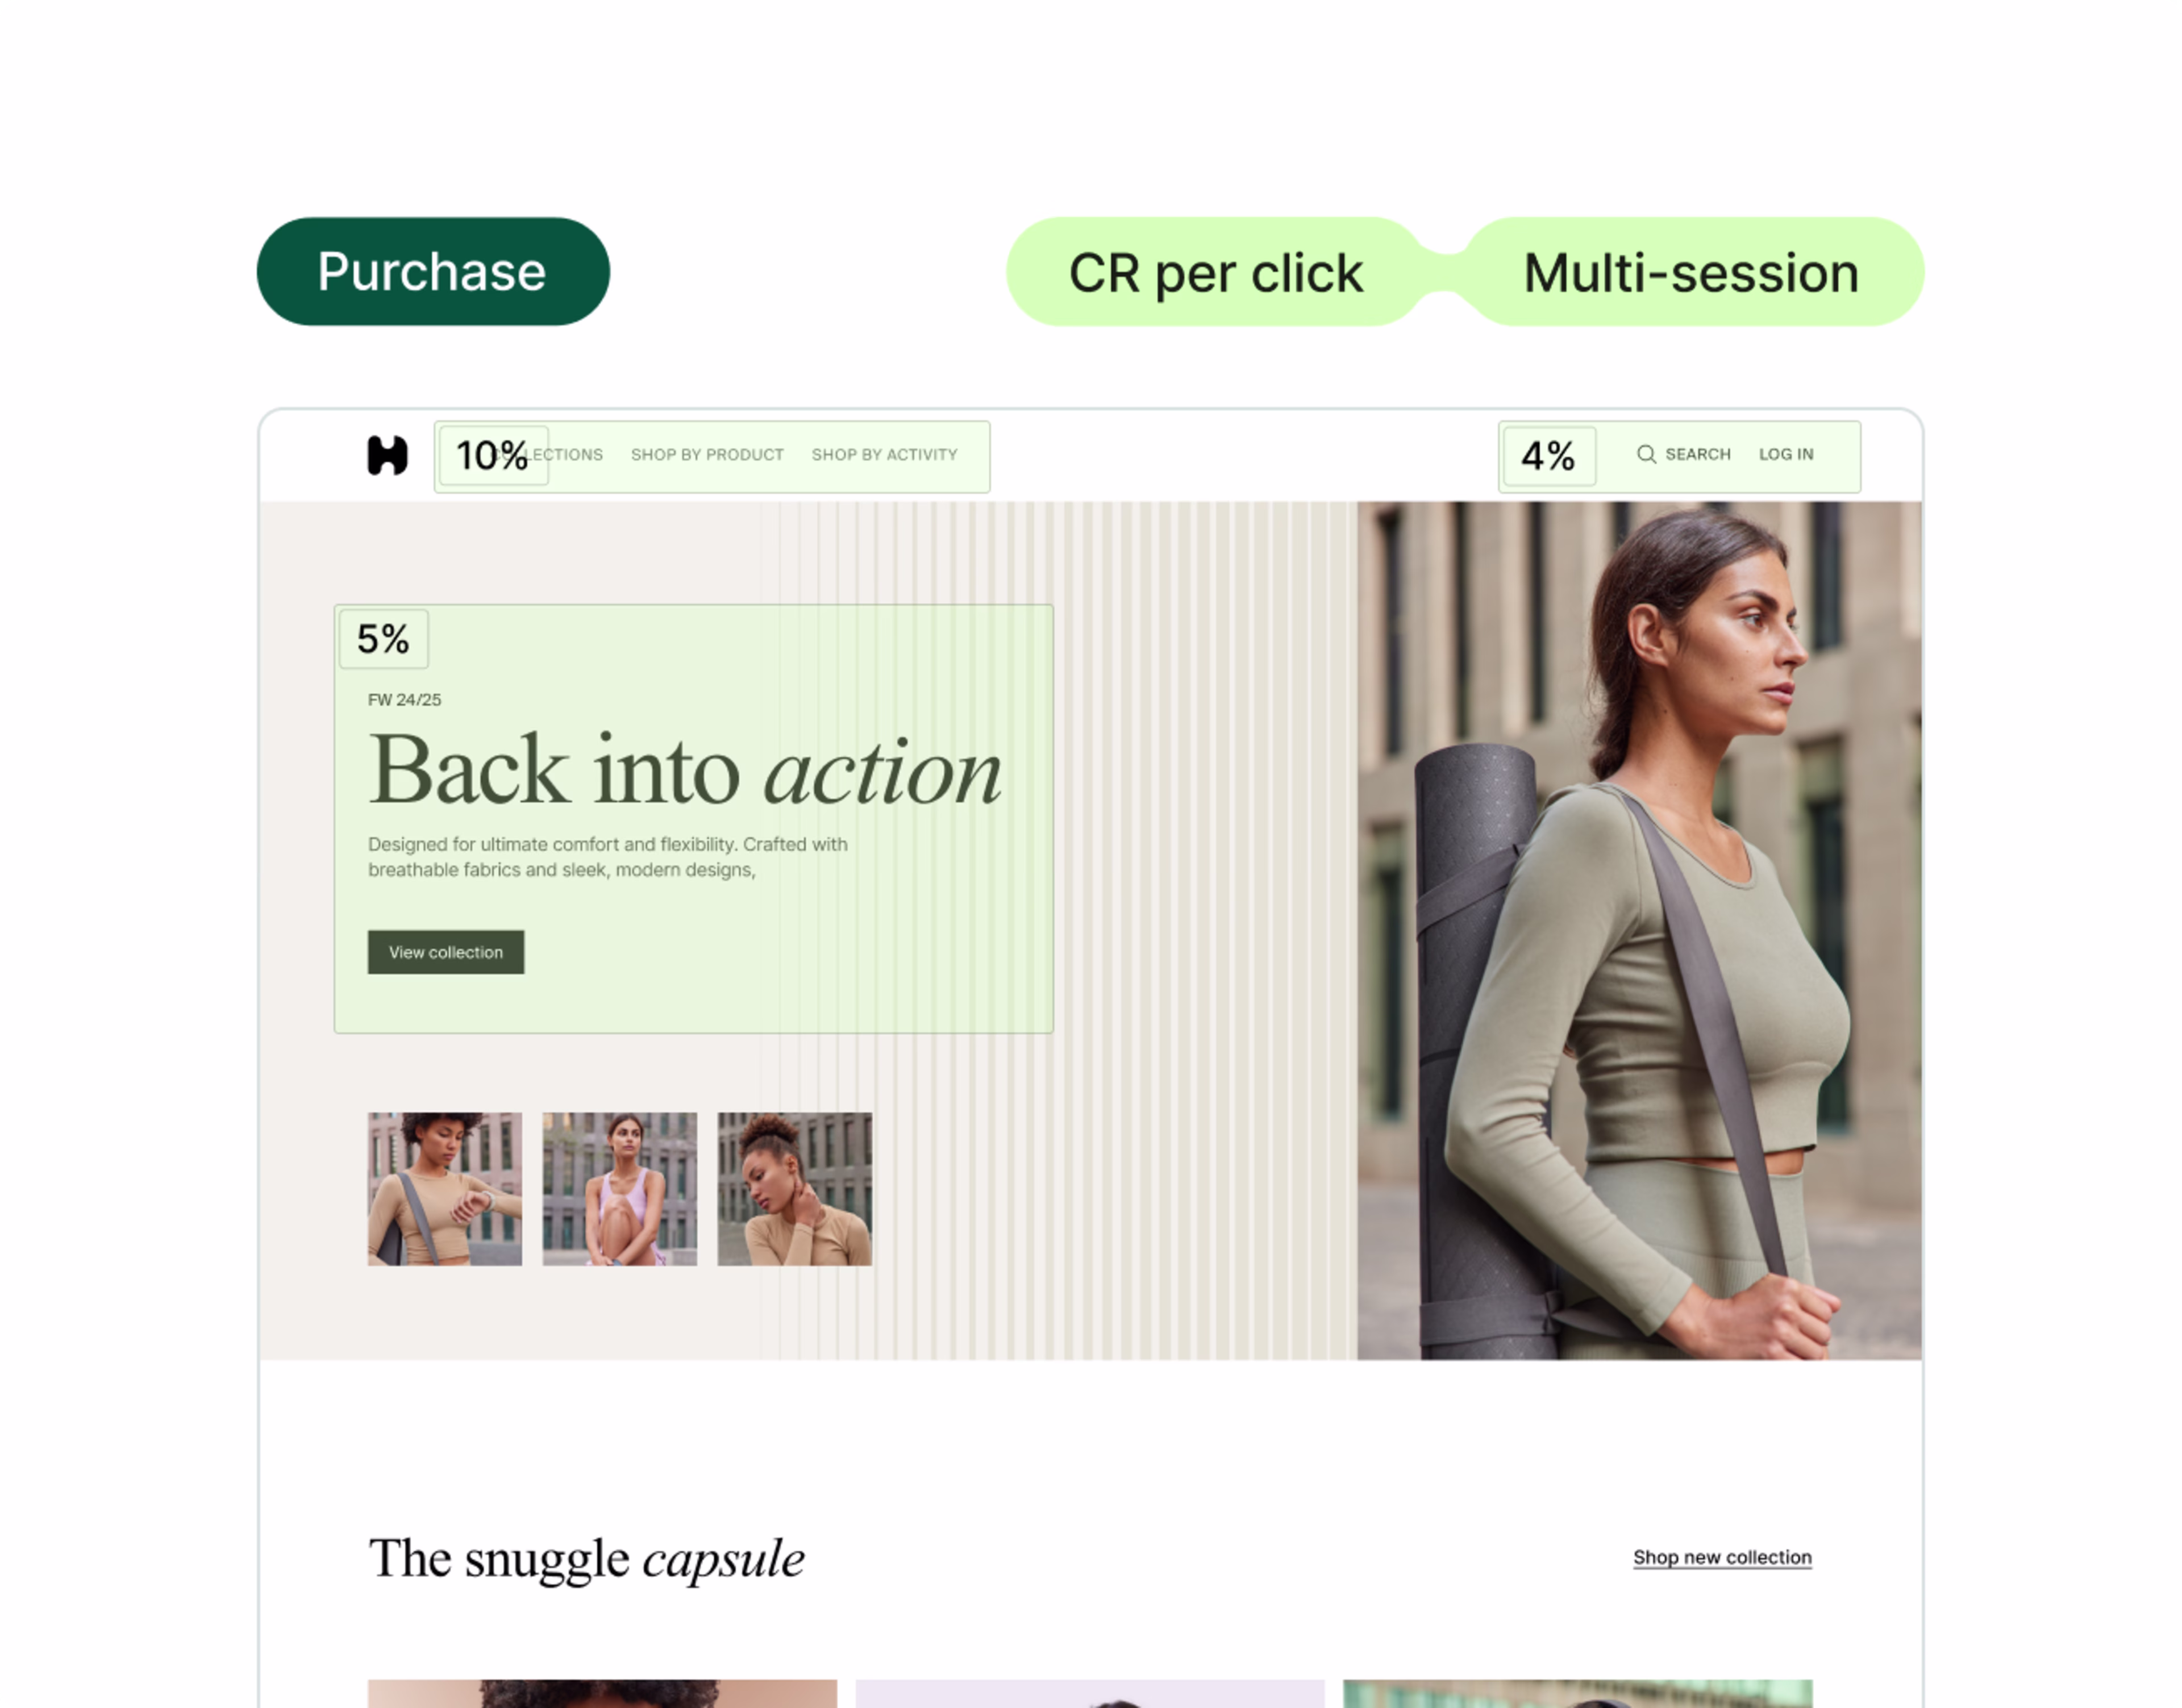
Use Contentsquare to create heatmaps showing how users interact with your designs
💡 Pro tip: use heatmaps to understand why winning A/B tests were successful and get ideas for future redesigns.
Because heatmap data represents aggregated user behavior, it helps you understand why certain variants of your A/B tests are more successful in a way traditional web analytics tools like Google Analytics can’t.
![[Visual] ab test heatmaps](http://images.ctfassets.net/gwbpo1m641r7/71Feljv3nwR0ng3PEiPGEG/c5c4f991ef679e660e08970edb2a894a/ab_test_heatmaps.png?w=3840&q=100&fit=fill&fm=avif)
Contentsquare heatmaps let you compare revenue generated by elements in an A/B test
3. Replace guesswork with confidence in your designs
Designers have strong instincts, but it’s important to back them up with data and ensure your decisions aren’t based on assumptions. You don’t want to spend weeks building a new feature, only to see users ignoring it.
Product analytics lets you track how users interact with your product in real time, giving you immediate feedback on what’s working and what’s causing friction. The key benefit? You don’t need to rely on post-launch feedback alone—you can address usability issues as they arise.
For instance, if you’ve rolled out a new feature and notice a significant drop-off at a certain point in the customer journey, you can investigate and tweak the design before it becomes a larger issue.
Why it works: you can make adjustments with confidence, knowing your decisions are informed by actual user behavior. It also reduces back-and-forth design iterations, as you’re basing your changes on real-time insights.
How to do it: instead of launching a feature blindly and waiting for post-launch feedback, use Contentsquare’s Session Replay to analyze user interactions instantly. For example, if your company releases a new feature, watching relevant replays to see exactly where users struggle, hesitate, or get lost in your design.
This means you can quickly pinpoint where the issue lies and resolve it. Plus, it prevents wasted development cycles and ensures users have a smoother experience from the start.
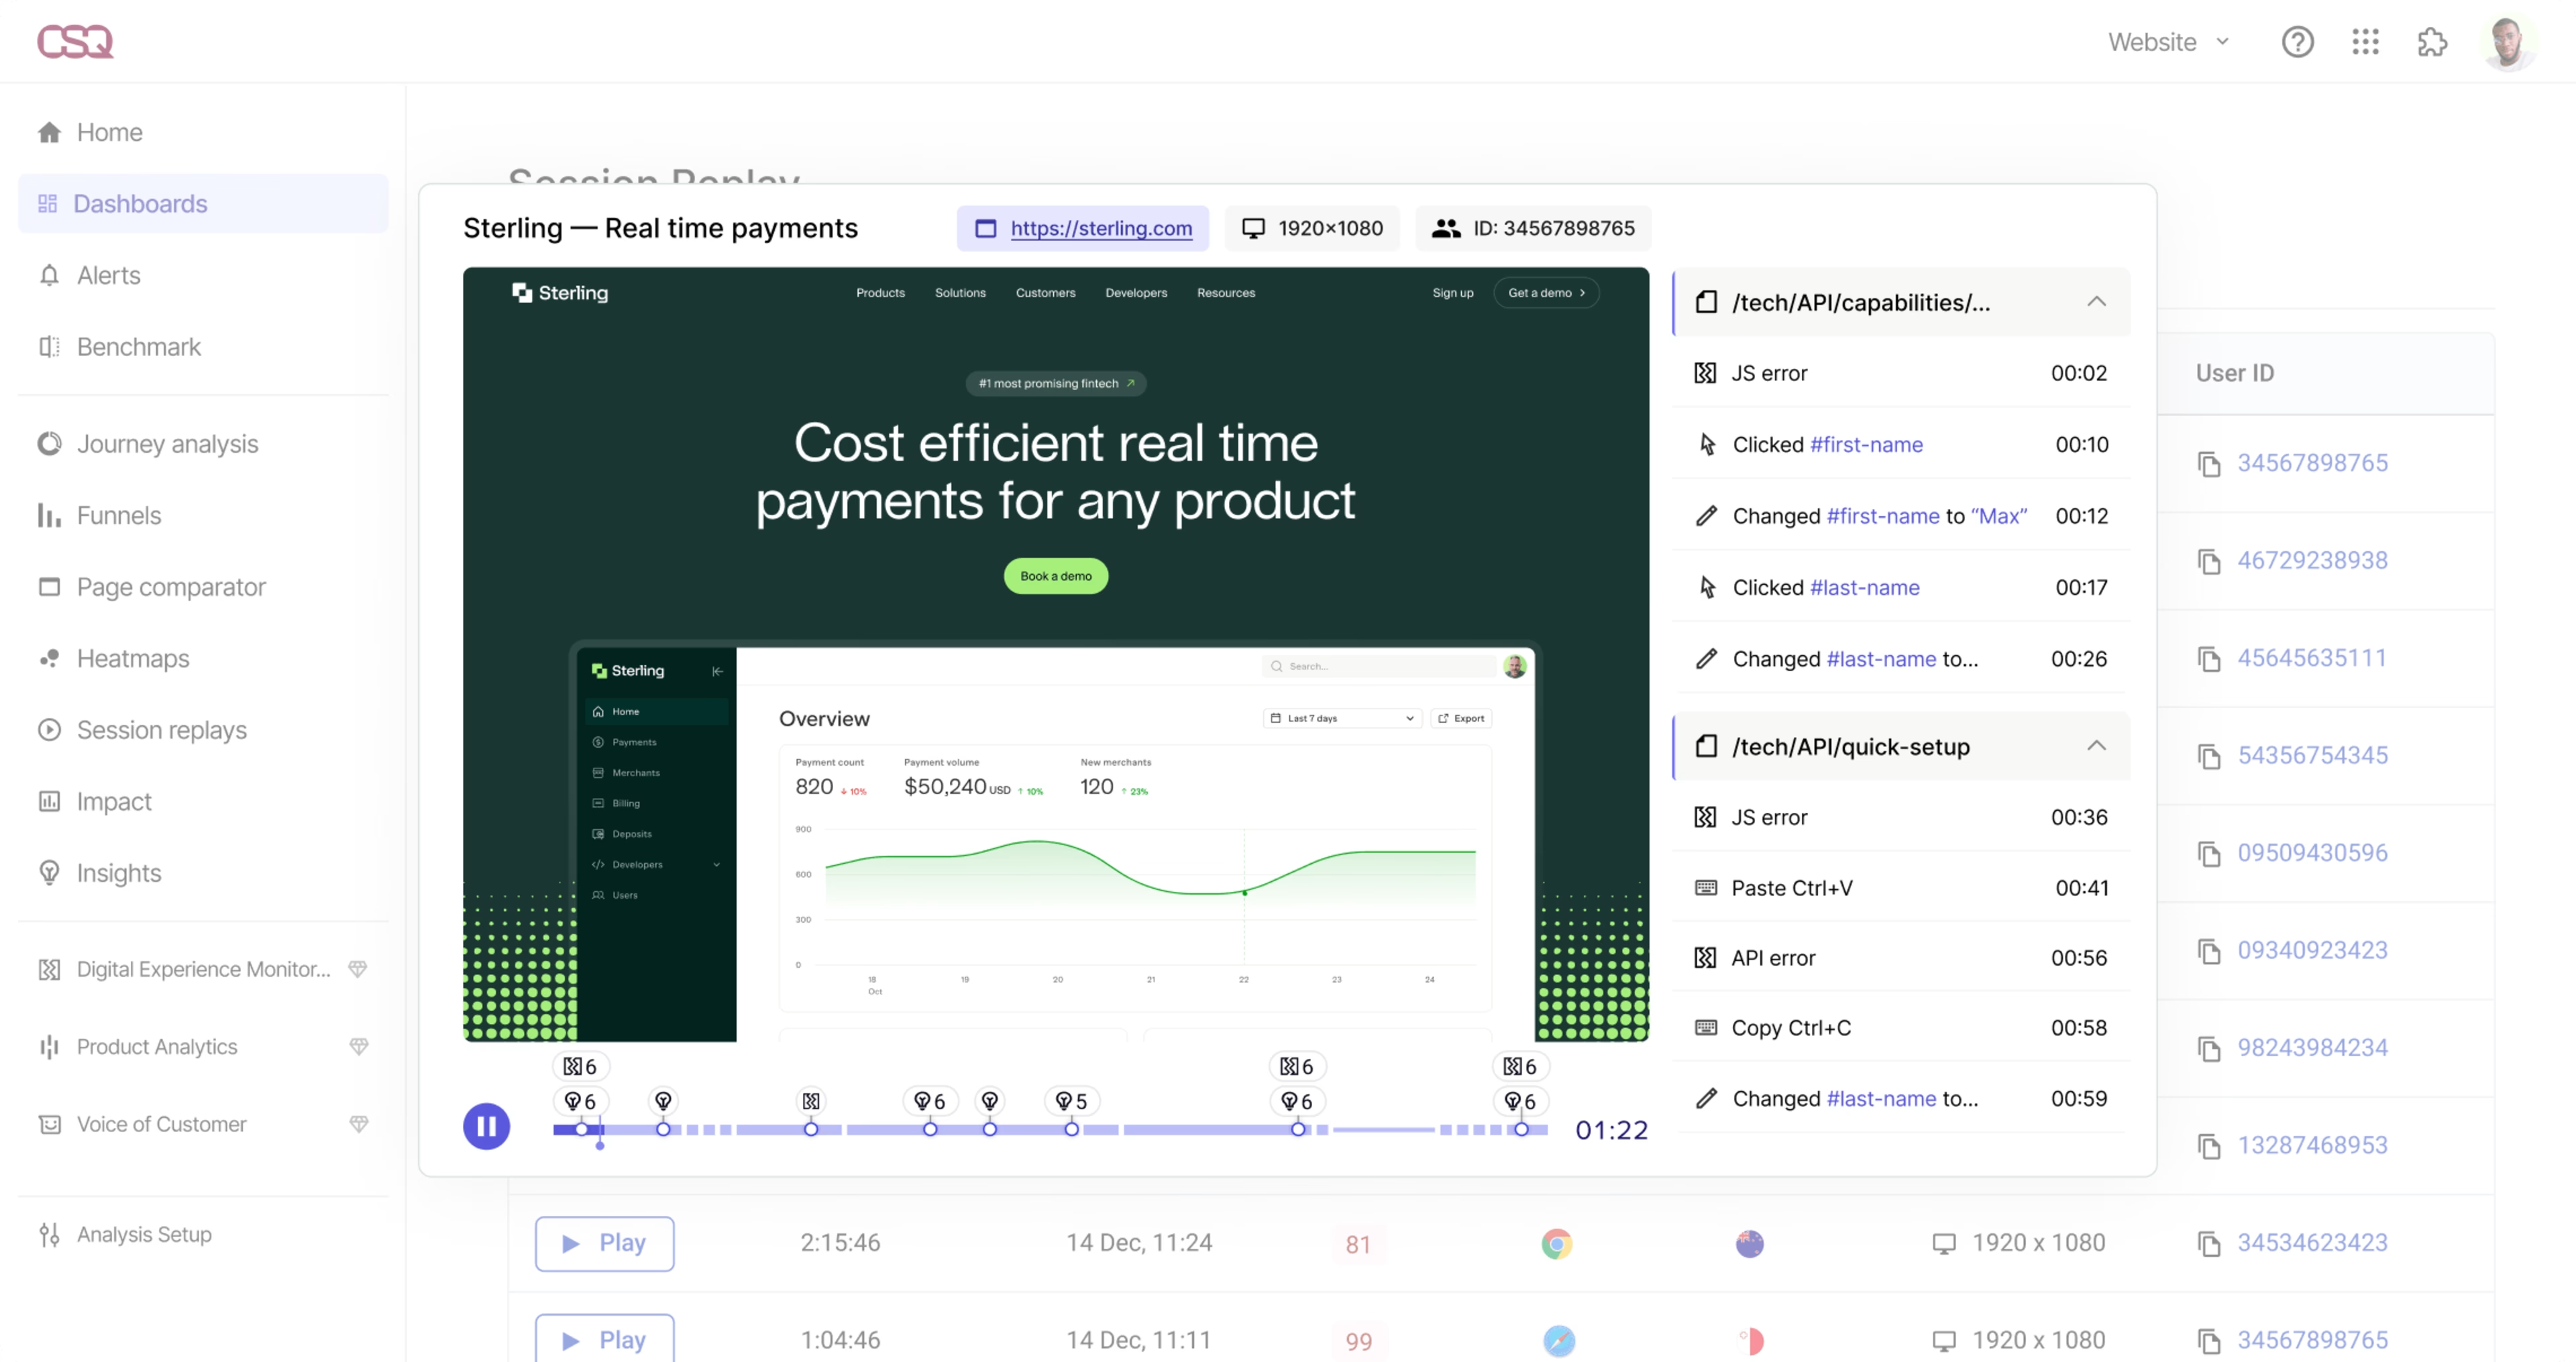
Contentsquare’s Session Replay is like watching over your users’ shoulders as they navigate your product
💡 Pro tip: amplify your designs with AI-driven user feedback.
Use Contentsquare's AI, Sense, to launch a generated survey tailored to goals you’re wanting to achieve—especially useful after rolling out a new UI update.
Then, instead of sifting through endless survey responses, let Senes condense the most common sentiments for you, helping you prioritize which areas of your design need attention.
This automation saves you time while making sure your next design iteration focuses on the issues that matter most to your users.
![[Visual] Analyze survey results](http://images.ctfassets.net/gwbpo1m641r7/6O8MsCFccJDUqYOOsunWQ4/cf98d89665b7e3a33a05b90c8c57a2c9/Contentsquare-Surveys-Results.png?w=3840&q=100&fit=fill&fm=avif)
Sense makes it easy to create surveys and gather feedback that makes your designs even more user-centered
4. Spot issues and know what to fix first
Once your product is live, your attention shifts to monitoring how users interact with your design, and one of your biggest priorities becomes staying ahead of user frustration. You need to know where users are struggling—fast.
Product analytics helps you catch issues early, prioritize the most critical fixes, and avoid design debt down the road. Through insights like drop-off points, rage clicks, and time spent on certain tasks, you uncover where users experience the most problems. This allows you to prioritize fixes and refine your designs with a clear focus on resolving the most pressing issues.
For instance, if you notice users dropping off at a specific point in the checkout process, analytics helps you drill down into the problem and identify the root cause—whether it’s confusing wording, misplaced call-to-actions (CTAs), or something else entirely.
Why it works: by pinpointing and fixing issues early, you address the problems with the greatest negative impact first and ensure your product stays intuitive and user-friendly. This proactive approach keeps users satisfied and minimizes post-launch crises.
How to do it: track funnel conversions to identify drop-off points and then prioritize fixes based on the severity and frequency of the issue. Sense shows you which issues are having the biggest impact on your user base, so you can tackle the highest-priority ones first.
![[Blog] Predictive personalization - Sense frustration IMAGE](http://images.ctfassets.net/gwbpo1m641r7/7CJd1Lbsu5D6mU1Eeyv9TH/f1127c713c342865da1d0ca606b620d9/Session_replays_event_stream.png?w=3840&q=100&fit=fill&fm=avif)
Sense gives you specific suggestions on where to focus your design optimization efforts
💡 Pro tip: let Sense keep an eye on your most important metrics.
Instead of manually sifting through data, tools powered by AI can highlight key areas where users are getting stuck, saving you time and allowing you to focus on the highest-priority fixes.
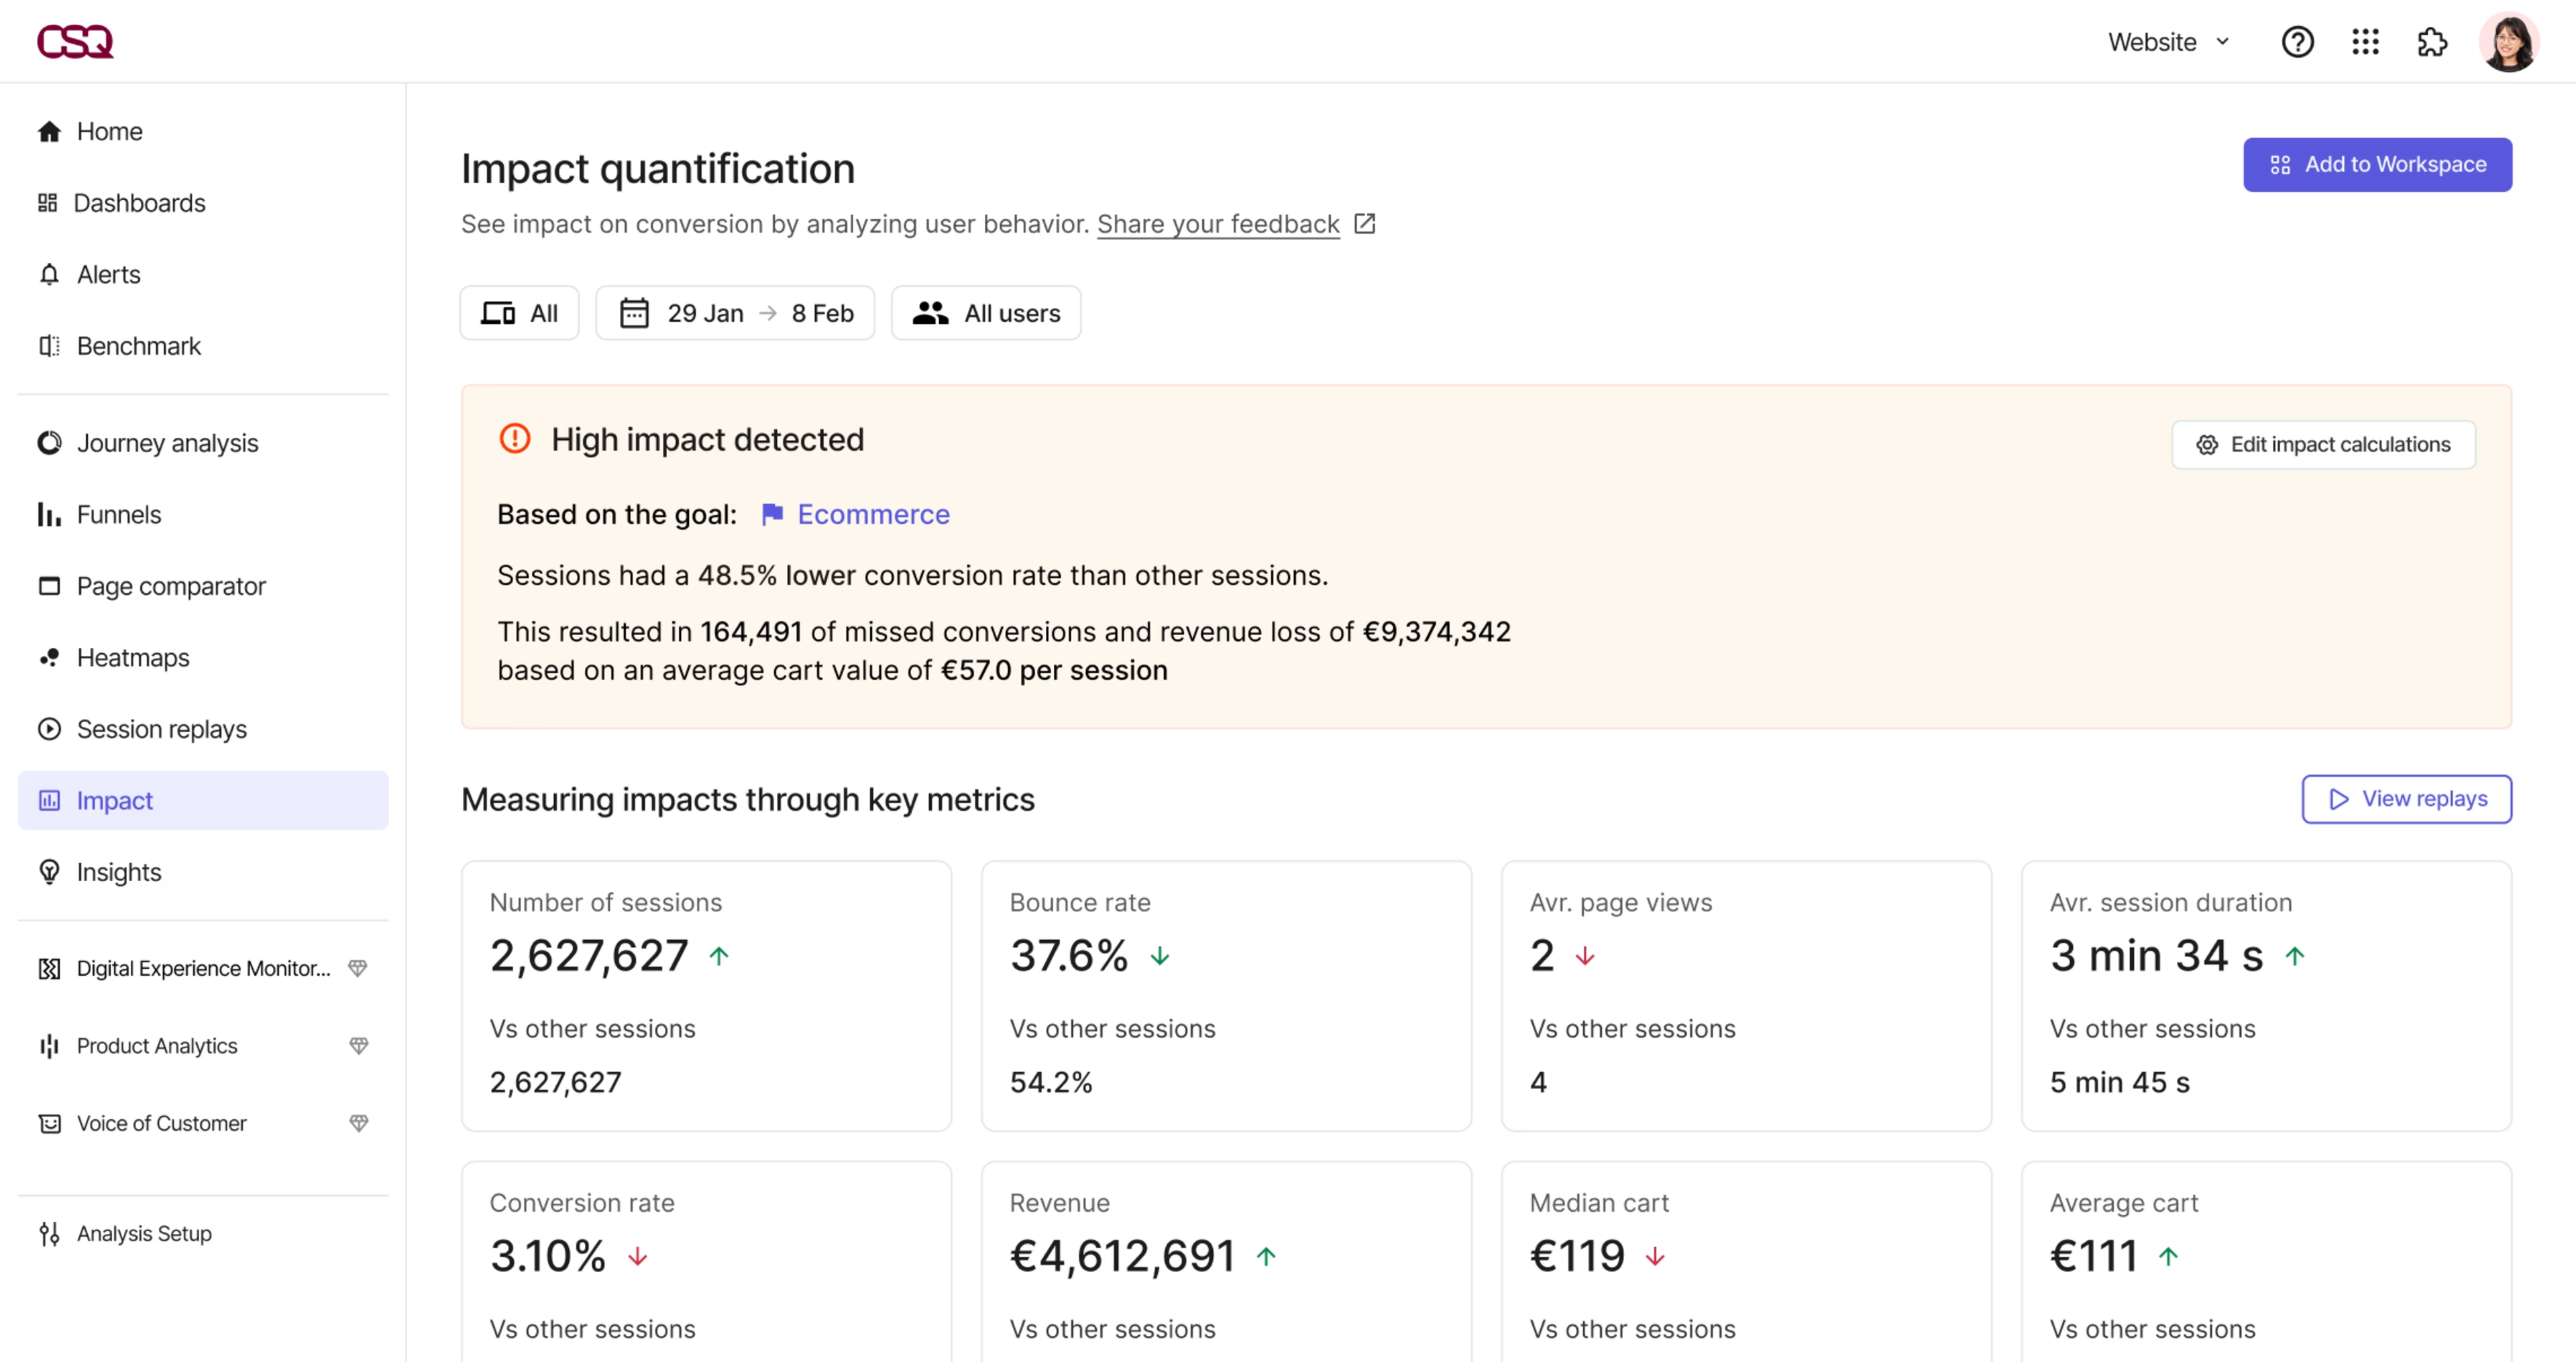
Sense gives you instant, actionable insights, pointing out problem areas so you can address them quickly. Use the platform’s Impact Quantification capability to understand the impact of issues on your conversion rate, revenue, site and app performance—then prioritize which ones to focus on first.
Combined, these capabilities help you proactively improve user experiences, so you’re not constantly reacting to complaints after the fact, keeping your designs friction-free and your users happy.
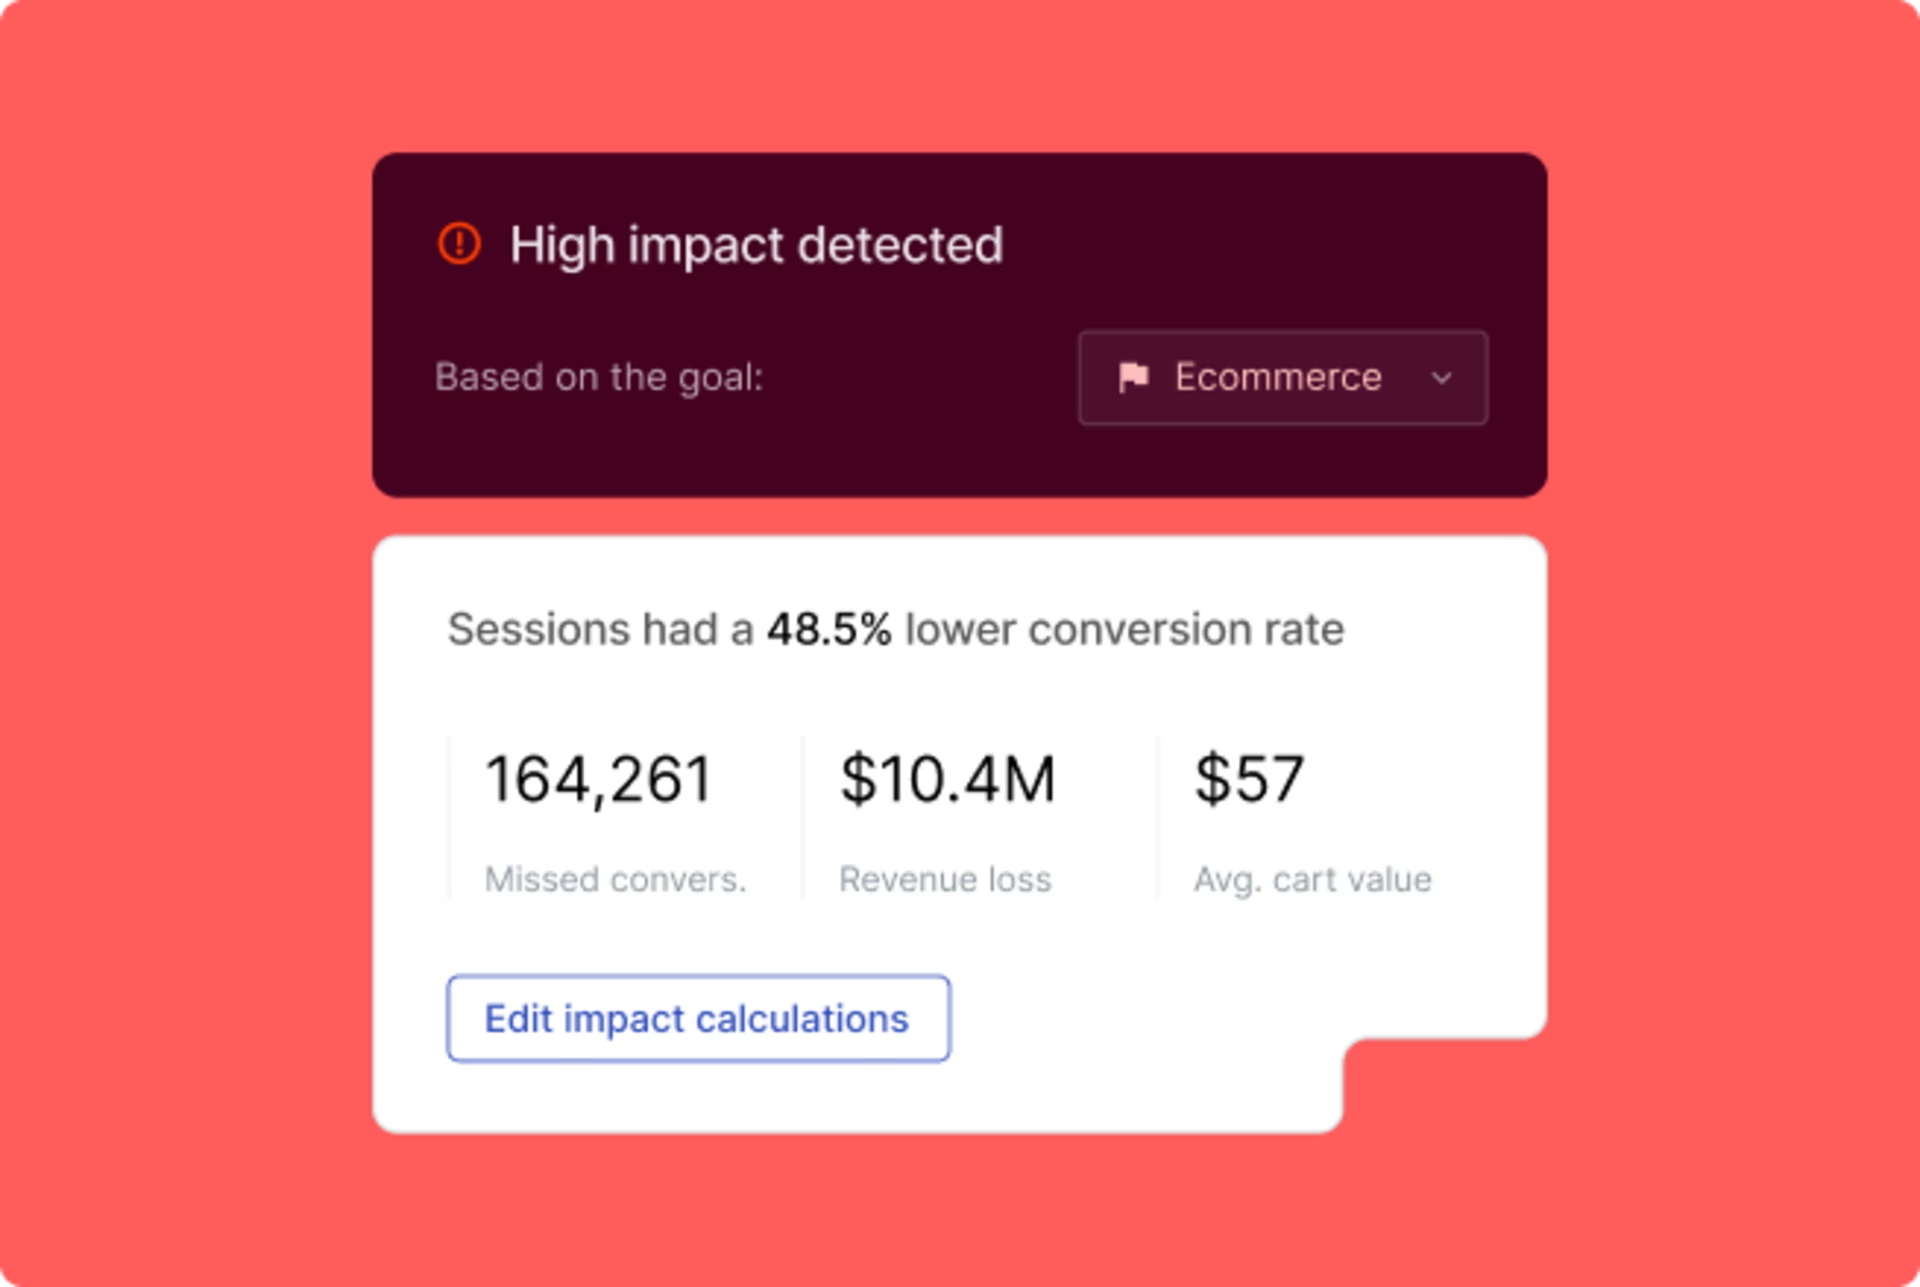
Contentsquare AI helps you identify issues before they become major problems
5. Understand the ‘why’ behind user behavior
Product analytics helps you see which features people use most frequently and drive repeat engagement. This ensures you're investing design resources into areas that actually matter to users. You can even track how long it takes for users to adopt new features, giving you clues on where to improve onboarding or UX flows.
Product analytics data tells you what users are doing, but it also helps you understand why they’re doing it. Whether it’s a minor tweak to your navigation or a full-blown redesign, product analytics uncovers hidden behaviors that guide your design decisions.
For example, you might notice a feature with unexpectedly high usage. This is a great opportunity to dive deeper with capabilities like Session Replay to understand the context behind the behavior.
Why it works: understanding the ‘why’ behind user actions allows you to make smarter design decisions based on real user behavior, not just surface-level metrics. This also provides inspiration for future feature improvements.
How to do it: track which features users interact with the most and pair this with session replays to see real-life user behavior in context. You’ll not only understand which features are popular, but also why users gravitate toward them.
Configure session replays that are relevant to key user actions so you can better understand how those actions are made and optimize pages or journeys to encourage more users to take the same action.
![[Visual] Configure session replay](http://images.ctfassets.net/gwbpo1m641r7/79BbshL9ArlzcriOvdsoON/525c776cf057e163575dbd200e8898b4/Screenshot_2024-11-06_at_11.44.49.png?w=1920&q=100&fit=fill&fm=avif)
Capture all sessions that contain specific behaviors so you can focus on critical user journeys
6. Make your designs work flawlessly on all devices
Today’s users engage with products across multiple devices, from desktop to mobile—and you need to ensure a seamless experience across all platforms.
Product analytics lets you track user interactions across devices, giving you a comprehensive understanding of where the experience is consistent and where it’s breaking down. This helps you design with continuity in mind, offering users a seamless experience no matter where they are.
Why it works: making sure your designs work seamlessly across devices leads to a more cohesive user experience, increasing user satisfaction and retention.
How to do it: set up cross-device tracking to see how users move between mobile and desktop experiences. Then analyze how the design performs on each device and identify areas that might need more optimization for a specific platform.
Here are a few examples of what you can do with product analytics across devices.
What your goal is | How PA helps | How to use it in product design |
Collecting feedback on mobile designs | Analyze and measure the impact of mobile push notifications on user engagement and conversion. | Test different push notification designs to determine which message formats drive the highest re-engagement rates. |
Understanding product adoption and retention | Use retention analysis to determine how product features contribute to long-term user retention. | Tailor feature enhancements or redesigns based on which aspects drive the most sustained user interactions. |
Implementing segmentation and personalization | Analyze user behavior across different segments (like mobile vs. desktop vs. app) | Personalize design elements and improve overall user experience. |
💡Pro tip: use product analytics to measure and analyze customer interactions across all touchpoints and campaigns to see how you can increase customer lifetime value (CLV).
Measure the impact of the designs of all customer experience elements, such as campaigns, content, A/B tests, and features, across sessions and customer milestones. This helps you optimize for long-term value and lower churn.
7. Back up qualitative research with hard numbers
Convincing stakeholders and aligning your team around design decisions is one of the most challenging parts of your job. You need hard data to support your design decisions.
Qualitative research like direct feedback is incredibly valuable for uncovering pain points and understanding user sentiment. But to truly get buy-in for your decisions, you need quantitative data to back it up.
Product analytics help you validate your qualitative findings by showing whether a specific behavior or issue is widespread. For example, if user interviews suggest that new users struggle during onboarding, you can use product analytics to track where drop-offs occur and how widespread the issue is.
Why it works: combining qualitative and quantitative insights helps you make a stronger case to stakeholders, builds confidence in your design decisions, and ensures you’re solving problems that affect a significant portion of your users.
How to do it: segment your users and track their journeys through specific workflows—like onboarding or checkout. Filter the data by user type, device, or engagement level to identify how the behavior varies across different groups. Then, use product analytics to see how their journey through your product compares to other users. This helps you quantify the impact of a particular issue or behavior.
Before presenting your data, use funnel analysis to tie your design choices to business outcomes. By showing how design changes directly affect metrics like user retention or conversion rates, you can more effectively communicate the value of your work to stakeholders.
Contentsquare lets you quantify the impact of certain behaviors on your revenue
💡Pro tip: understand the complete customer journey to streamline UX.
It’s not just about what users do in a single session—it’s about understanding how they interact with your product over time. Contentsquare’s Product Analytics, powered by Heap, enables you to track multi-session behavior, giving you insights that reveal device-specific or page-specific issues your users are experiencing.
For example, you might discover users tend to pause on certain pages or steps, revealing areas where your designs could help streamline the user experience. Use Contentsquare to dive deep into those user journeys to see which segments struggle and where, and get data-driven support for design improvements.
Why Contentsquare is the ultimate platform for product designers
Product analytics is a powerful tool, but when combined with the full suite of Contentsquare’s experience intelligence platform, it becomes a game-changer for product designers.
While product analytics provides valuable data, Contentsquare takes it a step further by offering a range of capabilities and features to help product designers unlock actionable insights and optimize user experiences. Here’s why it’s the go-to platform for product designers at every level:
1. Holistic, user-centric insights: Contentsquare’s Experience Analytics product gives you a complete view of the customer journey, from multi-session behavior to real-time engagement. You’re not just getting snapshots of data—you’re getting the full picture, which is crucial for designing experiences that delight users.
2. Advanced capabilities beyond PA: with capabilities like Session Replay, Error Analysis, Heatmaps, and AI-driven insights, Contentsquare goes beyond traditional product analytics, offering a suite of tools that give you deep, actionable insights. This makes it easier for you to create designs that are not only beautiful but also highly effective.
3. Seamless integration and ease of use: whether you’re integrating with other platforms like Figma or using Contentsquare’s Sense, the platform is built to make your life easier. You can gather insights, iterate designs, and test new features all in one place, without the need for advanced technical knowledge.
Contentsquare helps you create frictionless digital experiences by putting real user insights at the heart of your design process. If you’re not already integrating product analytics and Contentsquare into your daily workflow, now’s the time to start. It’s more than just data; it’s your pathway to creating user-centered designs that actually work.
FAQs about product analytics for product designers
Whether you’re refining an existing design or building something from scratch, product analytics provides solutions to your most critical challenges:
"I don’t understand the complete customer journey." You're likely grappling with incomplete data that fails to show how customers move between devices and sessions. Product analytics solves this by providing cross-session and cross-device journey insights. Whether you're in retail, banking, or media, you can track users across multiple interactions, allowing you to see where users pause, return, or drop out. This can directly impact how you design user flows and improve overall conversions.
"I don’t know how to keep users coming back." Retention is a constant battle. Product analytics capabilities help you pinpoint which features drive the most repeat usage, allowing you to focus on what’s working. For example, a streaming platform might see that users who ‘add to playlist’ are more likely to stay engaged, enabling targeted actions like reminders or push notifications at key moments.
"I need to make sure our investments are paying off." Without clear data, it's hard to justify where to allocate resources. Product analytics offers self-serve access to detailed user behavior data, empowering you to make data-driven decisions. Whether you’re running a retail promo code campaign or trying to optimize a banking app feature, product analytics can show you return on investment (ROI) over time, helping you optimize both customer journeys and business outcomes.
With these insights, you can identify friction points, optimize your designs, and make data-driven decisions to improve the overall user journey.
![[Author] Madalina Pandrea](http://images.ctfassets.net/gwbpo1m641r7/1CsEcp2v6jB6JAqrI9HDBa/76e37b242f67b2f063d657169afc559d/image.png?w=3840&q=100&fit=fill&fm=avif)