
What is a heatmap in web analytics?
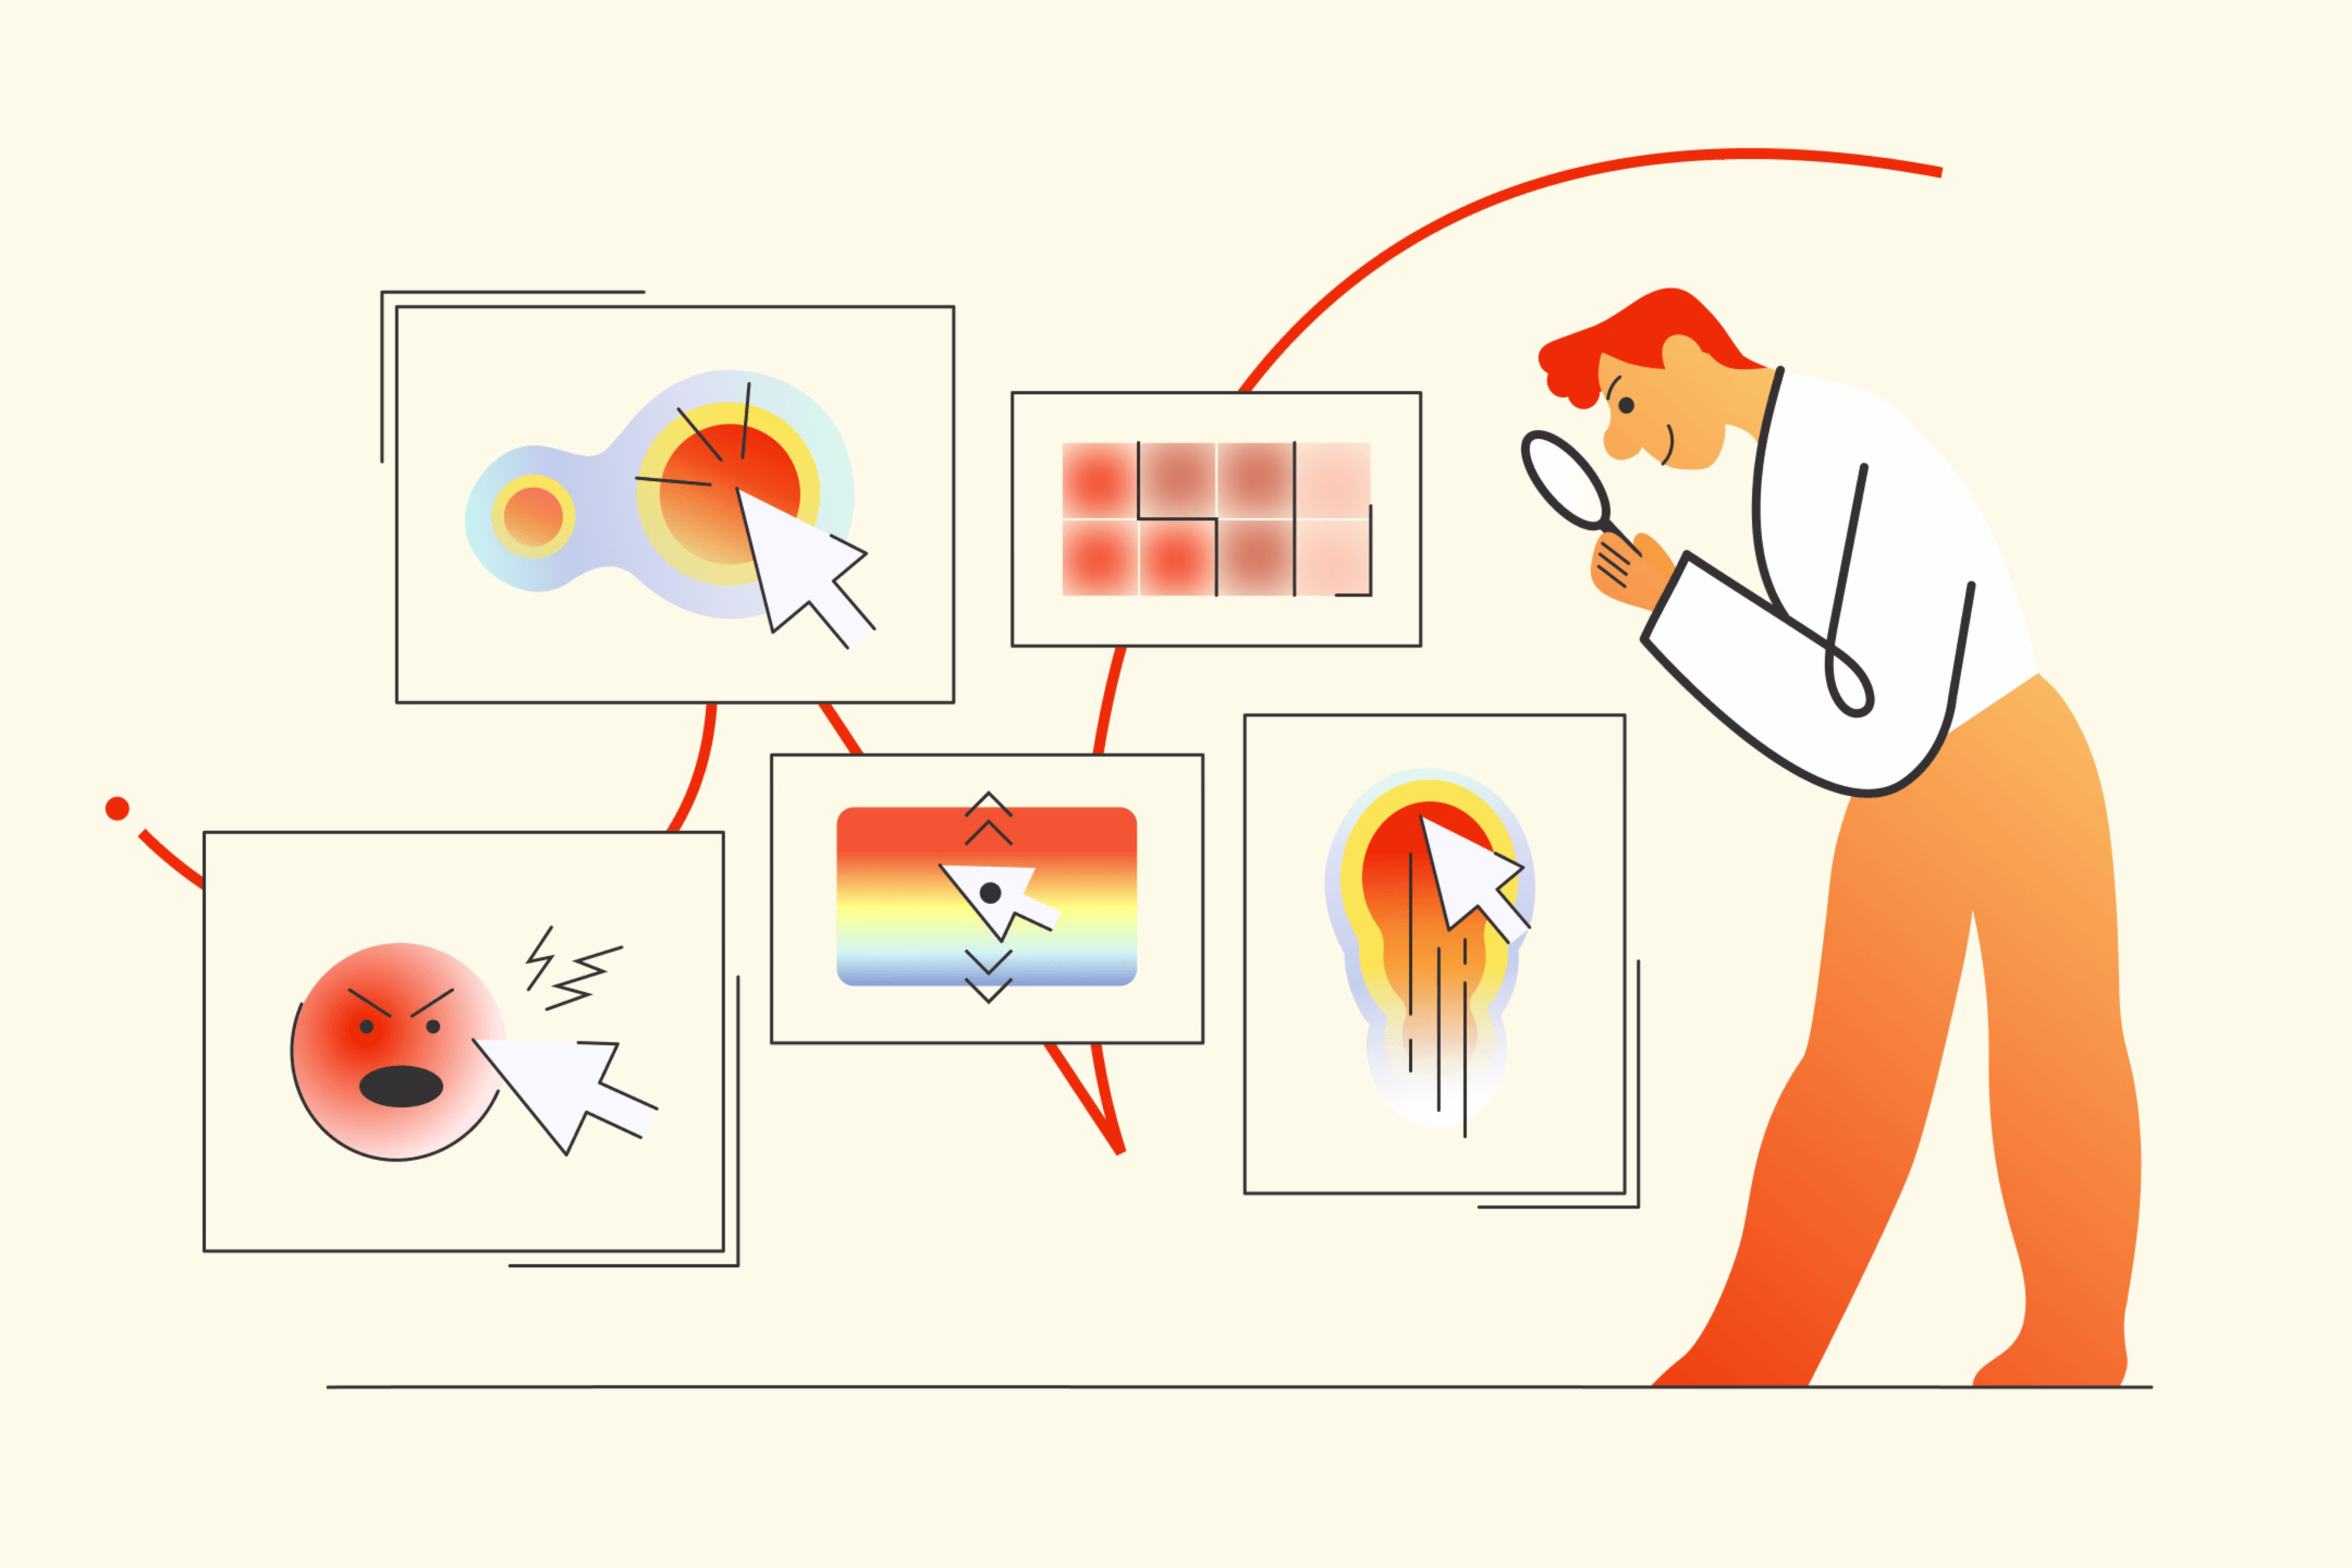
A heatmap in web analytics is a graphical visualization of data where values are depicted as colors. On a webpage, this means showing where users click, scroll, or move their mouse. It transforms abstract numbers into an intuitive visual format.
The core concept: Visualizing user behavior
The core concept behind heatmaps is to visually illustrate user interaction patterns on your website. Instead of reviewing spreadsheets of click data or scroll depths, a heatmap overlays this information directly onto your webpage. Areas of high interaction, such as frequent clicks or long viewing times, appear in “hotter” colors (e.g., red, orange). Conversely, areas with less interaction appear in “cooler” colors (e.g., blue, green). This immediate visual feedback allows for rapid identification of user engagement. Understanding these color-coded cues is crucial for actionable insights.
How heatmaps work: Data collection and representation
Heatmaps function by tracking specific user actions on your website. This data collection typically involves a small piece of JavaScript code embedded on your pages. This script records events such as mouse clicks, scroll positions, and mouse movements. The collected data is then processed and presented as an overlay on your website’s interface. The intensity and color of the overlay correspond directly to the frequency or duration of user interaction in that specific area. Many website heatmaps can display results in near real-time, depending on the tool and traffic volume. This methodical approach ensures that every interaction is cataloged and transformed into a visual metric. This representation makes complex data accessible and comprehensible.
Why are heatmaps essential for web analytics?
Heatmaps are essential because they bridge the gap between raw data and actionable understanding of user behavior. They provide unparalleled insights into how visitors interact with your website.
Uncovering user intent
Heatmaps are powerful tools for uncovering user intent. By visualizing where users click or spend their time, you can infer what content or elements capture their attention and what they are looking for. For instance, repeated clicks on a non-clickable image might indicate that users expect it to be a link. This direct insight into user expectations helps align your website design with user needs and overall usability. Recognizing these patterns is fundamental to improving user satisfaction.
![[Visual] Heatmaps Masthead](http://images.ctfassets.net/gwbpo1m641r7/5fAAF9HNlMTjOZ4Y9CHGsr/81d1526d684694949467928e701b4887/01-Masthead__3_.png?w=3840&q=100&fit=fill&fm=avif)
Identifying friction points
Identifying friction points is another critical application of website heatmaps. Areas where users hesitate, struggle to find information, or ignore key calls to action become evident through heatmap analysis. A scroll heatmap might show users consistently dropping off before reaching important content, while a click heatmap could reveal a lack of interaction with crucial buttons. Pinpointing these obstacles allows for targeted improvements. Resolving these friction points can significantly enhance the user journey and strengthen usability.
Optimizing conversions
Optimizing conversions is a primary goal for any website. Website heatmaps directly contribute to this by highlighting elements that drive conversions and those that hinder them. Understanding which parts of your landing page receive the most attention or which calls to action are overlooked provides clear direction for optimization. You can then strategically adjust content placement, button design, or form fields based on actual user behavior. For example, on a pricing page or during checkout, a click heatmap can reveal confusion or hesitation around key fields, including patterns like dead clicks (clicks on elements users think are interactive, but that don’t respond). This data-driven approach supports CRO and leads to more effective conversion strategies.
5 Types of heatmaps and their applications
Different types of website heatmaps offer unique insights into user behavior. Each type serves a specific purpose, providing distinct perspectives on user interaction.
Click heatmaps Click heatmaps display where users click on your webpage. “Hotter” areas indicate more clicks, while “cooler” areas show fewer clicks. These heatmaps are invaluable for understanding user engagement with interactive elements. They can reveal if your calls to action are effective, if users are trying to click non-clickable elements, or if important links are being overlooked. They are also helpful for spotting dead clicks that indicate confusion or frustration. Use click heatmaps to validate button placement and link visibility.
Scroll heatmaps Scroll heatmaps illustrate how far down users scroll on your pages. They typically use a color-coded gradient to show the percentage of users who view each section of your content. This helps you understand content visibility and identify the “fold”—the point beyond which users often do not scroll. Scroll maps are crucial for determining optimal content placement, ensuring vital information is seen by your audience. Maximize critical content exposure by analyzing scroll patterns and reducing drop-off.
Move heatmaps Movement heatmaps track the path of users’ mouse cursors across your webpage. While not always a direct indicator of eye-tracking, mouse movement often correlates with visual attention. These maps can reveal areas of interest, user hesitation, or how users navigate through content. They provide an additional layer of insight into where users are focusing their attention, even if they aren’t clicking. Leverage movement heatmaps to infer user focus and interaction and improve usability.
Rage click heatmaps A rage click map is a visualization tool used in web analytics that identifies areas on a webpage where users repeatedly and rapidly click out of frustration. These clusters of aggressive clicking typically indicate UX problems such as elements that appear clickable but aren't functional, broken features, slow loading times, or confusing interface design. By highlighting these frustration points, rage click maps help product teams and designers quickly identify and fix pain points in the user experience that are causing confusion or preventing users from completing their intended actions.
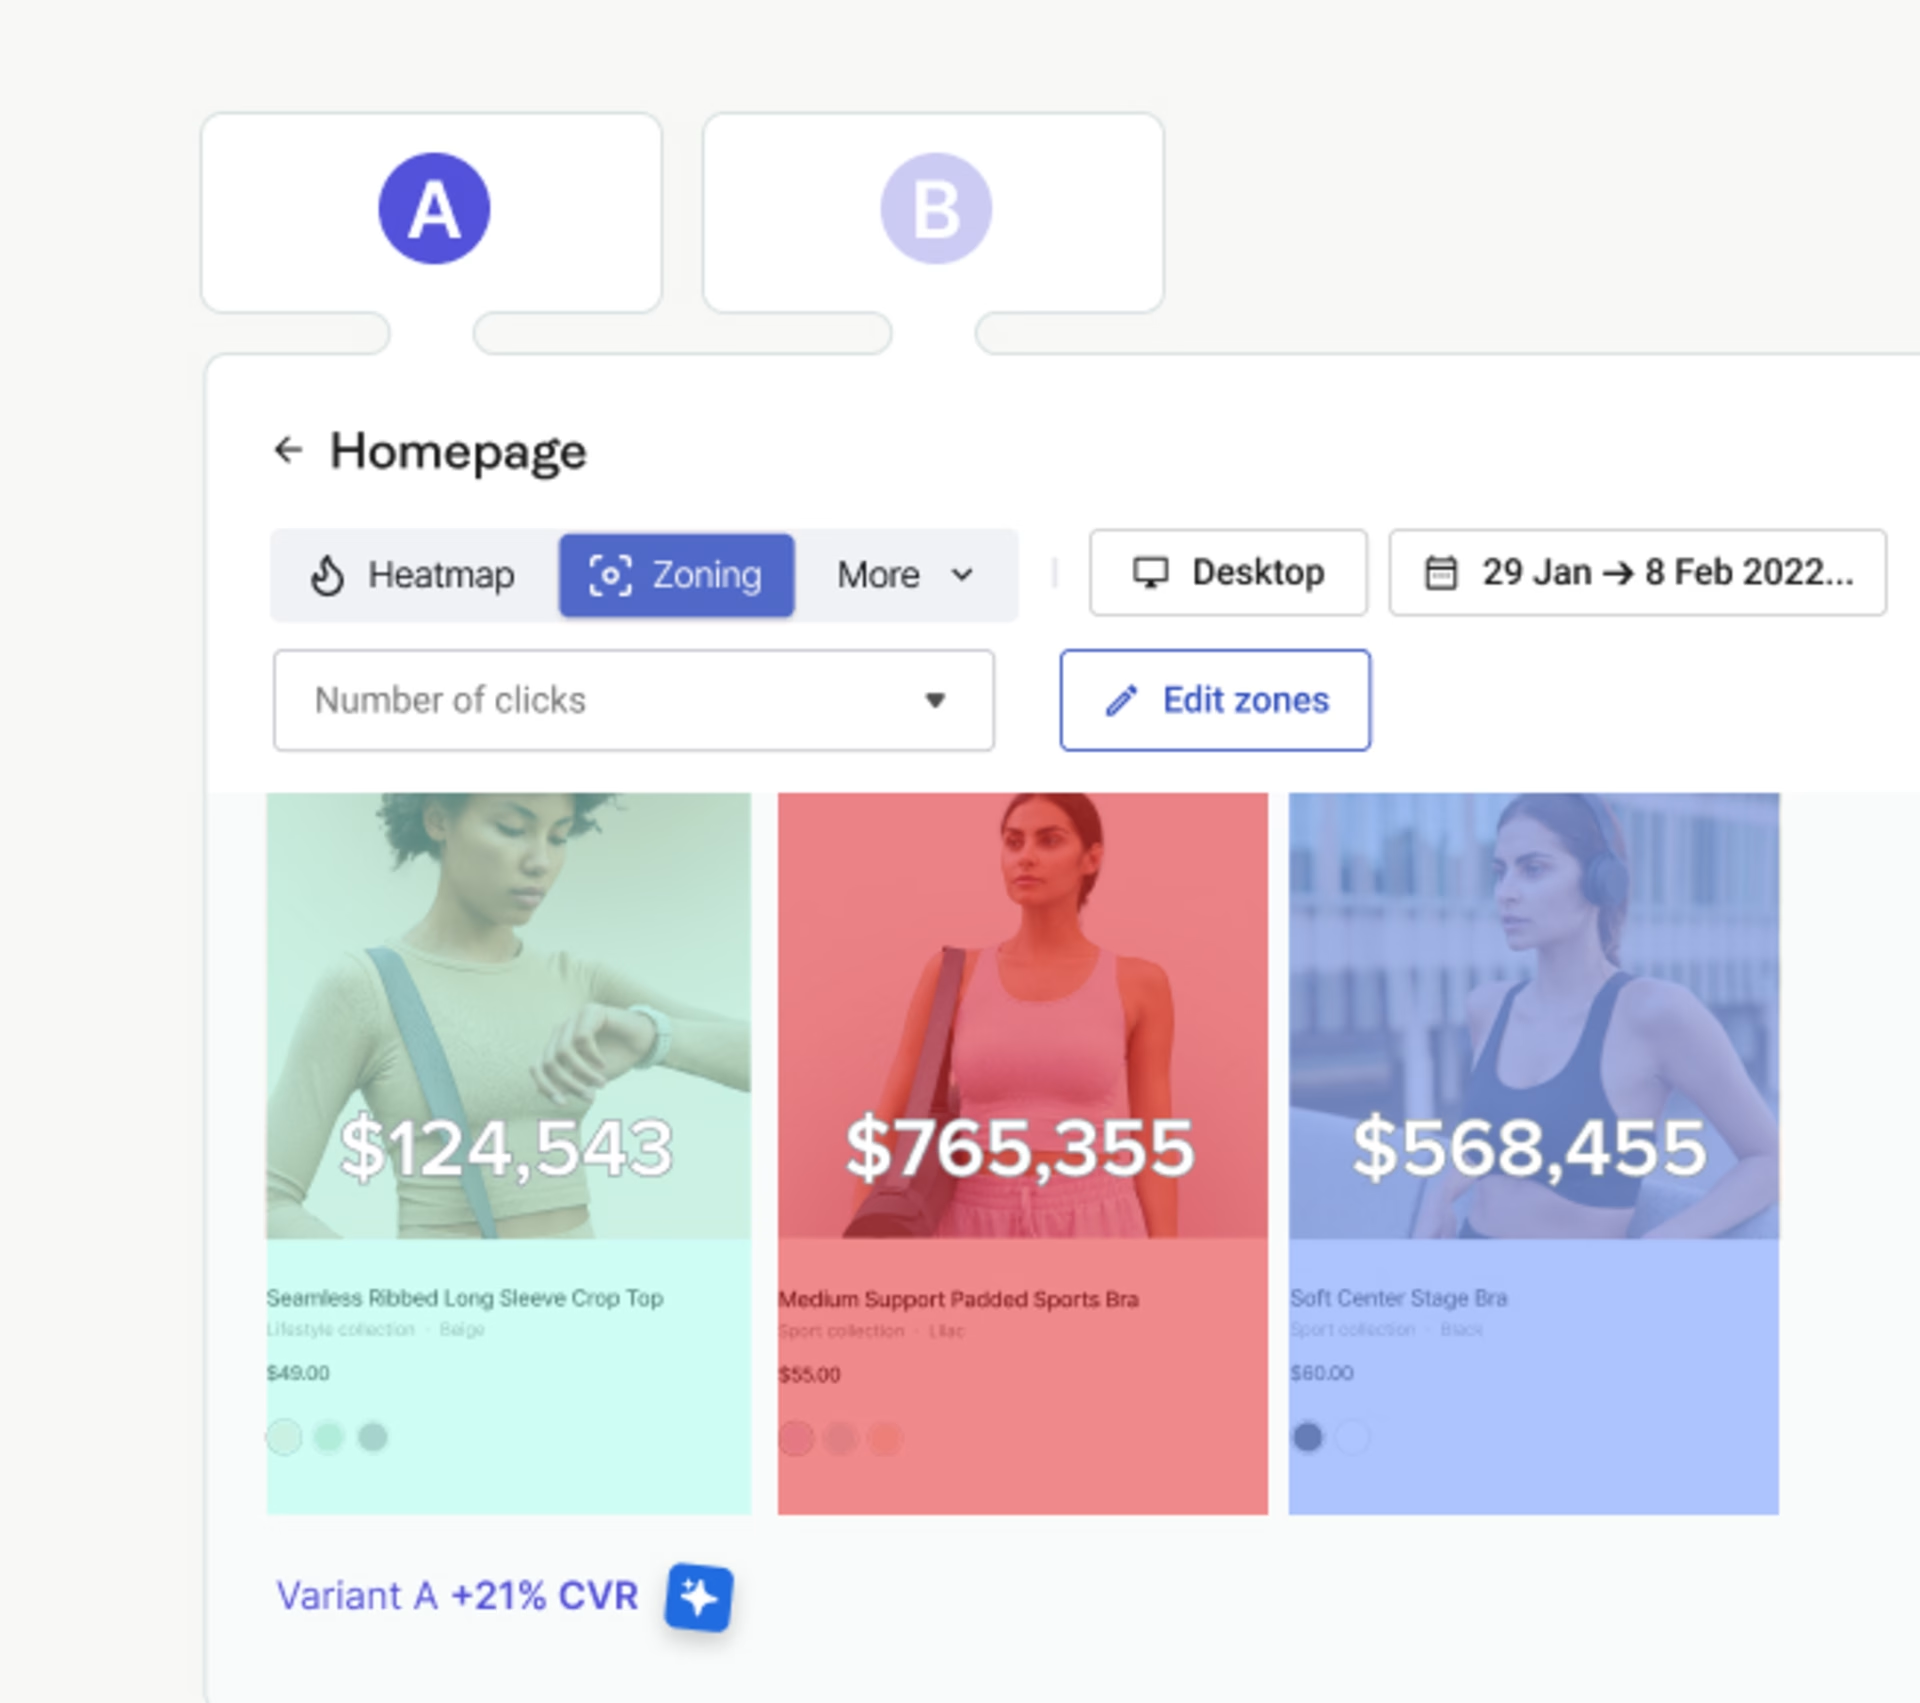
Zone-based heatmaps A zone-based heatmap divides a webpage into predefined sections (header, sidebar, main content, footer, etc.) and measures user engagement within each area. Unlike pixel-perfect click maps, zone-based heatmaps aggregate interaction data at the zone level, showing metrics like click rate or engagement percentage for each section. This makes it easier to compare performance across page areas and understand which zones attract attention versus being ignored, helping teams optimize layouts and prioritize where to position important elements like calls-to-action or key content.
Key benefits of integrating heatmaps into your strategy
Integrating heatmaps into your web analytics strategy offers a multitude of benefits, directly impacting your website’s performance and user experience.
Enhanced user experience (UX) Heatmaps provide direct visual feedback on how users interact with your site, enabling you to identify and resolve UX issues. By understanding where users struggle, get confused, or find elements difficult to use, you can make data-driven improvements to navigation, layout, and content. This leads to a more intuitive and satisfying experience for your visitors. Continually refine your UX with heatmap insights.
Improved conversion rates By highlighting what drives user engagement and what causes friction, website heatmaps are powerful tools for improving conversion rates. You can optimize calls to action, form fields, and content placement based on actual user behavior, leading to more successful conversions. Knowing what resonates with users allows for targeted and effective conversion optimization. Drive higher conversion rates through informed design choices.
Data-driven design decisions Heatmaps replace assumptions with tangible data when it comes to design decisions. Instead of relying on guesswork or personal preference, you can make informed choices about layout, content priority, and interactive elements based on how users actually behave. This scientific approach ensures that design changes are purposeful and effective. Empower your design process with irrefutable data.
Reduced bounce rates Understanding why users leave your site prematurely is crucial. Heatmaps can reveal if users are quickly abandoning pages due to irrelevant content, confusing layouts, or unengaging elements. By addressing these issues based on heatmap analysis, you can create a more compelling experience that encourages users to stay and explore further, thereby reducing bounce rates. Retain more visitors by eliminating points of friction.
A/B testing optimization Heatmaps complement A/B testing by providing qualitative insights that explain why one version performs better than another. Before running an A/B test, heatmaps can help identify potential areas for improvement. After a test, they can explain the user behavior behind winning or losing variants, informing future tests and optimizations. Combine heatmaps with A/B testing for comprehensive optimization.
Choosing the right heatmap tool: essential features to look for
Selecting the appropriate heatmap tool is critical for effective analysis. Consider these essential features to ensure the tool meets your specific needs.
Ease of use and integration A good heatmap tool should be user-friendly, with an intuitive interface that allows for easy setup and navigation. Seamless integration with your existing website platform (e.g., WordPress, Shopify) and other analytics tools is also paramount. Complex installation or cumbersome interfaces can hinder adoption and waste valuable time. Prioritize tools that offer straightforward implementation and operation.
Data accuracy and granularity The accuracy and granularity of the data collected are fundamental. Ensure the tool accurately tracks clicks, scrolls, and movements without significant data sampling or delays. The ability to filter and segment data (e.g., by device, traffic source) provides deeper insights. Precise data is essential for reliable analysis and decision-making. Demand accurate and detailed data for meaningful insights.
Reporting and export capabilities Effective reporting features are crucial for presenting findings and tracking progress. Look for tools that offer clear, customizable reports and the ability to export data in various formats (e.g., CSV, PDF). This allows for easy sharing with stakeholders and integration into broader business reports. Comprehensive reporting capabilities streamline analysis and communication.
Cost-effectiveness and scalability Evaluate the pricing model of the heatmap tool and ensure it aligns with your budget and usage needs. Consider scalability: can the tool handle increased traffic as your website grows, without prohibitive cost increases? Many tools offer tiered pricing based on page views or recorded sessions. Select a solution that offers value now and for future expansion.
Privacy and data security Given the increasing importance of data privacy, ensure the heatmap tool complies with relevant regulations (e.g., GDPR, CCPA). Understand how the tool handles user data, whether it anonymizes information, and what security measures are in place. Prioritize vendors with strong privacy policies and robust data protection. Protect user data with secure and compliant tools.
Implementing heatmaps: A step-by-step guide
Implementing heatmaps effectively requires a structured approach. Follow these steps to ensure you gain maximum value from your heatmap strategy.
Define your objectives Before deploying any heatmap tool, clearly define what you want to achieve. Are you looking to improve conversion rates on a specific landing page? Identify navigation issues? Understand content engagement? Specific objectives will guide your setup, data collection, and analysis. Without clear goals, your heatmap efforts may lack focus. Articulate precise objectives to steer your heatmap strategy.
Select your heatmap tool Based on your defined objectives and the essential features discussed previously, choose the heatmap tool that best suits your needs. Consider free trials to test functionality and integration before committing to a paid plan. A well-chosen tool is foundational to successful implementation. Make an informed selection to optimize your analysis.
Install and configure Once your tool is selected, install the tracking code on your website. Most tools provide clear instructions for this process. Configure the settings according to your objectives, such as which pages to track, how long to collect data, and any specific segments you want to monitor (e.g., mobile users only). Correct installation ensures accurate data capture. Follow installation instructions precisely for reliable data.
Collect sufficient data Heatmaps require a sufficient volume of data to reveal meaningful patterns. Avoid making decisions based on limited interactions. Allow the tool to collect data over a period that represents typical user behavior for your site, which might be days or weeks, depending on your traffic volume. Patience in data collection is key to valid insights. Ensure ample data collection for statistical significance.
Analyze and interpret results This is where the insights emerge. Review your heatmaps, looking for patterns, anomalies, and areas of high or low engagement. Compare different types of heatmaps (e.g., click vs. scroll) to get a comprehensive view. Relate observations back to your initial objectives. What surprised you? What confirmed your hypotheses? Interpret results critically by translating patterns into measurable CRO hypotheses.
Implement changes and test Based on your analysis, formulate hypotheses for improvements. Implement specific changes to your website (e.g., redesign a button, reposition content). Critically, test these changes. Use A/B testing or monitor subsequent heatmap data to confirm if the changes positively impacted user behavior and met your objectives. Iterative improvement is central to optimization. Continuously refine and validate changes through testing.
Common challenges and how to overcome them
While heatmaps offer immense value, challenges can arise. Understanding these and knowing how to overcome them will enhance your heatmap strategy.
Data overload One common challenge is data overload. Heatmaps can generate vast amounts of data, making it difficult to sift through and find actionable insights. Overcoming this: Focus on specific pages related to your defined objectives. Utilize filtering and segmentation features of your heatmap tool to narrow down the data (e.g., analyze only mobile users, or traffic from a specific campaign). Prioritize pages with high traffic or high conversion potential. Establish clear questions before diving into the data to guide your analysis.
Misinterpreting patterns It’s easy to misinterpret patterns without context. A “hot” area might not always be positive (e.g., users repeatedly clicking a non-clickable element out of frustration, creating dead clicks). Similarly, a “cold” area might simply be a less critical part of the page. Overcoming this: Combine heatmap analysis with other analytics data, such as session recordings or Google Analytics behavioral flows. Understand the purpose of each element on your page. Conduct qualitative research, like user interviews, to validate your interpretations. Always seek the “why” behind the “what.”
Actionable insights vs. raw data Heatmaps provide raw data in a visual format. The challenge is translating this visual data into truly actionable insights that lead to concrete improvements. Overcoming this: Don’t just observe; hypothesize. Formulate specific questions based on heatmap observations. “Why are users not clicking this button?” or “What if we move this content higher up?” Then, design experiments (A/B tests) to validate these hypotheses. Always connect your observations to potential changes and measurable outcomes. Focus on generating testable hypotheses from your data.
Integrating heatmaps with other analytics tools
Heatmaps are most powerful when integrated with other web analytics tools, providing a more comprehensive understanding of user behavior.
Google Analytics: A synergistic approach
Google Analytics tells you what is happening on your website (e.g., traffic sources, bounce rates, conversion goals). Heatmaps tell you where and how users are interacting on specific pages. Integrating these tools provides a synergistic approach: Google Analytics identifies problem areas or high-performing pages, and website heatmaps then explain the specific user behavior on those pages. For example, if Google Analytics shows a high exit rate on a product page, heatmaps can reveal if users are struggling with the product images or the “add to cart” button. Use Google Analytics to identify trends and heatmaps for behavioral detail.
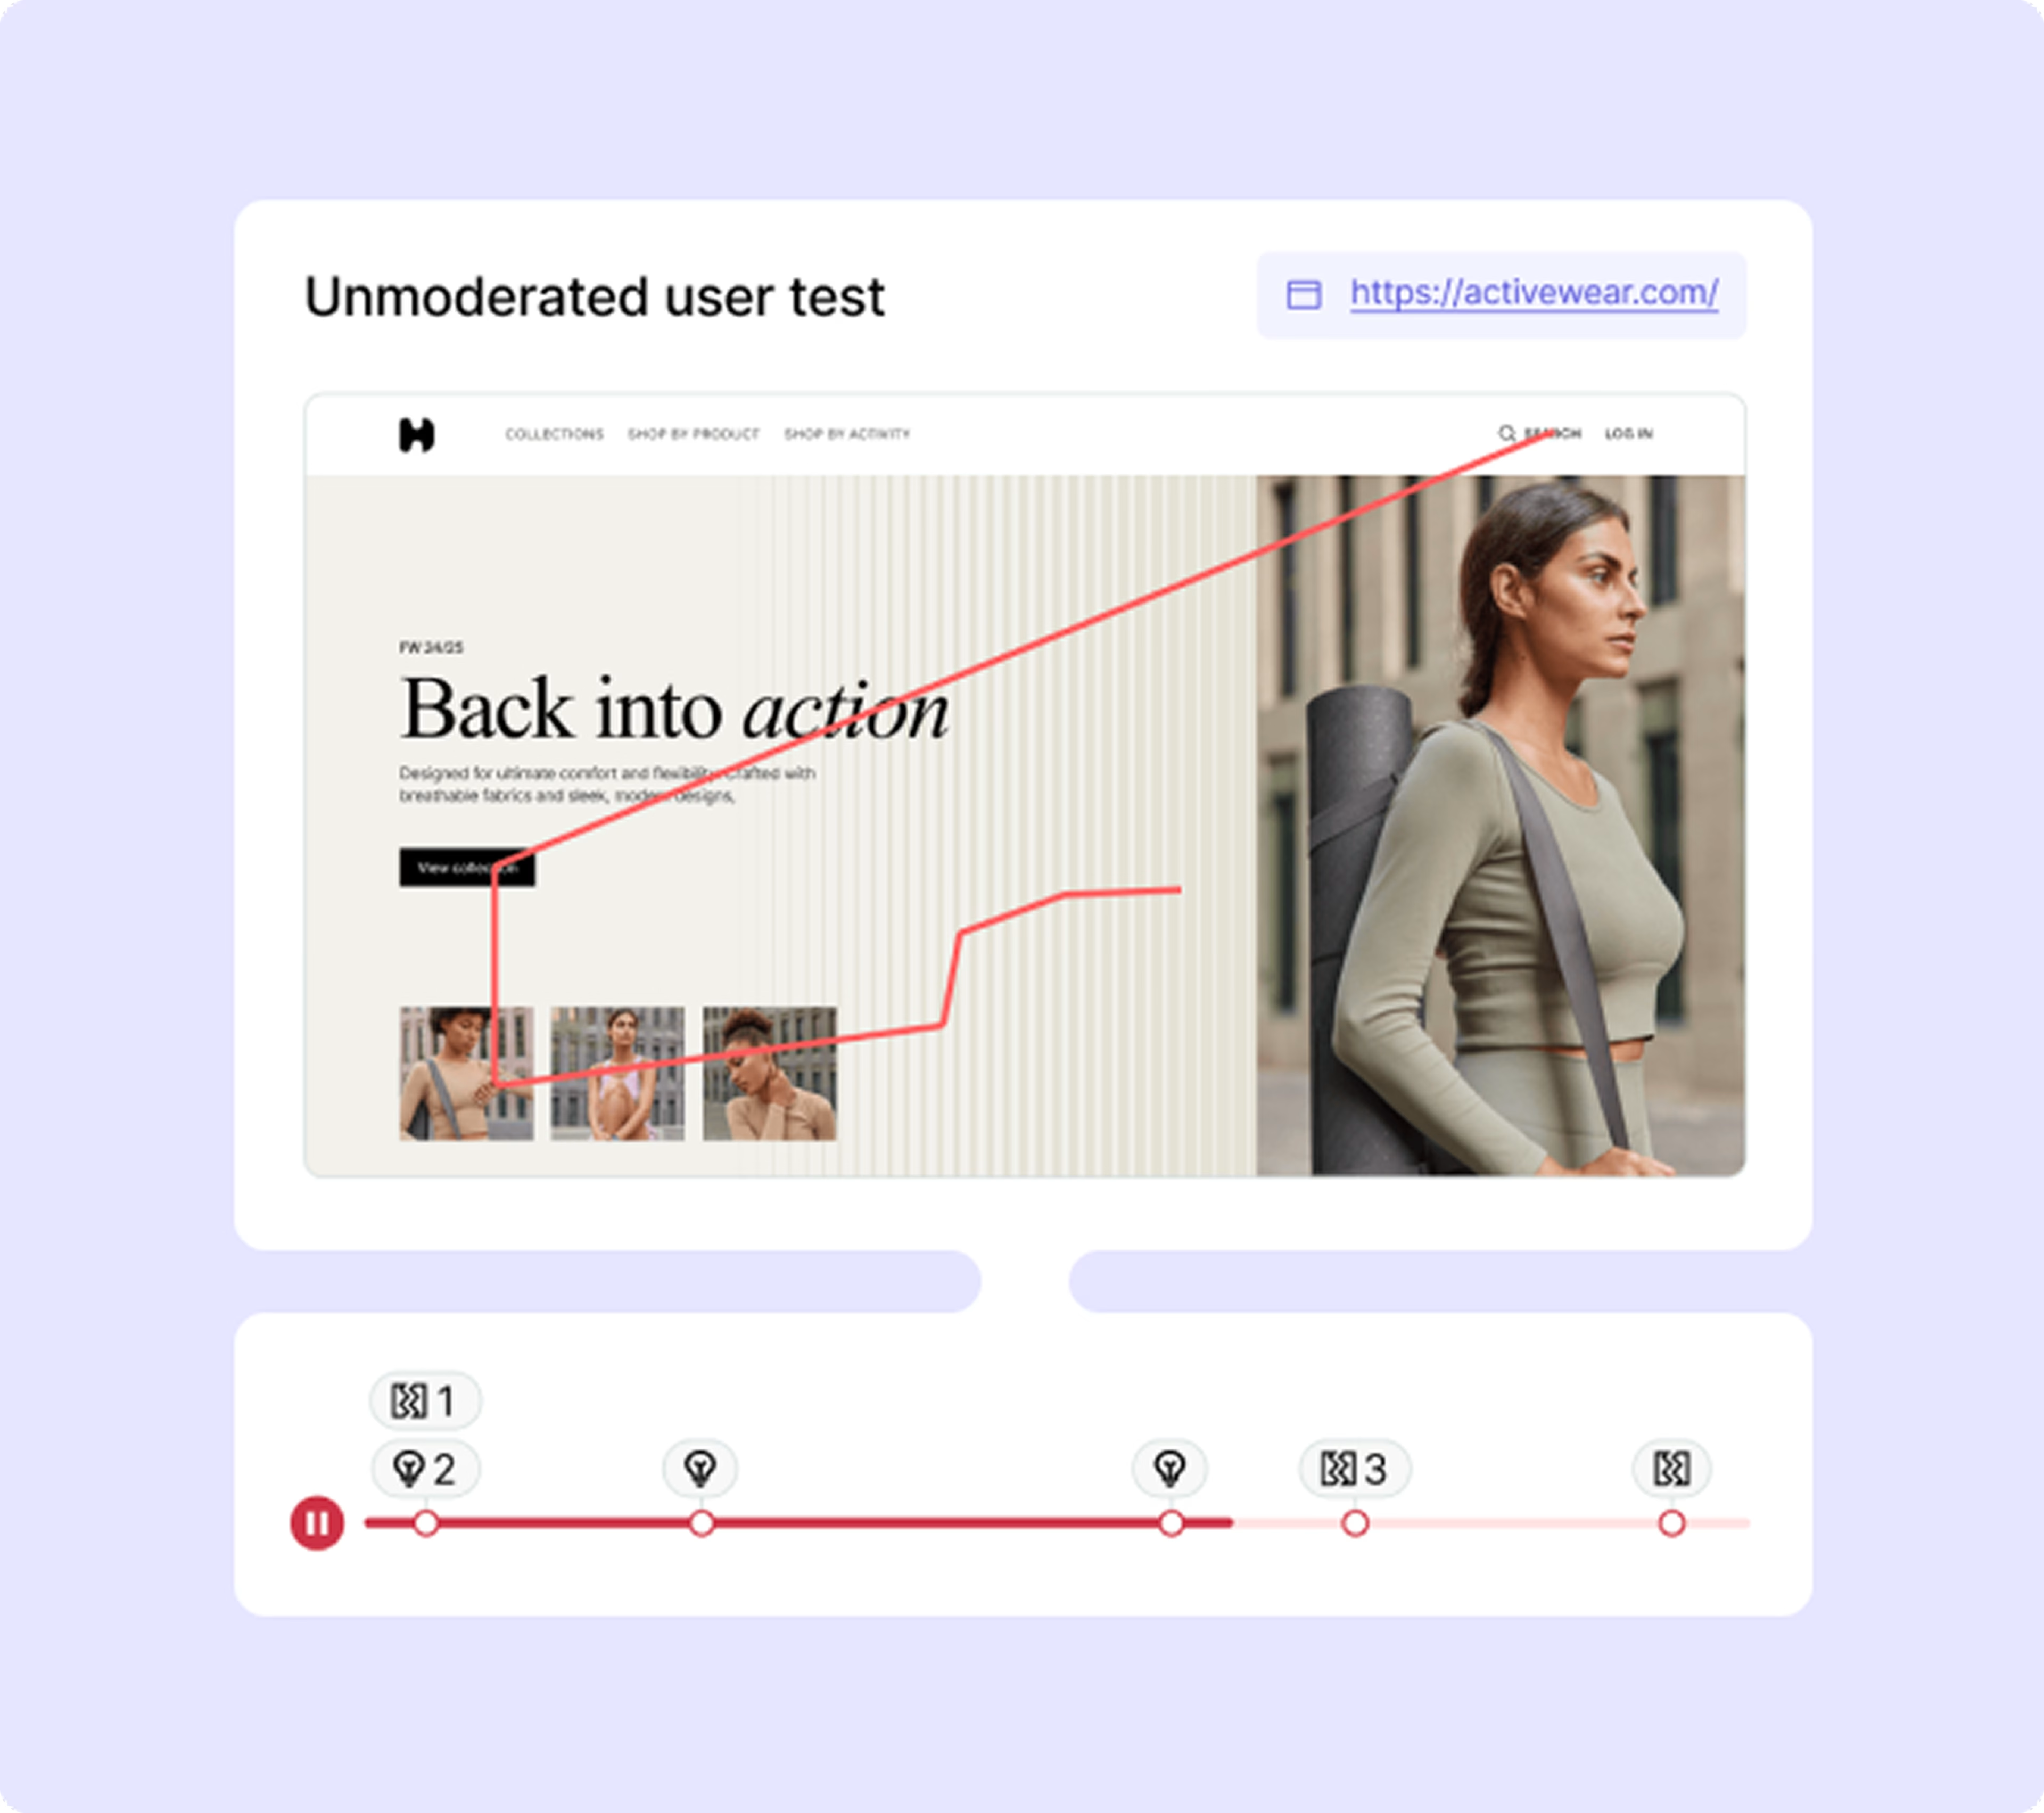
Session replay: Connecting "what" and "why"
Session replay tools record individual user sessions, allowing you to watch exactly how a user navigates, clicks, and scrolls through your site. When combined with heatmaps, session replays connect the “what” (heatmap pattern) with the “why” (individual user journey). If a heatmap shows a high amount of frustration clicks in a particular area, watching session replays of users interacting with that area can provide qualitative context and reveal the root cause of the frustration. This combination offers unparalleled depth in understanding user behavior. Combine session replays with heatmaps for profound behavioral insights.
A/B testing platforms: Validating hypotheses
Heatmaps are excellent for generating hypotheses for A/B tests. They can highlight areas on a page that might benefit from a design change or content adjustment. Once a hypothesis is formed (e.g., “Moving the CTA button above the fold will increase clicks”), an A/B testing platform can be used to validate it. Post-test, heatmaps can also be applied to the winning and losing variants to understand why one performed better than the other, providing further insights for future optimizations. Use heatmaps to inform and analyze your A/B tests.
The future of heatmaps in web analytics
The landscape of web analytics is constantly evolving, and heatmaps are no exception. Emerging technologies will further enhance their capabilities and integration.
AI-powered insights
The future of heatmaps includes more sophisticated AI-powered insights. Instead of simply showing where users click, AI algorithms will analyze heatmap data to automatically identify patterns, anomalies, and potential issues or opportunities. These systems will be able to proactively suggest design changes, predict user behavior, and even explain why certain patterns are occurring without manual interpretation. This will dramatically reduce the time and expertise required for analysis. Prepare for automated, intelligent insights with AI-driven heatmaps.
Predictive analytics integration
Integrating heatmaps with predictive analytics will allow businesses to forecast user behavior and its impact on key metrics. By analyzing historical heatmap data alongside other behavioral metrics, predictive models could anticipate areas of friction before they become significant problems or identify high-potential areas for future optimization. This proactive approach will enable preemptive design improvements, moving from reactive problem-solving to strategic foresight. Leverage predictive insights for proactive website optimization.
Enhanced mobile tracking
With the increasing dominance of mobile browsing, enhanced mobile tracking in heatmaps is crucial. This will go beyond basic touch and scroll tracking to include more nuanced gestures (e.g., pinch-to-zoom, swipe interactions) and device-specific considerations. Advanced heatmaps will provide more precise insights into mobile-specific UX challenges and opportunities, ensuring optimal experiences across all device types. Optimize mobile experiences with next-generation tracking capabilities.
Conclusion: Empowering your website with heatmap intelligence
Heatmaps are invaluable tools for understanding user behavior and optimizing your website. They transform complex data into intuitive visual insights, enabling you to uncover user intent, identify friction points, and make data-driven design decisions. By integrating various types of heatmaps into your web analytics strategy, you can significantly enhance user experience, improve conversion rates, and reduce bounce rates.
The practical benefits are clear: From identifying overlooked content to optimizing calls to action, website heatmaps provide the intelligence needed to refine your online presence continuously. As technology evolves, with AI-powered insights and enhanced mobile tracking on the horizon, the power of heatmaps will only grow.
Do not overlook the profound impact heatmaps can have on your website’s success. Begin implementing heatmaps today to unlock deeper insights into your users and drive meaningful improvements. Take the proactive step to empower your website with this essential intelligence and witness the transformative results.
![[Visual] Contentsquare's Content Team](http://images.ctfassets.net/gwbpo1m641r7/3IVEUbRzFIoC9mf5EJ2qHY/f25ccd2131dfd63f5c63b5b92cc4ba20/Copy_of_Copy_of_BLOG-icp-8117438.jpeg?w=1920&q=100&fit=fill&fm=avif)