![[Visual] Content feedback - stock image](http://images.ctfassets.net/gwbpo1m641r7/3VIxae9gYdfHTaMYr25eph/96af0a02a3248b25f83d10b360591acc/Magic_Oil_-_Photo_4.jpg?w=3840&q=100&fit=fill&fm=avif)
The challenge for many businesses lies not in collecting data, but in translating that data into tangible improvements. Heatmaps serve as a vital bridge. They visually highlight areas of interest, friction points, and opportunities for optimization. This visual clarity enables you to move beyond assumptions, making data-driven decisions that directly impact user experience and business outcomes.
What exactly are heatmaps?
At its core, a heatmap is a graphical representation of data where values are depicted by color. In the context of user experience, heatmaps display the intensity of user engagement on a webpage or application interface. Typically, "hotter" colors like red and orange indicate high engagement, while "cooler" colors like blue and green signify lower interaction. This visual language provides immediate insights into how users are interacting with your digital content.
![[Visual] Heatmaps Masthead](http://images.ctfassets.net/gwbpo1m641r7/5fAAF9HNlMTjOZ4Y9CHGsr/81d1526d684694949467928e701b4887/01-Masthead__3_.png?w=3840&q=100&fit=fill&fm=avif)
The different types of heatmaps and their applications
Understanding the various types of heatmaps is crucial for effective analysis. Each type offers a unique perspective, and combining their insights paints a comprehensive picture of user interaction.
Click maps: These visualize where users click on a page. They reveal which elements attract attention, whether intended or unintended. Are users clicking on non-clickable text? Are your primary calls-to-action (CTAs) being ignored?
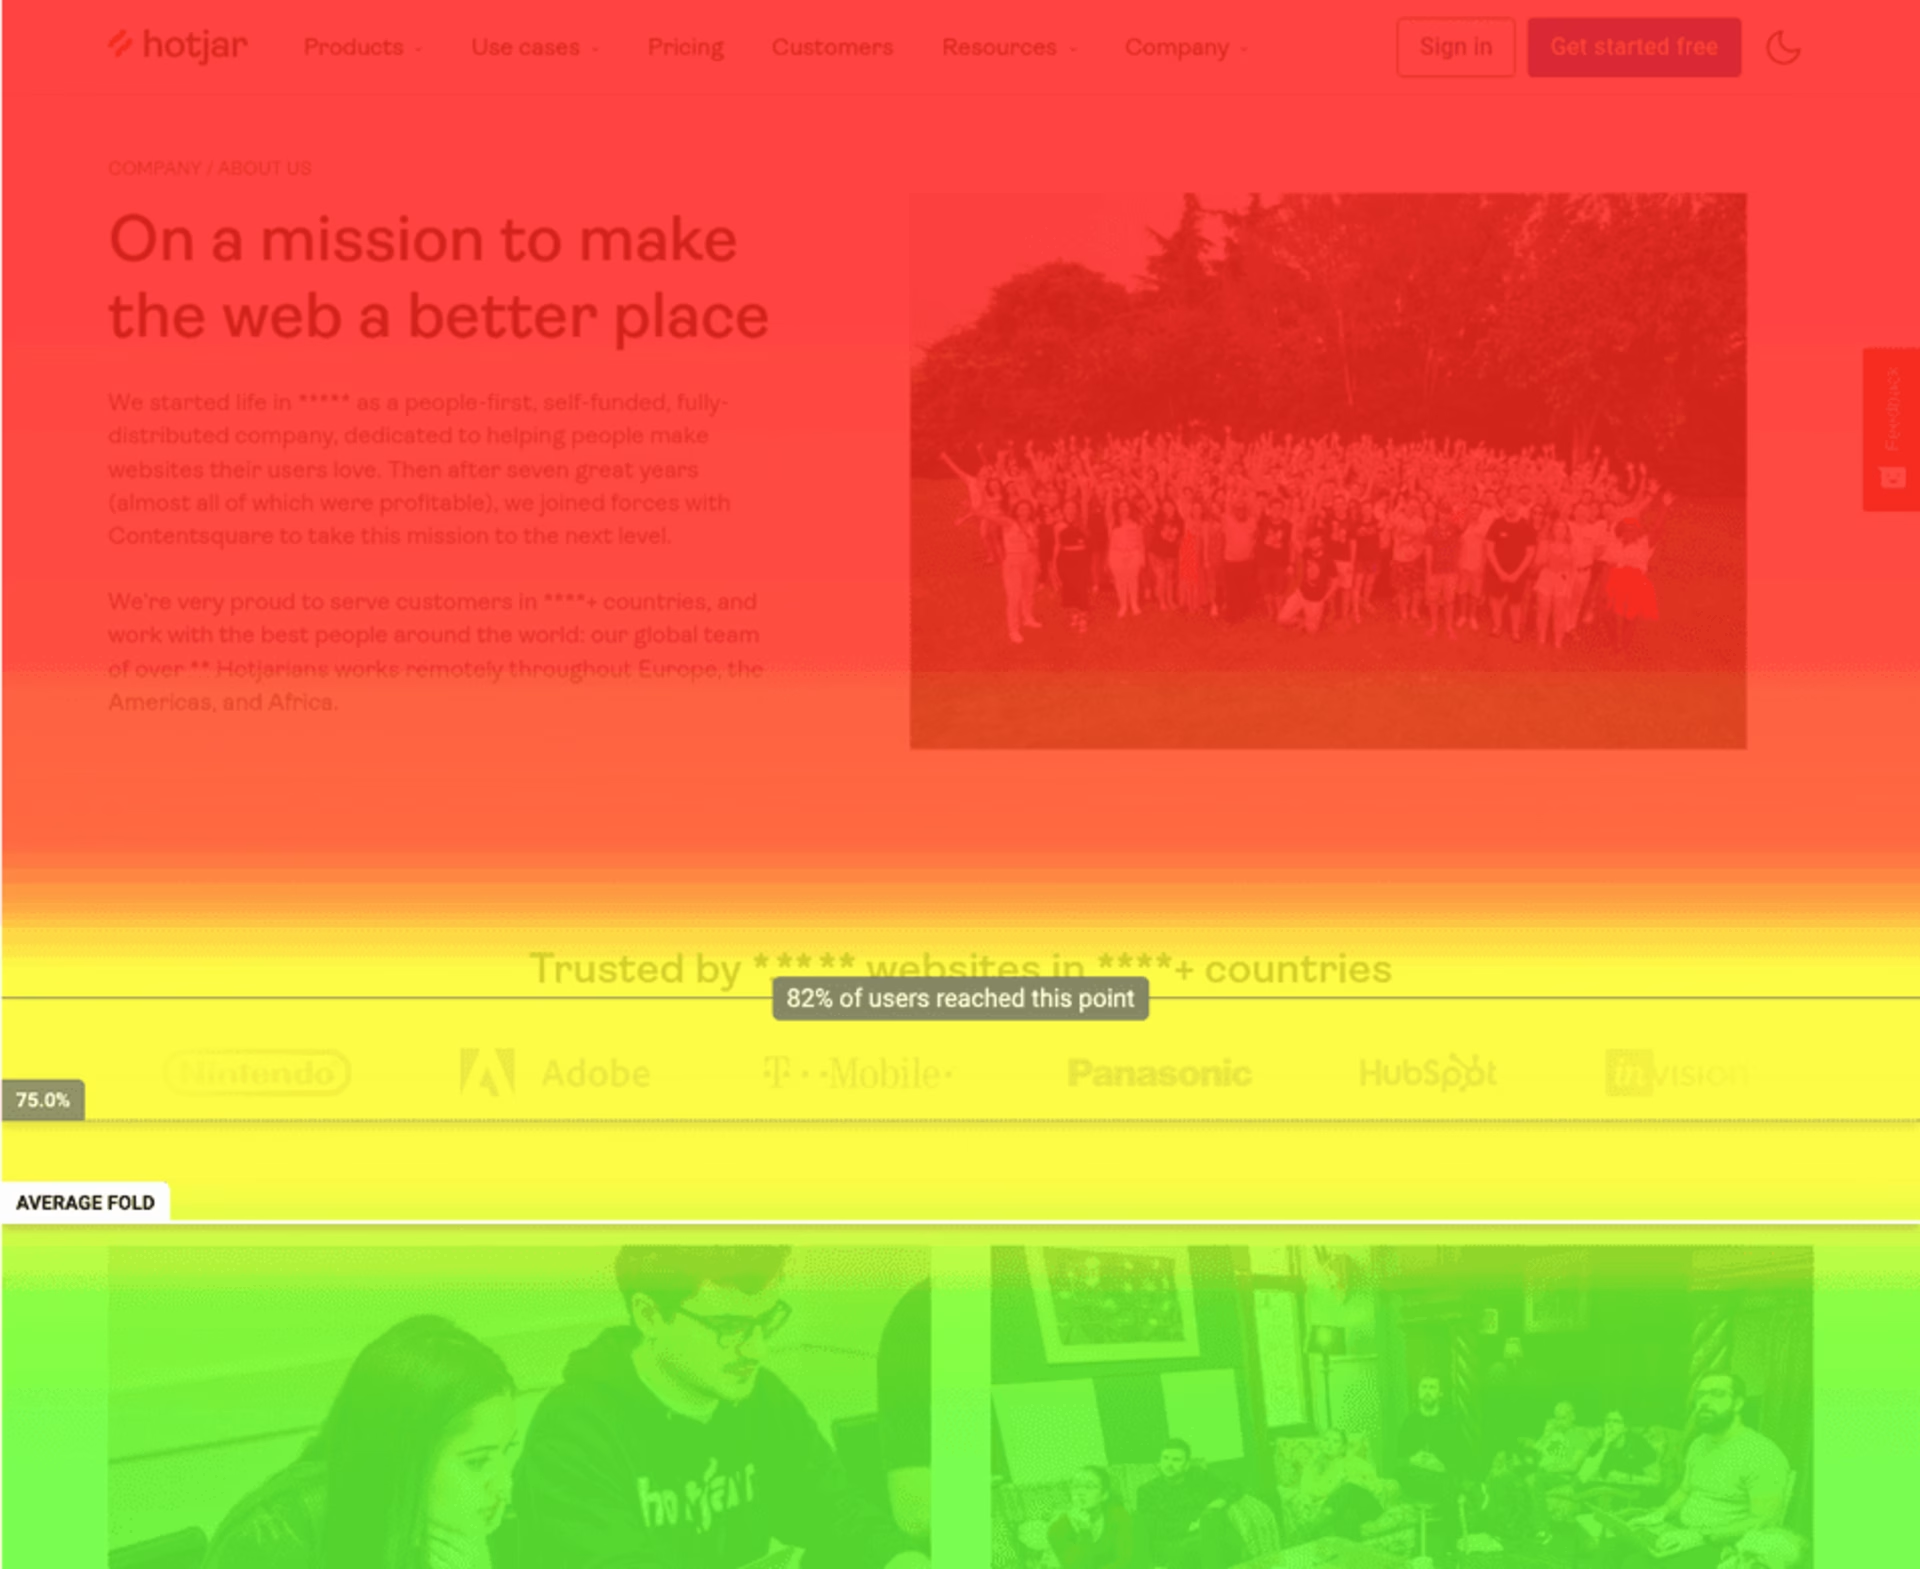
Scroll maps: Scroll maps show how far down a page users scroll. They identify the "fold" – the point beyond which user engagement significantly drops – and highlight content areas that are frequently viewed versus those that are overlooked.
Move maps: These track cursor movements, providing an indication of where users are looking, even if they don't click. Mouse movements often correlate strongly with eye-tracking, offering insights into visual scanning patterns and attention.
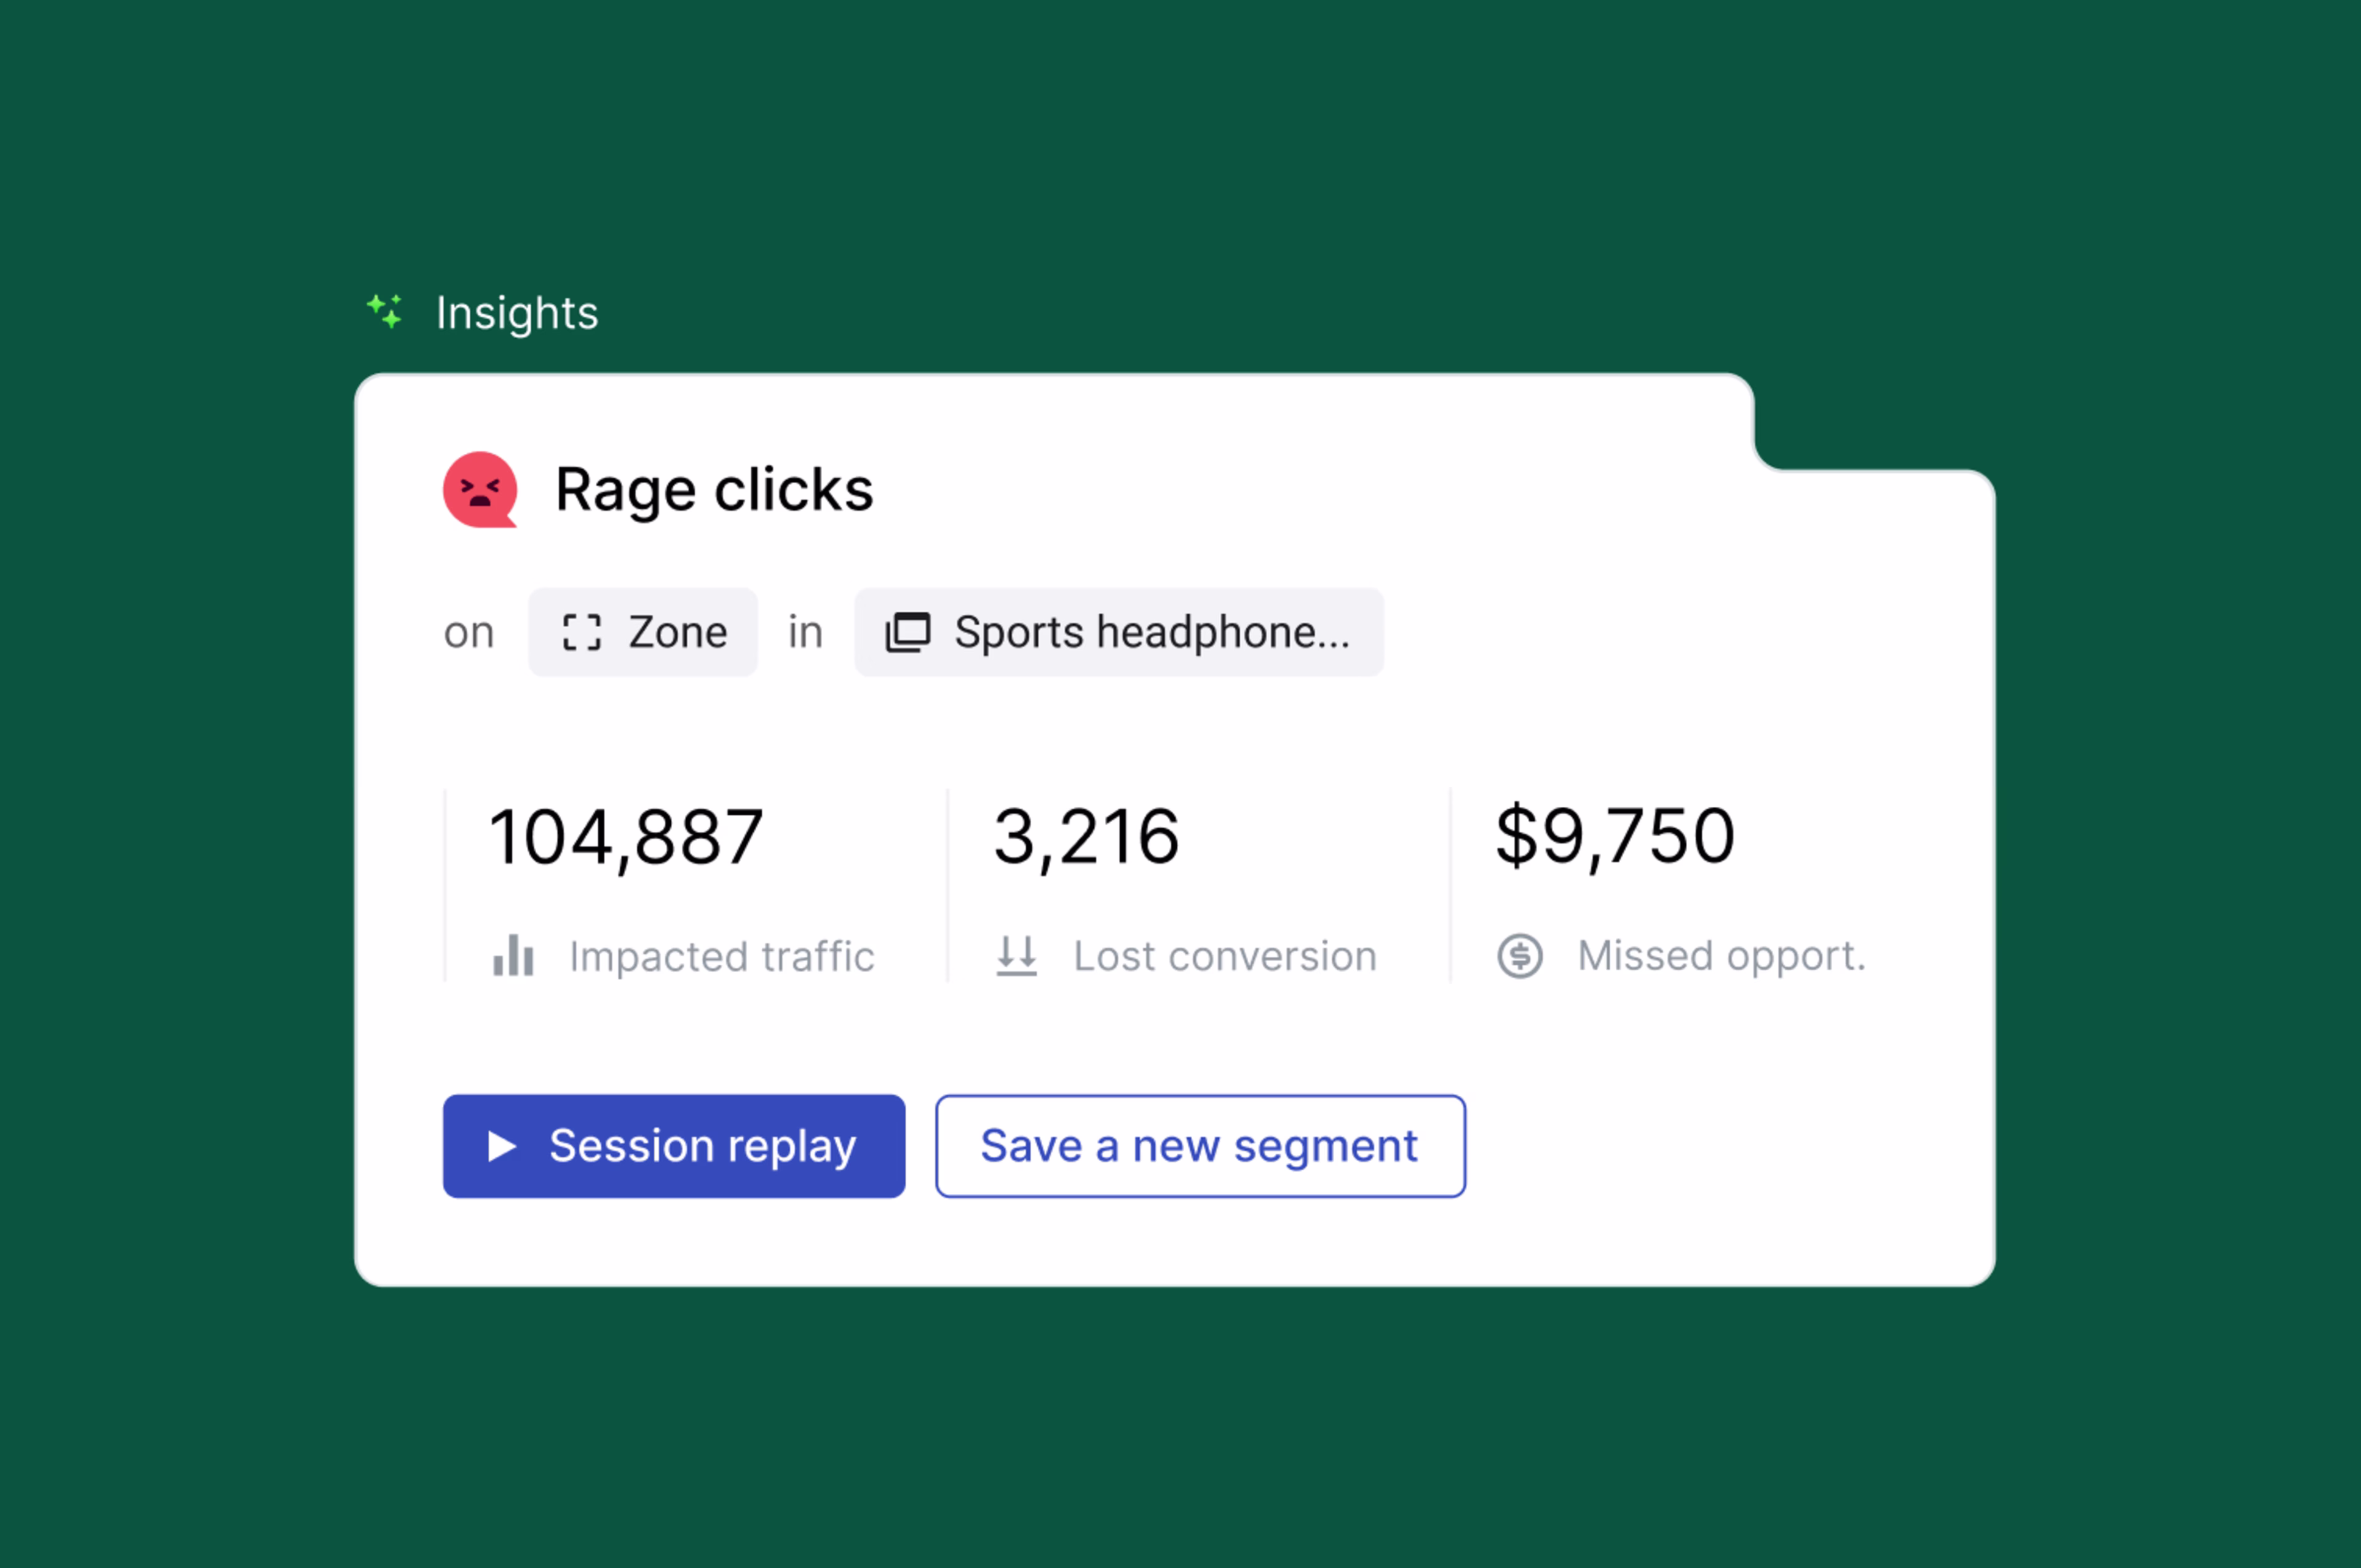
Rage click maps: A rage click map is a type of heatmap, a visualization of aggregate user behavior, that shows you all of the rage clicks on a page.
Zone-based heatmaps: Divide a webpage into specific sections to display detailed interaction metrics, such as revenue and engagement, for each area. This allows teams to quickly quantify the value of individual site elements and make data-driven design improvements.
The foundational principles of heatmap analysis
Understanding color gradients and their significance
The color gradient is the universal language of heatmaps. Red typically signifies the highest concentration of interaction or attention, transitioning through orange and yellow to green and blue, which represent lower levels. It is essential to recognize that while these colors provide a quick visual cue, their significance is relative to the specific page and its content. A "hot" area on a busy homepage might still only receive a moderate number of clicks compared to a niche product page. Always consider the context.
Identifying key patterns and anomalies
Effective heatmap analysis goes beyond simply observing colors; it involves actively looking for patterns and anomalies:
High engagement on key elements: Are your primary CTAs, essential information, and critical navigation elements receiving high attention (red/orange)? This indicates successful user engagement.
Low engagement on crucial areas: Do important sections of your page appear "cold" (blue/green)? This could signal poor visibility, unclear messaging, or lack of user interest.
Unexpected clicks/hovers: Are users clicking on images or text that aren't links? This suggests frustration, a misinterpretation of the interface, or a missed opportunity for interactive elements.
The "fold" effect: Observe scroll maps to identify where users stop scrolling. Content placed below a significant drop-off point might be missed entirely.
Areas of "rage clicking": Repeated, rapid clicks in a small area, especially on non-clickable elements, often indicate user frustration.
8-step guide to interpreting your heatmaps
Define your objective: Before diving into data, clarify what you want to learn. Are you trying to improve conversions, increase content engagement, or troubleshoot a specific user flow?
Select the right heatmap type: Based on your objective, choose the most relevant heatmap (e.g., click map for CTA performance, scroll map for content visibility).
Review the overall engagement: Start with a high-level view. What areas are "hot" or "cold"? Do these patterns align with your design intentions?
Focus on key elements: Examine the engagement on your primary CTAs, navigation, forms, and critical content sections. Are they performing as expected?
Identify anomalies and friction points: Look for unexpected clicks, low engagement on important sections, or areas of high frustration (e.g., rage clicking).
Formulate hypotheses: Based on your observations, develop hypotheses about why users are behaving in a certain way. For example: "Users aren't clicking the 'Download' button because it blends into the background."
Propose and prioritize changes: Brainstorm specific design or content adjustments to address the identified issues. Prioritize changes based on potential impact and effort.
Test and validate: Implement your changes and then run new heatmaps to see if your adjustments have led to improved user behavior. This iterative process is key to continuous optimization.
3 common heatmap scenarios and their interpretations
1. Low engagement on crucial CTAs: What does it mean?
A "cold" CTA on a click map is a clear warning sign. It could mean:
Visibility issues: The button might be too small, the color contrast is poor, or it's buried below the fold.
Confusing messaging: The call-to-action text isn't clear or compelling enough.
Placement problems: The CTA is positioned in an illogical place within the user journey.
Lack of trust/motivation: Users aren't convinced to take the next step.
Action: Experiment with button size, color, placement, and persuasive copy.
2. Unexpected scrolling behavior: Uncovering content issues
If your scroll map shows a sharp drop-off before users reach critical content, consider:
Content overload: Too much information above the fold might overwhelm users.
Irrelevant introduction: The initial content doesn't immediately grab user interest.
Lack of visual cues: No clear indicators that more valuable content exists below.
Action: Prioritize key information, refine your opening statements, and use visual cues (e.g., arrows, partial images) to encourage scrolling.
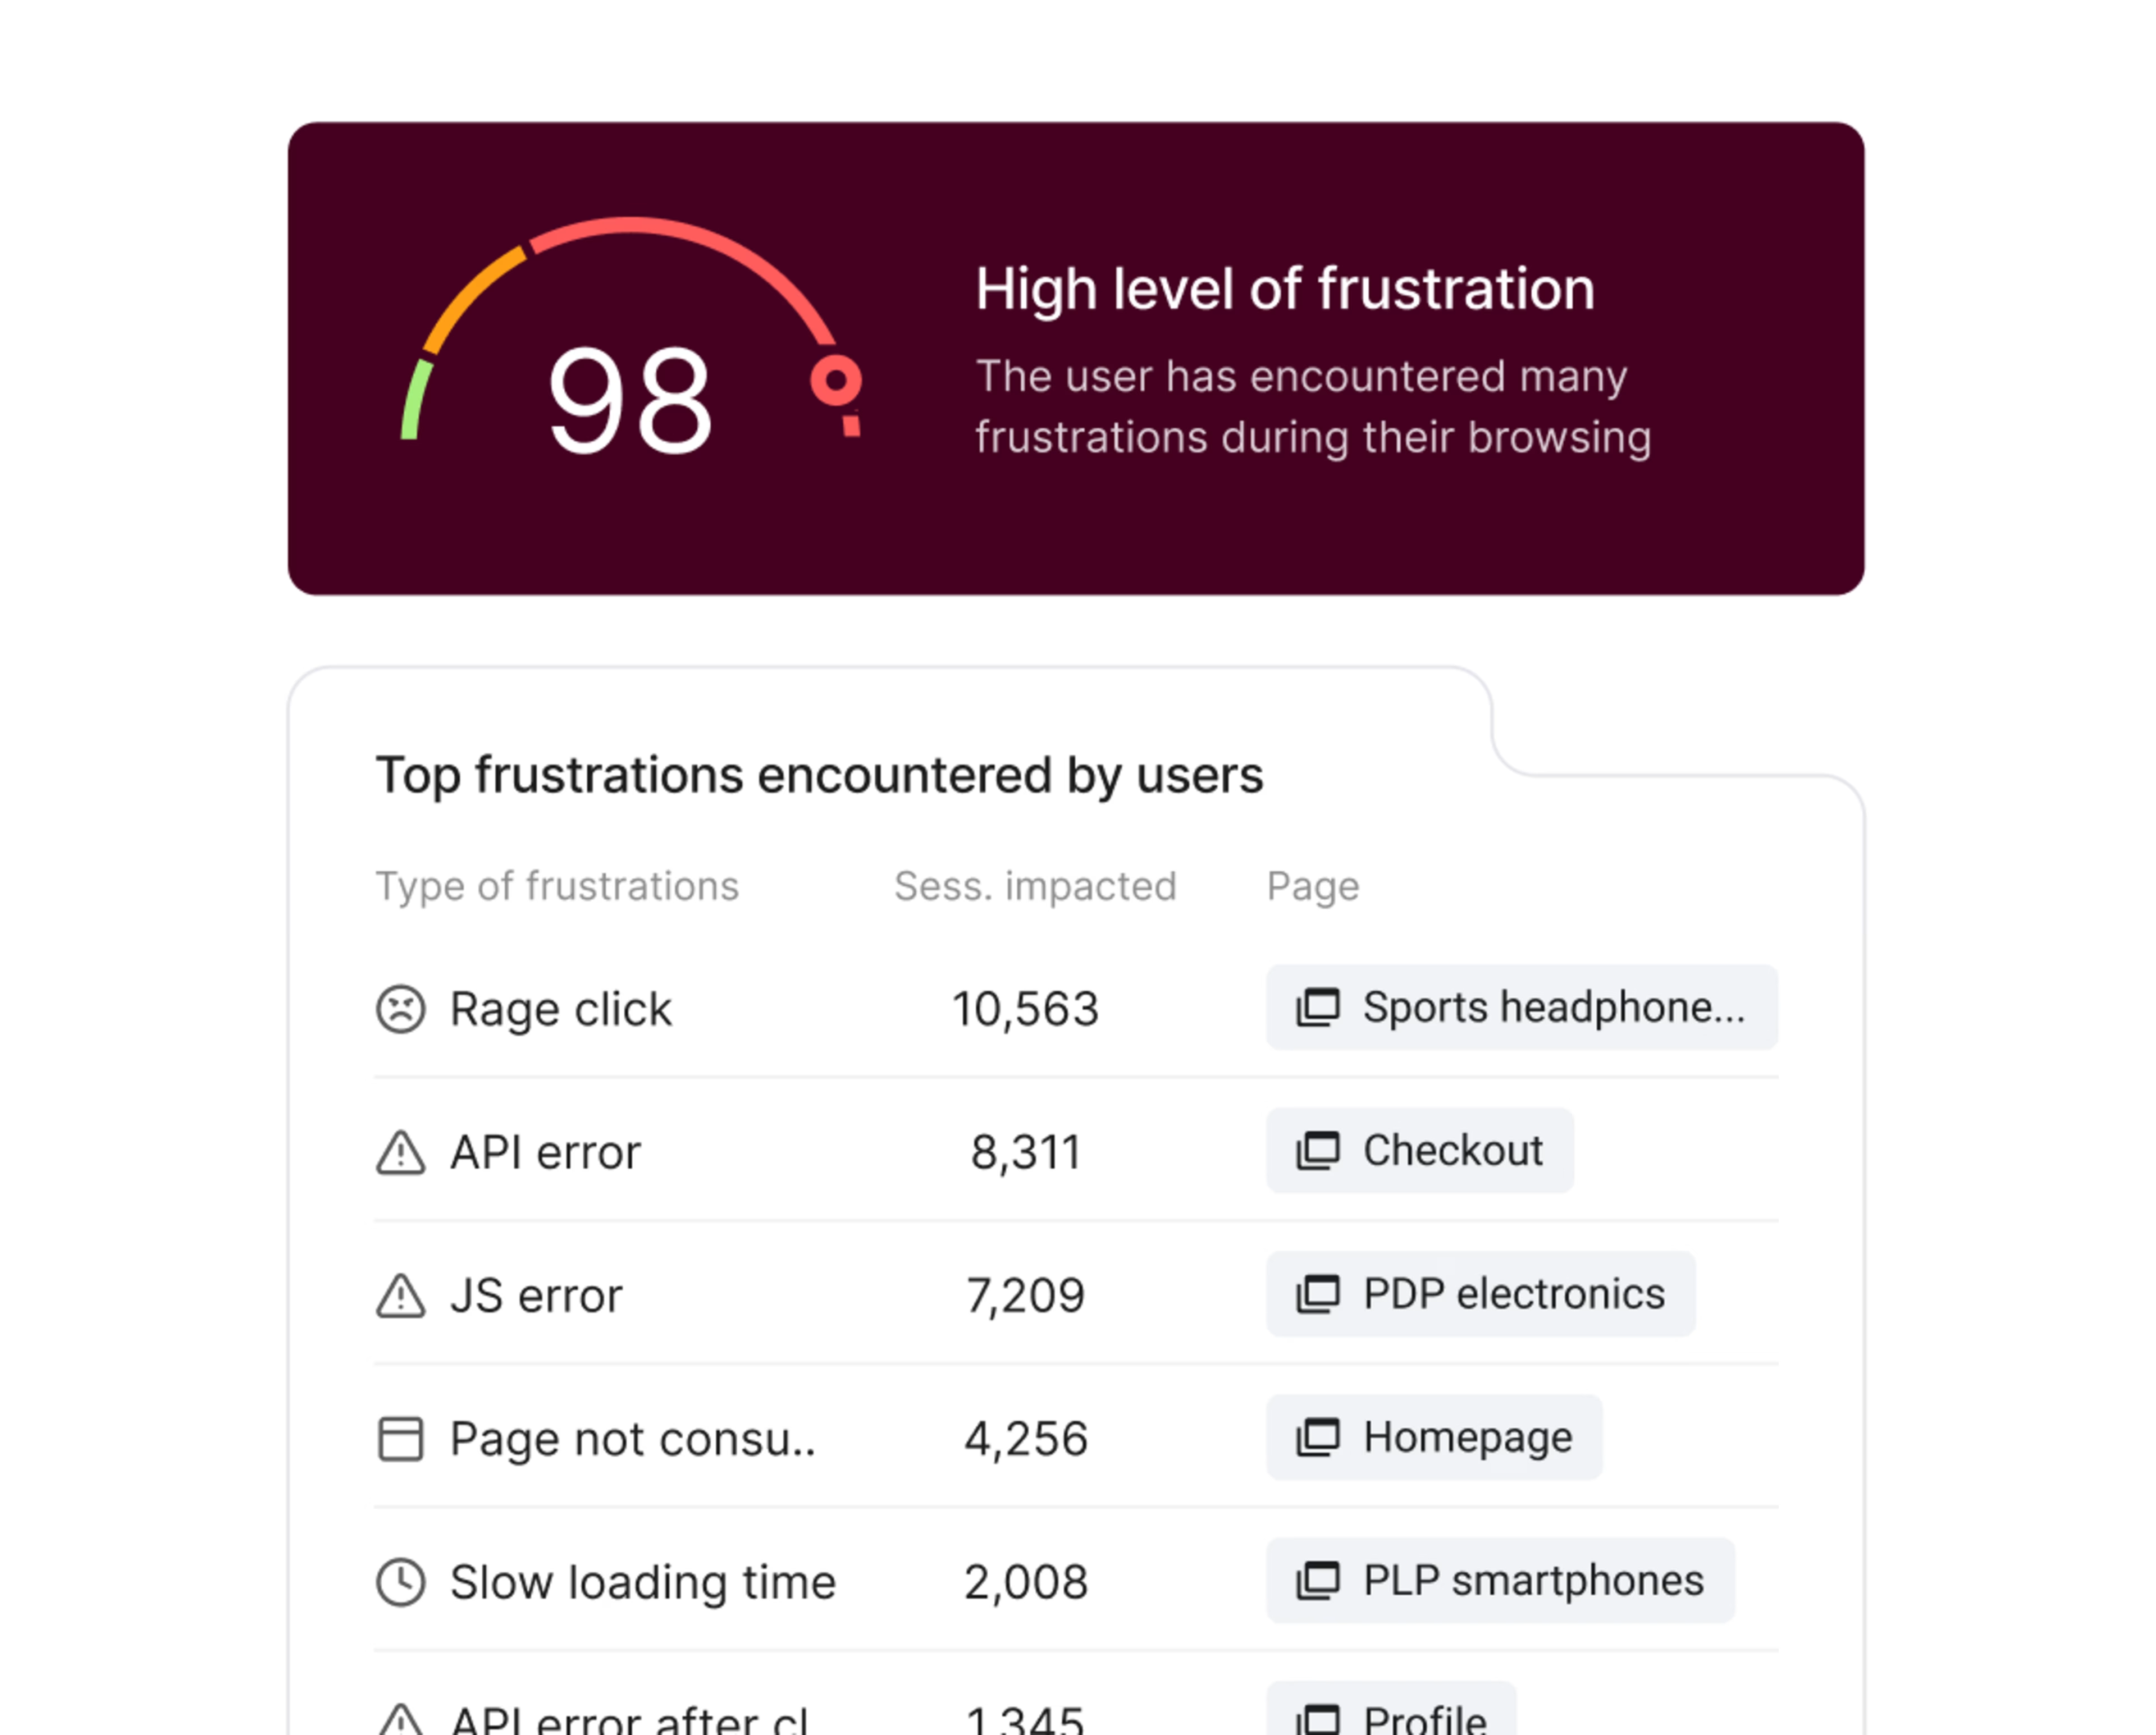
3. "Rage clicking" and frustration indicators
Repeated clicks on non-interactive elements are direct signals of user frustration. This often indicates:
Broken functionality: Users believe an element should be clickable but it isn't.
Unclear design: An image or text looks like a button or link.
Slow loading times: Users are clicking impatiently while waiting for something to load.
Action: Ensure all interactive elements are clearly distinguishable. Fix any broken links or functionality. Optimize page load speed.
Beyond the visual: Integrating heatmap data for holistic understanding
Combining heatmaps with Google Analytics for deeper insights
Google Analytics tells you what's happening on your site. Contentsquare's Heatmaps capability shows you why. Use them together to see not just how many users visit or convert, but how they interact with your pages.
Segmented heatmaps: Use GA to identify specific user segments (e.g., new visitors vs. returning, users from a particular traffic source) and then apply these segments to your heatmap data. How do first-time visitors interact differently than loyal customers?
Conversion funnel analysis: If GA shows a drop-off in a specific step of your conversion funnel, use heatmaps on that page to pinpoint exactly where users are encountering friction or abandoning the process.
Performance metrics: Correlate heatmap observations with GA metrics like bounce rate, time on page, and conversion rates for specific pages. A "cold" section on a heatmap might directly correlate with a high bounce rate.
Leveraging session replays to contextualize heatmap findings
Session replays offer the "why" behind heatmap patterns. While heatmaps show aggregate behavior, recordings allow you to watch individual user journeys:
Observe user intent: See exactly what a user was trying to achieve when they exhibited a particular behavior on a heatmap (e.g., rage clicking, abandoning a form).
Validate hypotheses: If your heatmap suggests a problem with a CTA, watch recordings to see if users are overlooking it, struggling with the form, or getting distracted.
Uncover usability issues: Recordings often reveal unexpected navigation patterns, broken elements, or areas of confusion that might not be immediately apparent from aggregate heatmap data.
By combining heatmaps, analytics, and session recordings, you build a comprehensive understanding of user behavior, moving from observation to deep insight and actionable strategy.
![[Visual] Experience Analytics - AB Test Session Replay](http://images.ctfassets.net/gwbpo1m641r7/6B0G5JrPHs7GYx3UTU4sm9/dd0a6aa32cad72ad6a6b087dcd21e816/Experience_Analytics_-_AB_Test.png?w=1920&q=100&fit=fill&fm=avif)
⚡️ Real-world success: M1
M1, a leading telecom company in Singapore, used Contentsquare’s zone-based heatmaps to quickly understand what customers were doing on key pages and pinpoint friction that traditional attribution reporting wouldn’t surface. By visualizing engagement and conversion patterns across their site, the team spotted a clear issue on a product landing page: users were repeatedly tapping a non-clickable “Sign up” image (high tap recurrence), signaling confusion and intent that wasn’t being captured as progress.
After turning that image into a click-through that sent visitors straight to the signup form, M1 reduced those repeated taps and drove a +143% monthly increase in successful signup conversions, while making ongoing content optimization faster and more efficient.
At a glance, I know what is performing well and what isn't, making the process of content optimization very efficient. I absolutely love Contentsquare's dashboards too. The way the data is laid out makes stakeholder reporting a breeze.
FAQ on heatmaps and customer behavior
To interpret heatmaps, analyze the color gradients: "hot" colors (red, orange) indicate high interaction, while "cold" colors (blue, green) show low interaction. Look for patterns, such as high engagement on key CTAs or low engagement on critical content below the fold. Identify anomalies like "rage clicks" or clicks on non-interactive elements, which signal user frustration or confusion. Always consider the context of your page and your objectives.
![[Visual] Contentsquare's Content Team](http://images.ctfassets.net/gwbpo1m641r7/3IVEUbRzFIoC9mf5EJ2qHY/f25ccd2131dfd63f5c63b5b92cc4ba20/Copy_of_Copy_of_BLOG-icp-8117438.jpeg?w=1920&q=100&fit=fill&fm=avif)