![16 Best Product Roadmap Tools and Software [Free + Premium] — Cover Image](http://images.ctfassets.net/gwbpo1m641r7/7LIN45bpccmme7RV18cXAA/fcffe58bcb8febbb2eadf3bfb0f96838/BLOG-recession-proof-8297424.jpeg?w=3840&q=100&fit=fill&fm=avif)
Imagine your local librarian asks what you’re looking for today, and you respond with, “A book.” While they can certainly help you find one of those, a little more detail goes a long way in seeking out the most satisfying experience.
Secondary dimensions in Google Analytics 4 (GA4) help you unlock comprehensive user insights that enhance your marketing and product campaigns, particularly when used alongside behavior analytics tools. This article explains what secondary dimensions are, how to set them up, and which other data you need to get the most out of using secondary dimensions.
What is a secondary dimension in Google Analytics 4?
A secondary dimension in Google Analytics is an additional parameter you add to your data analysis to get more detailed information about your visitors’ activity on your product or website.
Secondary dimensions narrow down the data from your primary dimensions to create subsets that enable you to find nuances. For example, using a combination of primary and secondary dimensions, you might learn that new users in South America interact with your website differently than new users in Asia.
In addition to the predefined GA4 dimensions, you can also create custom dimensions. These include
User-scoped custom dimensions, which help you capture and understand more information about your users
Event-scoped custom dimensions, which help you understand user behavior based on actions they take
Item-scoped custom dimensions, which help you understand item-specific data on your ecommerce site, like product color
Using these custom parameters as primary or secondary dimensions when reviewing your analytics data gives you even deeper, business-specific insights about user activity, helping you tailor your digital marketing, site content, and customer experience for different user personas.
Dimensions vs. metrics: understanding the difference
A ‘dimension’ in Google Analytics is an attribute used to describe, segment, organize, and sort data, such as your website page or a visitor’s language. Every Google Analytics report has a primary dimension, and you don’t have to add a secondary dimension.
A metric is a quantitative measurement that applies to the dimension—like a bounce rate percentage.
How to set up secondary dimensions in Google Analytics in 4 steps
Ready to analyze your website data? Here’s a step-by-step guide on how to set up secondary dimensions in Google Analytics.
1. Choose your Google Analytics report
Click on the Reports icon (📊) on the left side of your GA4 dashboard. Choose the report you want to view. For the purposes of this example, we’re going to click on ‘Life cycle’ in the left-hand sidebar, then on ‘Acquisition’, then on ‘User acquisition.’ The timeframe will be automatically set to the last 28 days—change it to your preferred dates.
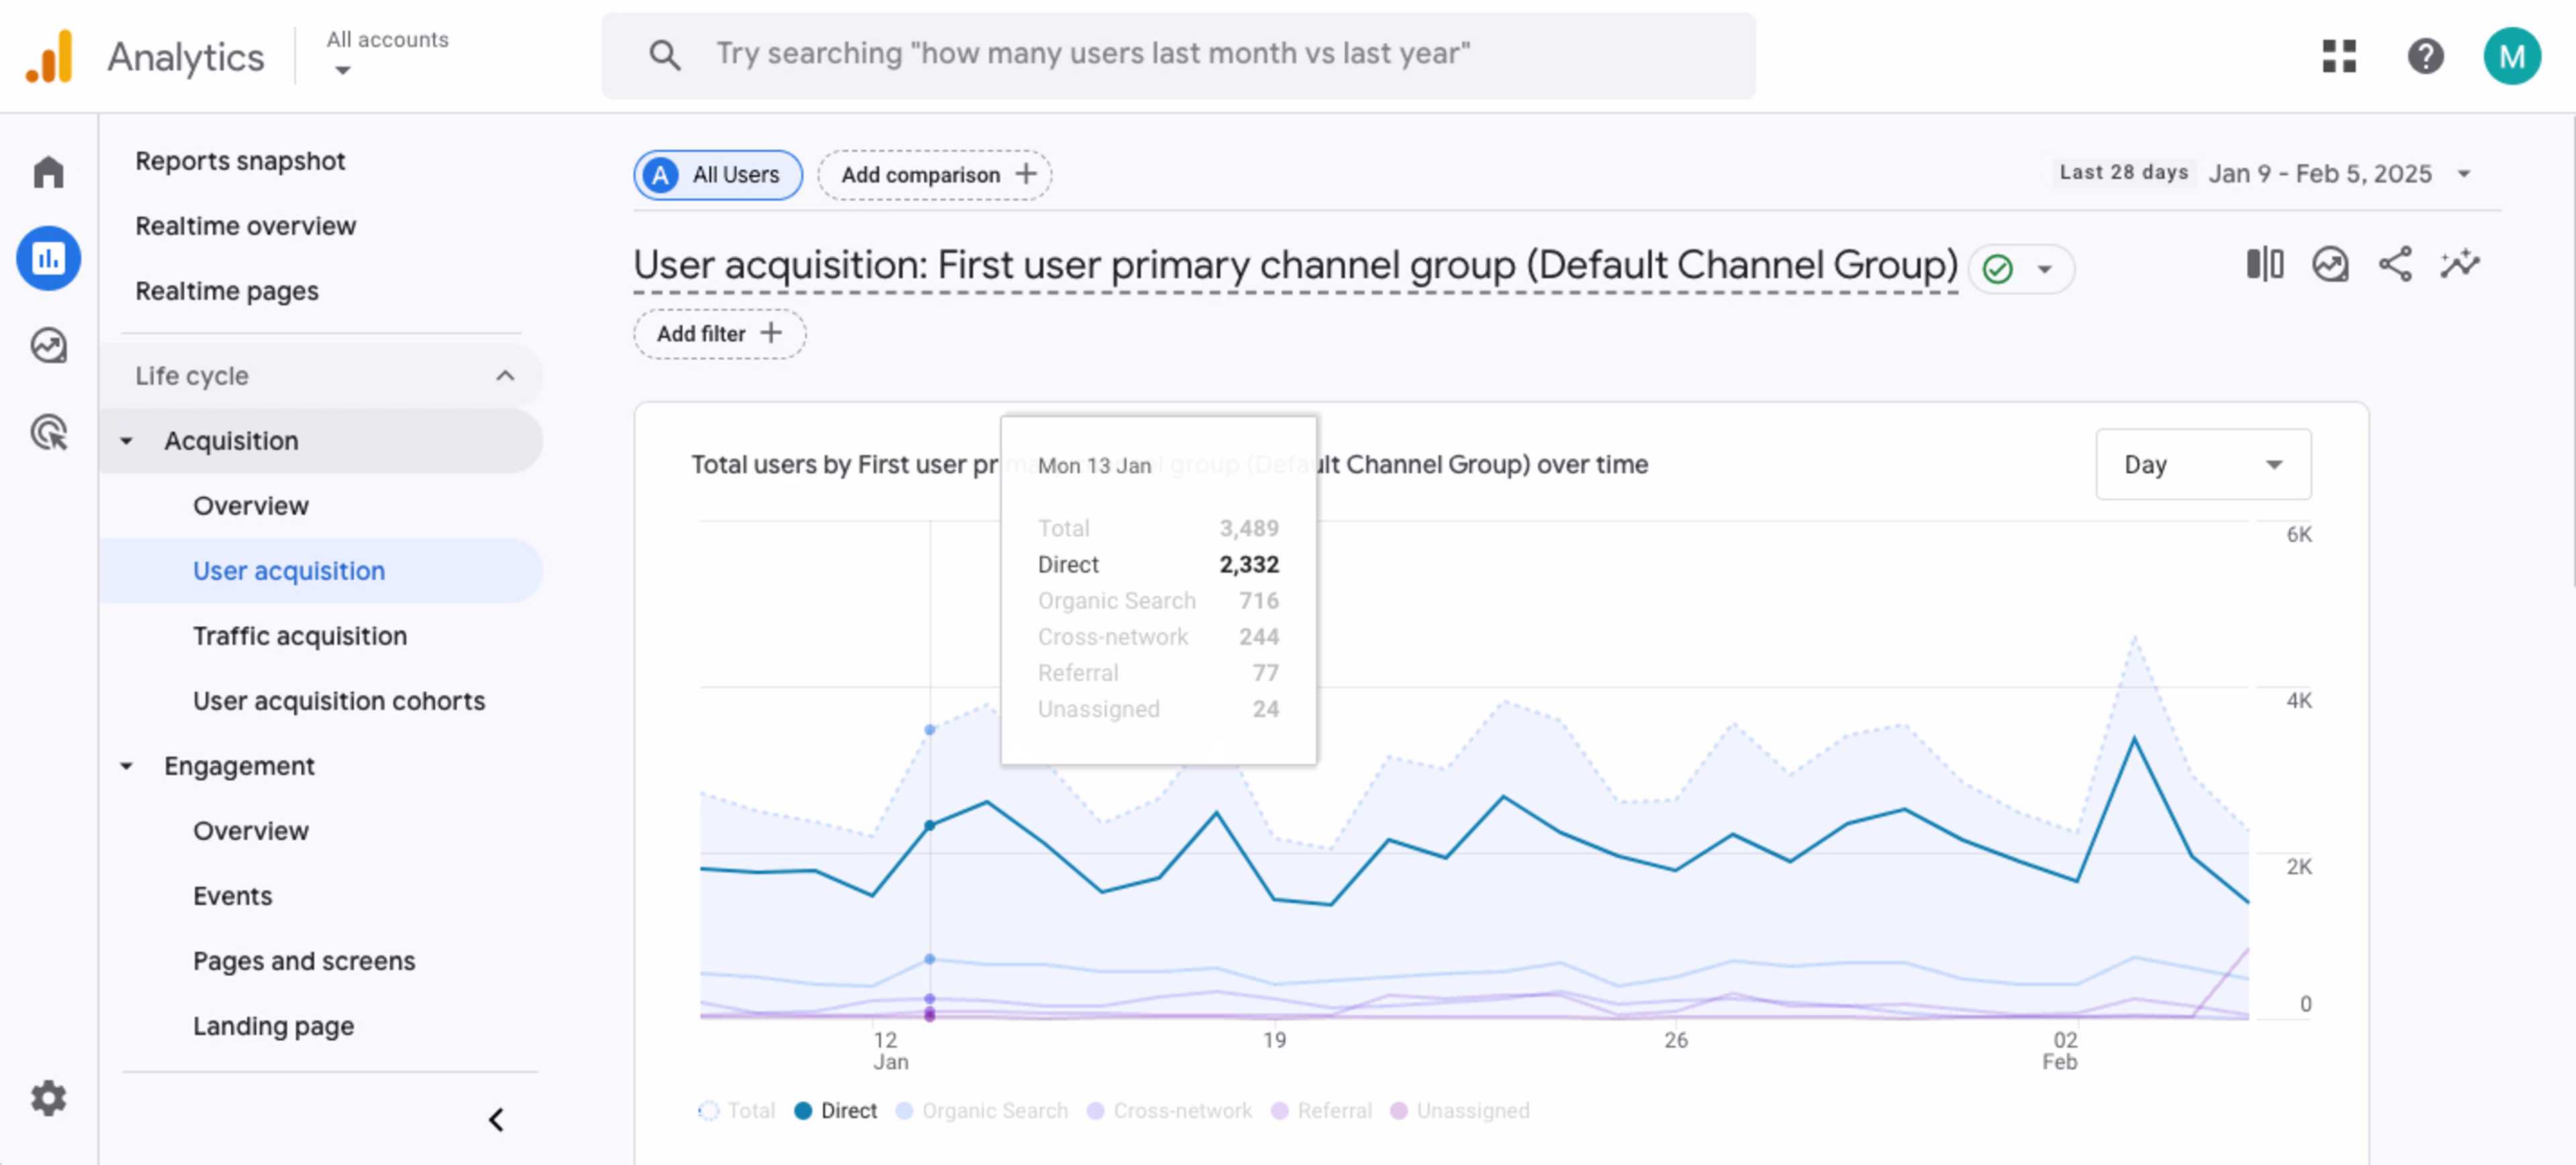
Pull this up and you’ll see a chart that describes your recent user acquisition data
2. Click the ‘+’ in the right corner above the column of your spreadsheet
Scroll down to the spreadsheet beneath your line graph to a column labeled ‘First user primary channel group (Default Channel Group)’. In this instance, ‘First user primary channel group (Default Channel Group)’ is the primary dimension of our report. Click on the blue cross in the top right corner next to this label—this will allow you to add a secondary dimension.
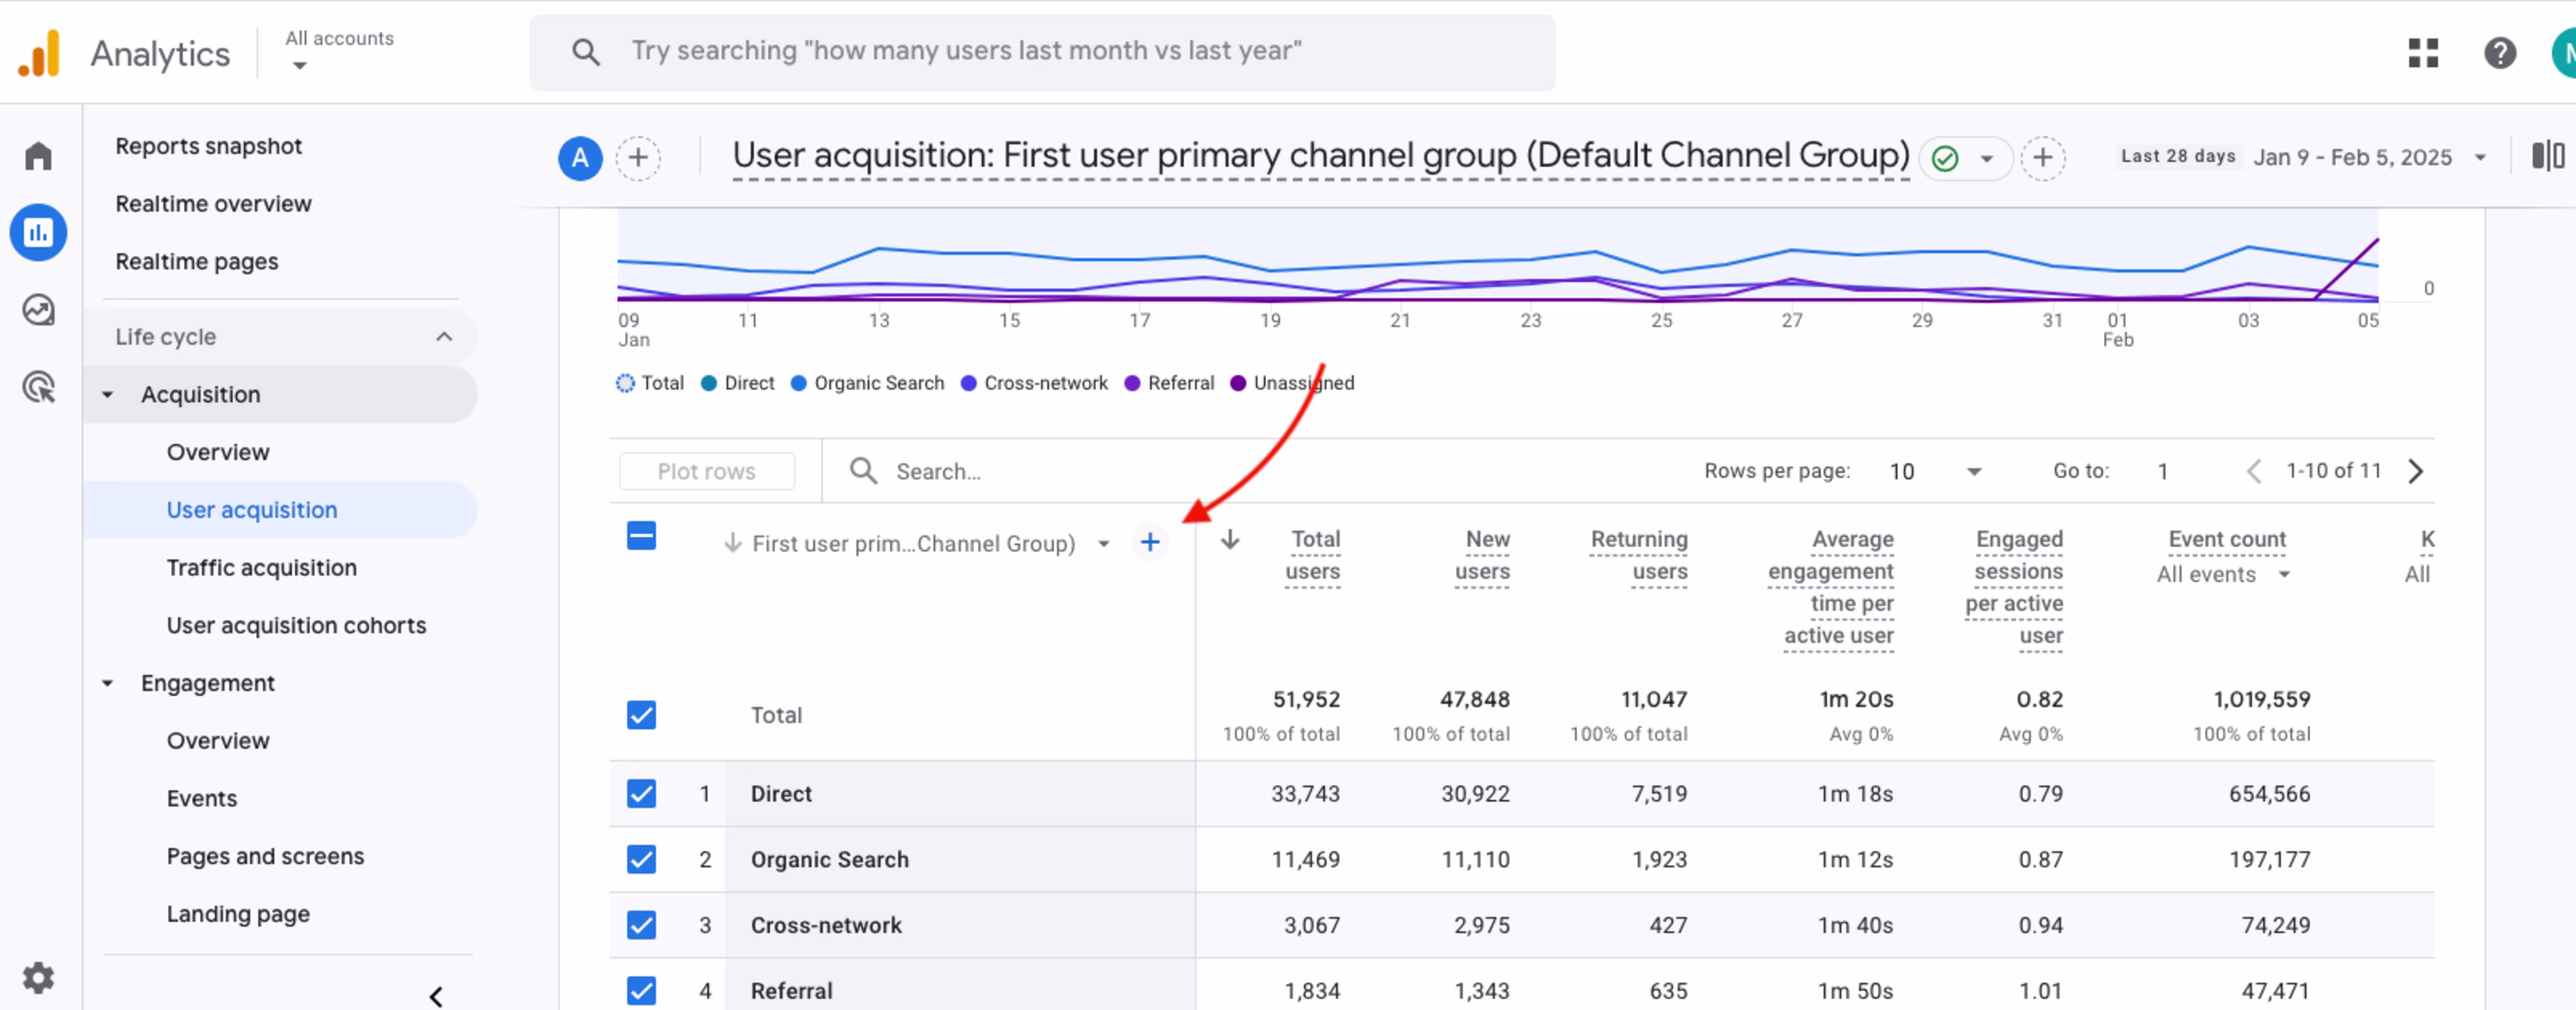
Clicking on the blue cross will bring up a list of secondary dimensions for you to choose from
3. Browse secondary dimensions to find what you need
Browse the secondary dimensions’ drop-down menu by category (like Demographics, Geography, and Event), or use the search bar.
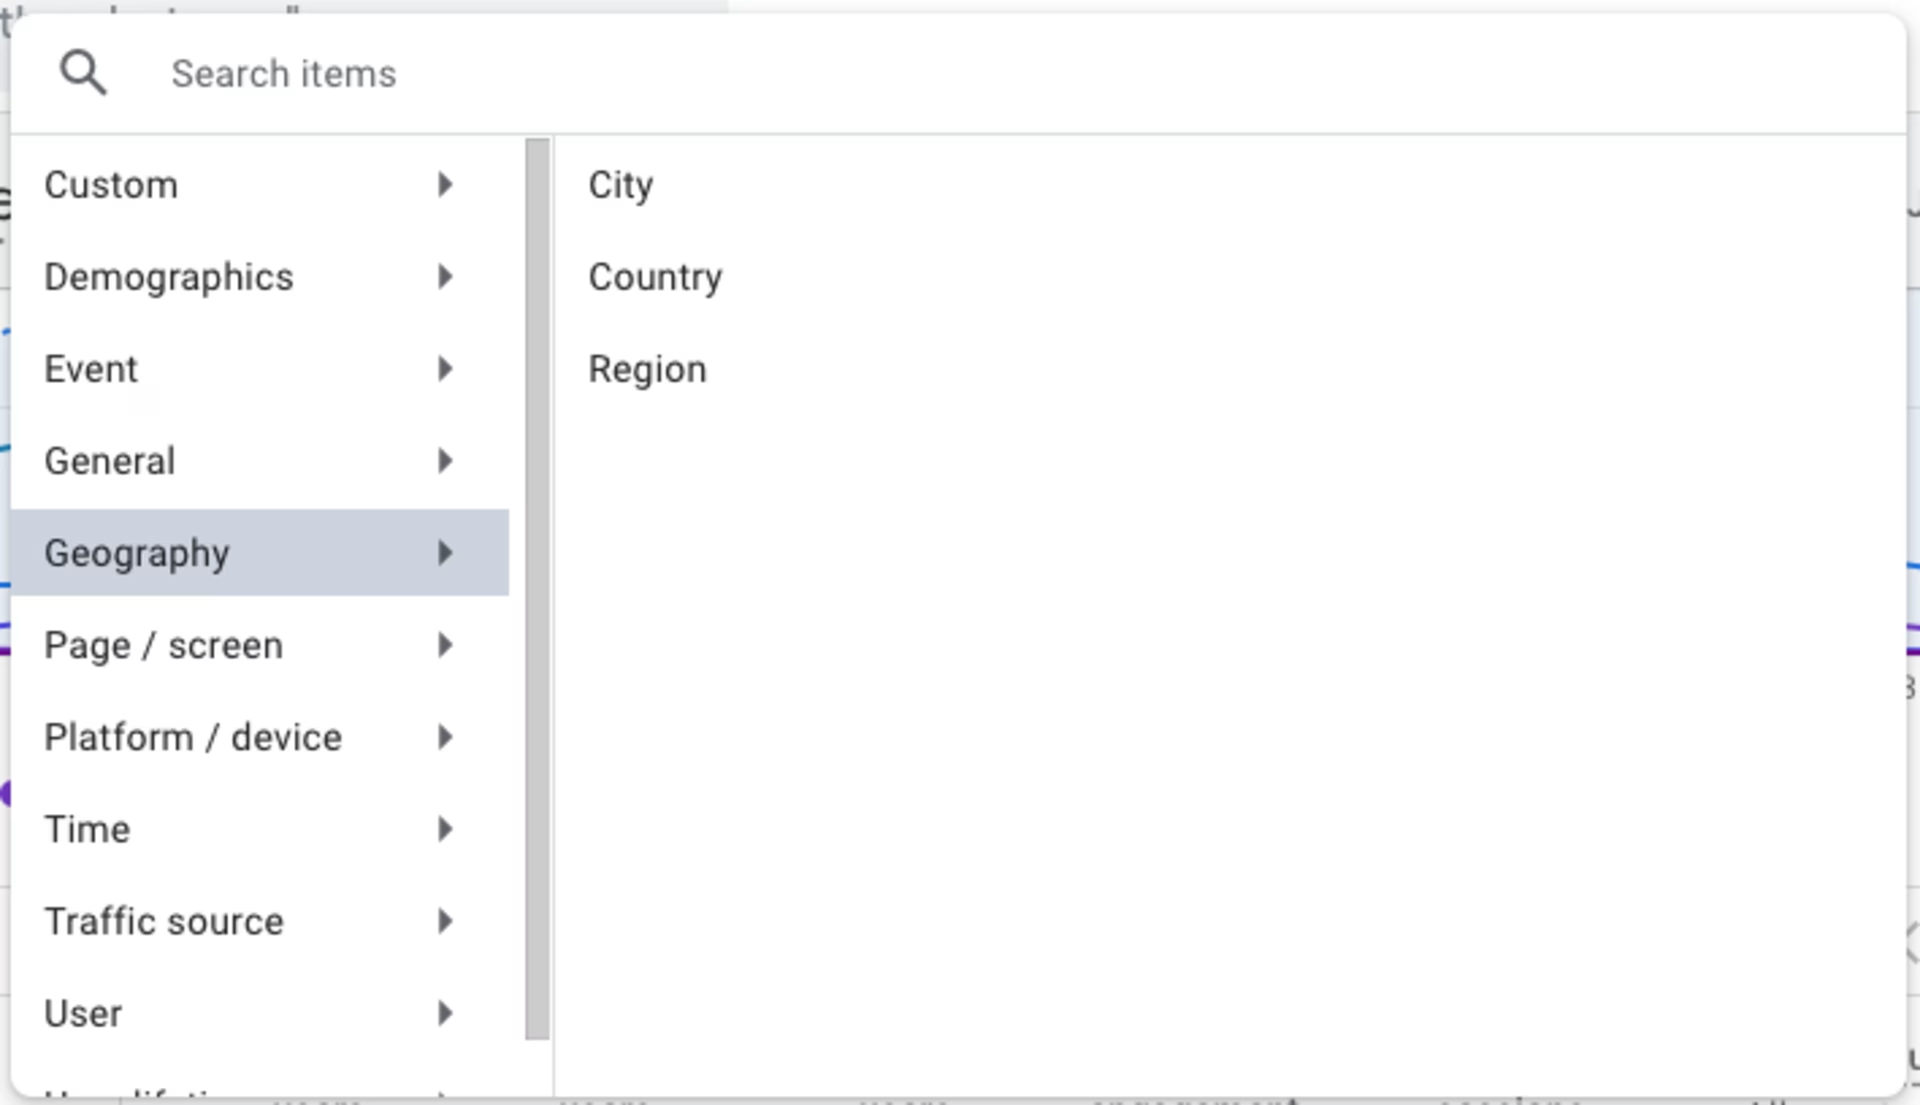
Browse for the most relevant secondary dimensions for your needs
4. Select the secondary dimension you want to add
Select the secondary dimension name. When you choose a secondary dimension, the report automatically updates. For example, in the screenshot below, we can see the secondary dimension ‘Geography > Country’ alongside our primary dimension of ‘Default Channel Group’.
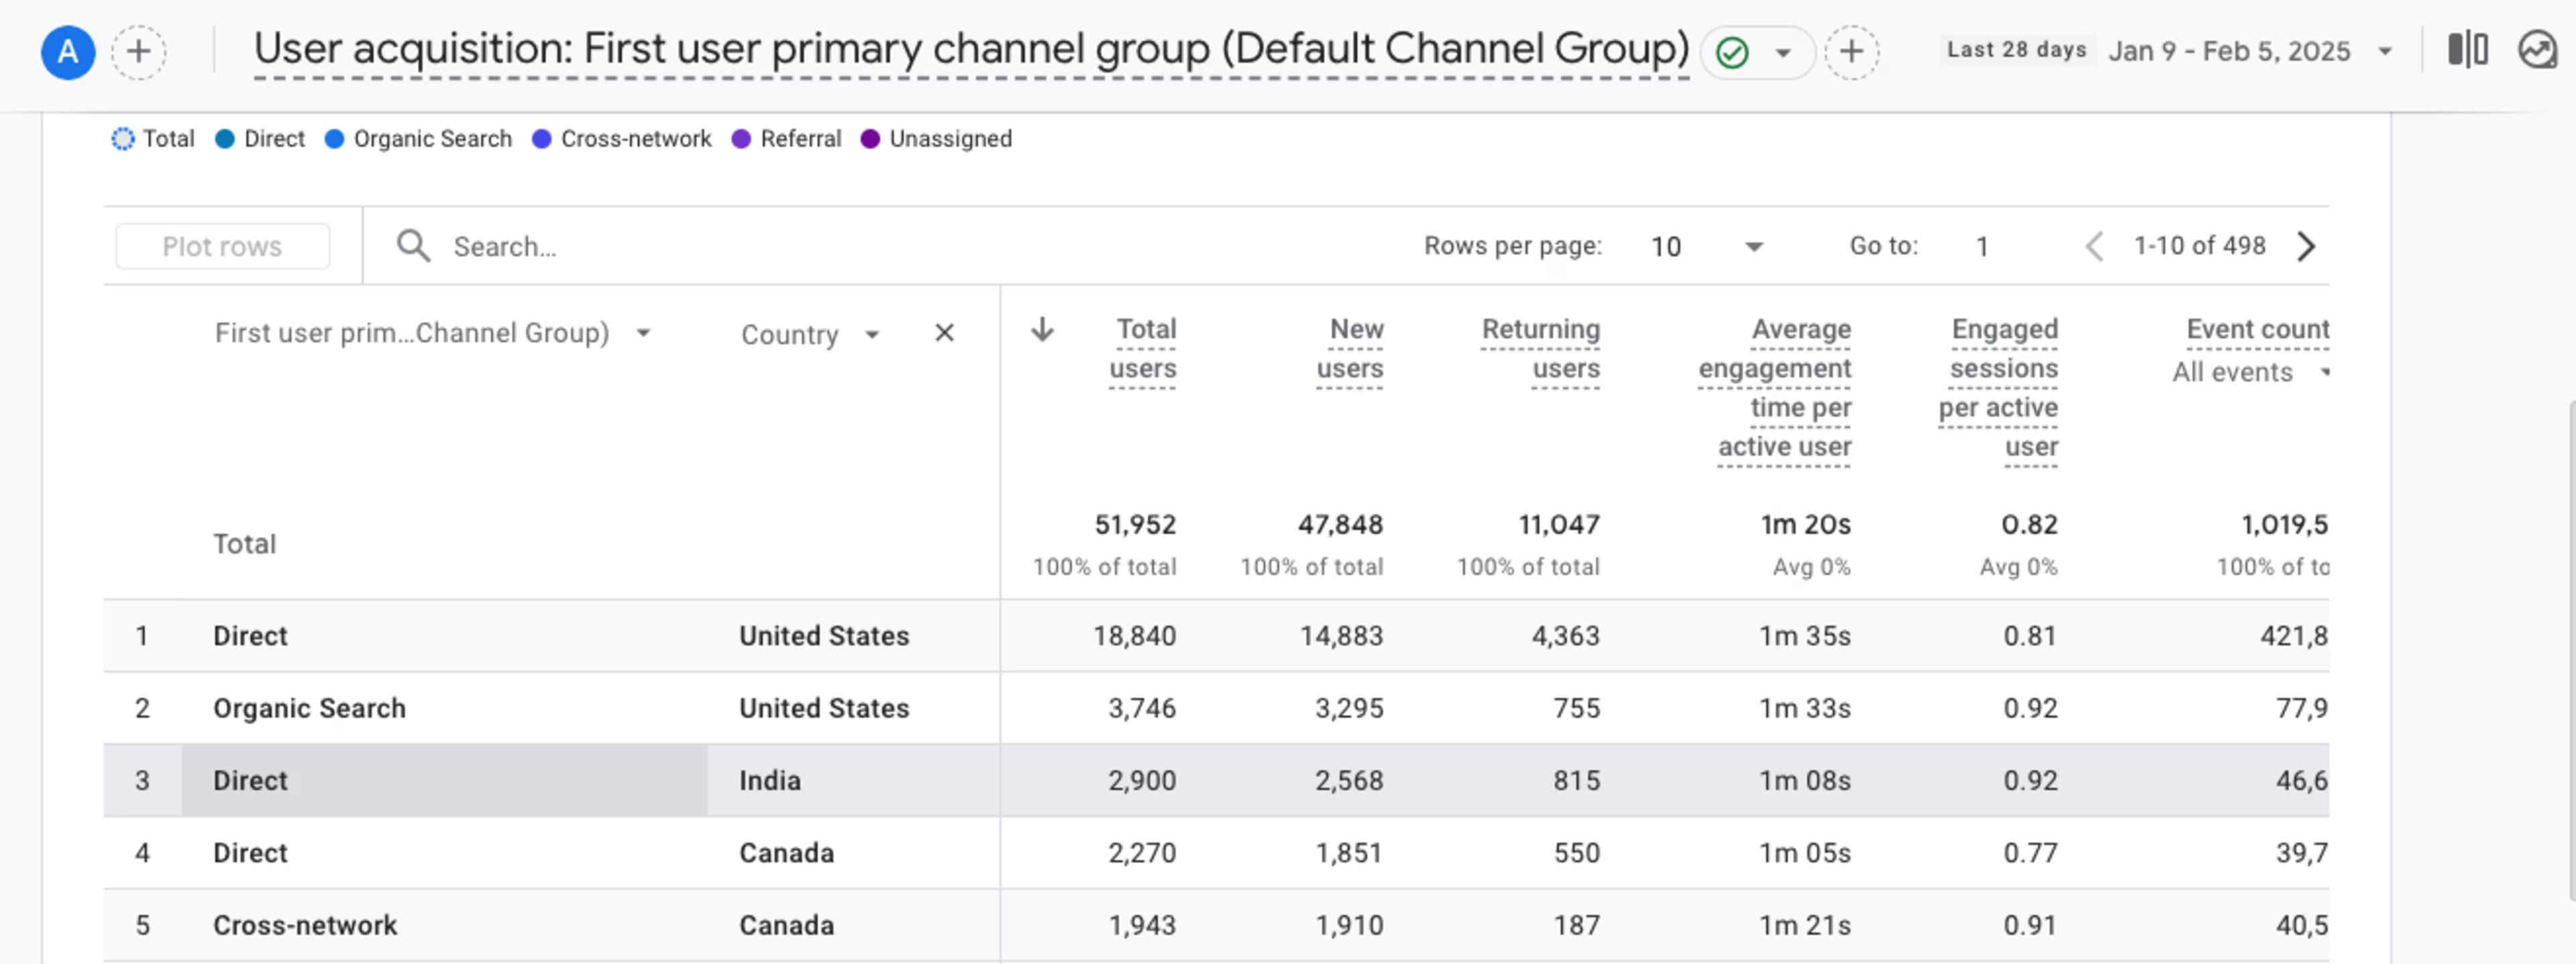
Select your secondary dimension and your report will update automatically
3 ways secondary dimensions help online businesses improve CX
Narrowing your product analytics focus reveals nuances in your data you might miss if you only review GA4 reports with primary dimensions. GA4’s secondary dimension feature also helps you compare data sets to understand user behavior across audience sub-segments, helping you refine your marketing efforts for different cohorts.
Here’s how secondary dimensions give teams additional context to make data-informed decisions.
1. Spot how different devices affect the customer experience
The goal: understand how user engagement varies according to different devices.
What to do:
Head to the ‘Reports’ tab and open the ‘Engagement’ > ‘Events detail report,’ which has the primary dimension ‘Event name’
Add the secondary dimension ‘Device category’
Compare how the metrics for key engagement events—like adding items to cart or viewing items—vary between devices
If there’s a huge gap between the numbers for desktop and mobile devices, it could be a sign that your mobile site is difficult to use. In this situation, prioritize optimizing your mobile UX design and monitor how the changes impact engagement.
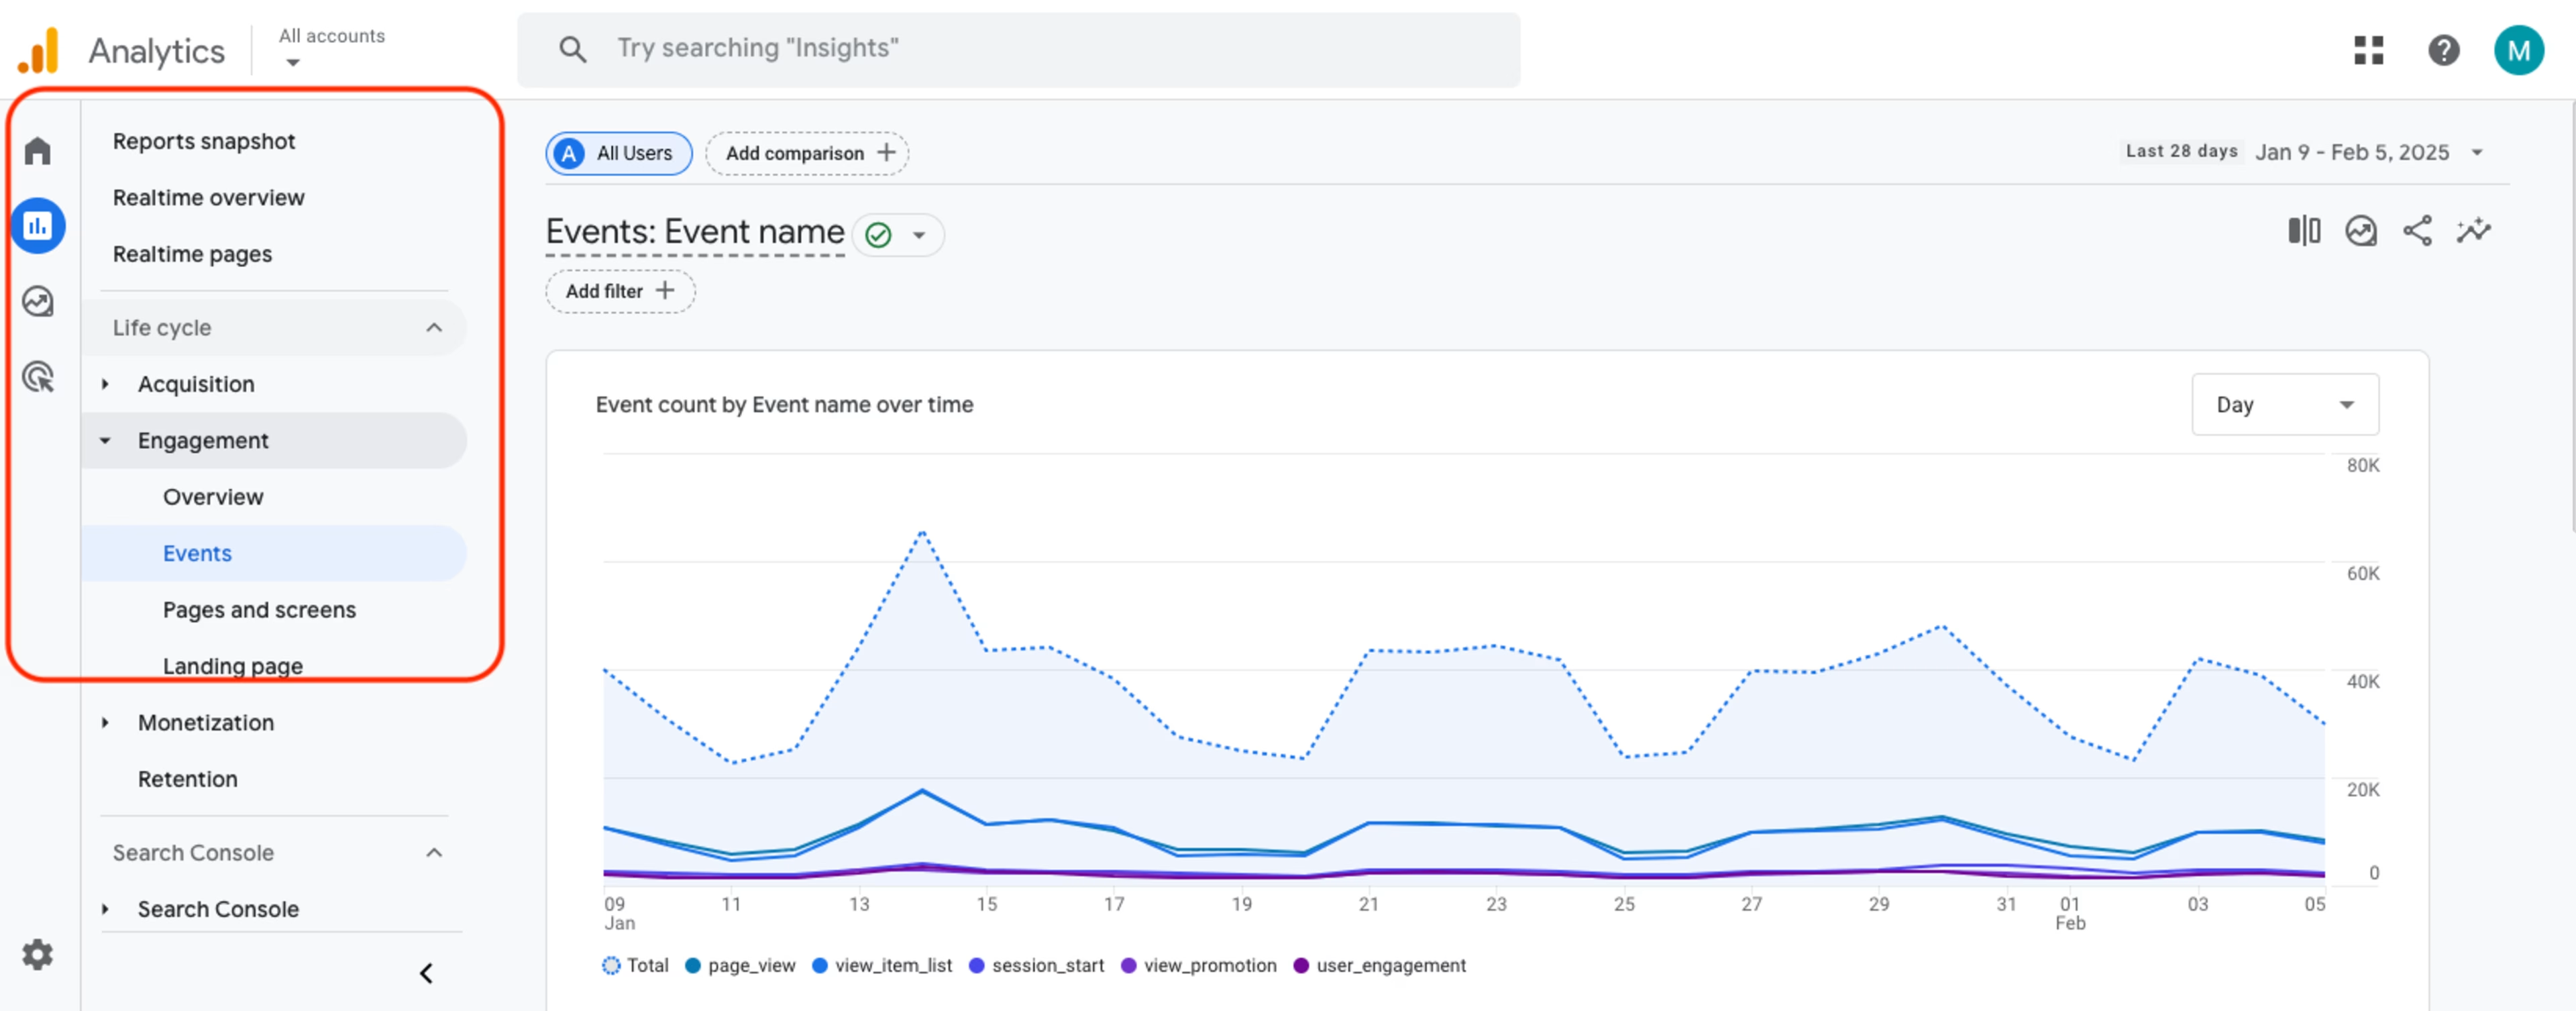
To get to this report, click the settings indicated by the red box
2. Identify and target your ideal customers
The goal: learn more about your most engaged user segment and understand impactful ways to reach this audience.
What to do:
Open the ‘User’ > ‘User attributes’ > ‘Audiences detail’ report, which has the primary dimension ‘Audience name’
Add the secondary dimension ‘Age’ or ‘Country’
Learn which demographic groupings your engaged users fall under, e.g. age 25–34 or located in the United States
Use this information to guide your targeting when you launch new campaigns or Google Ads
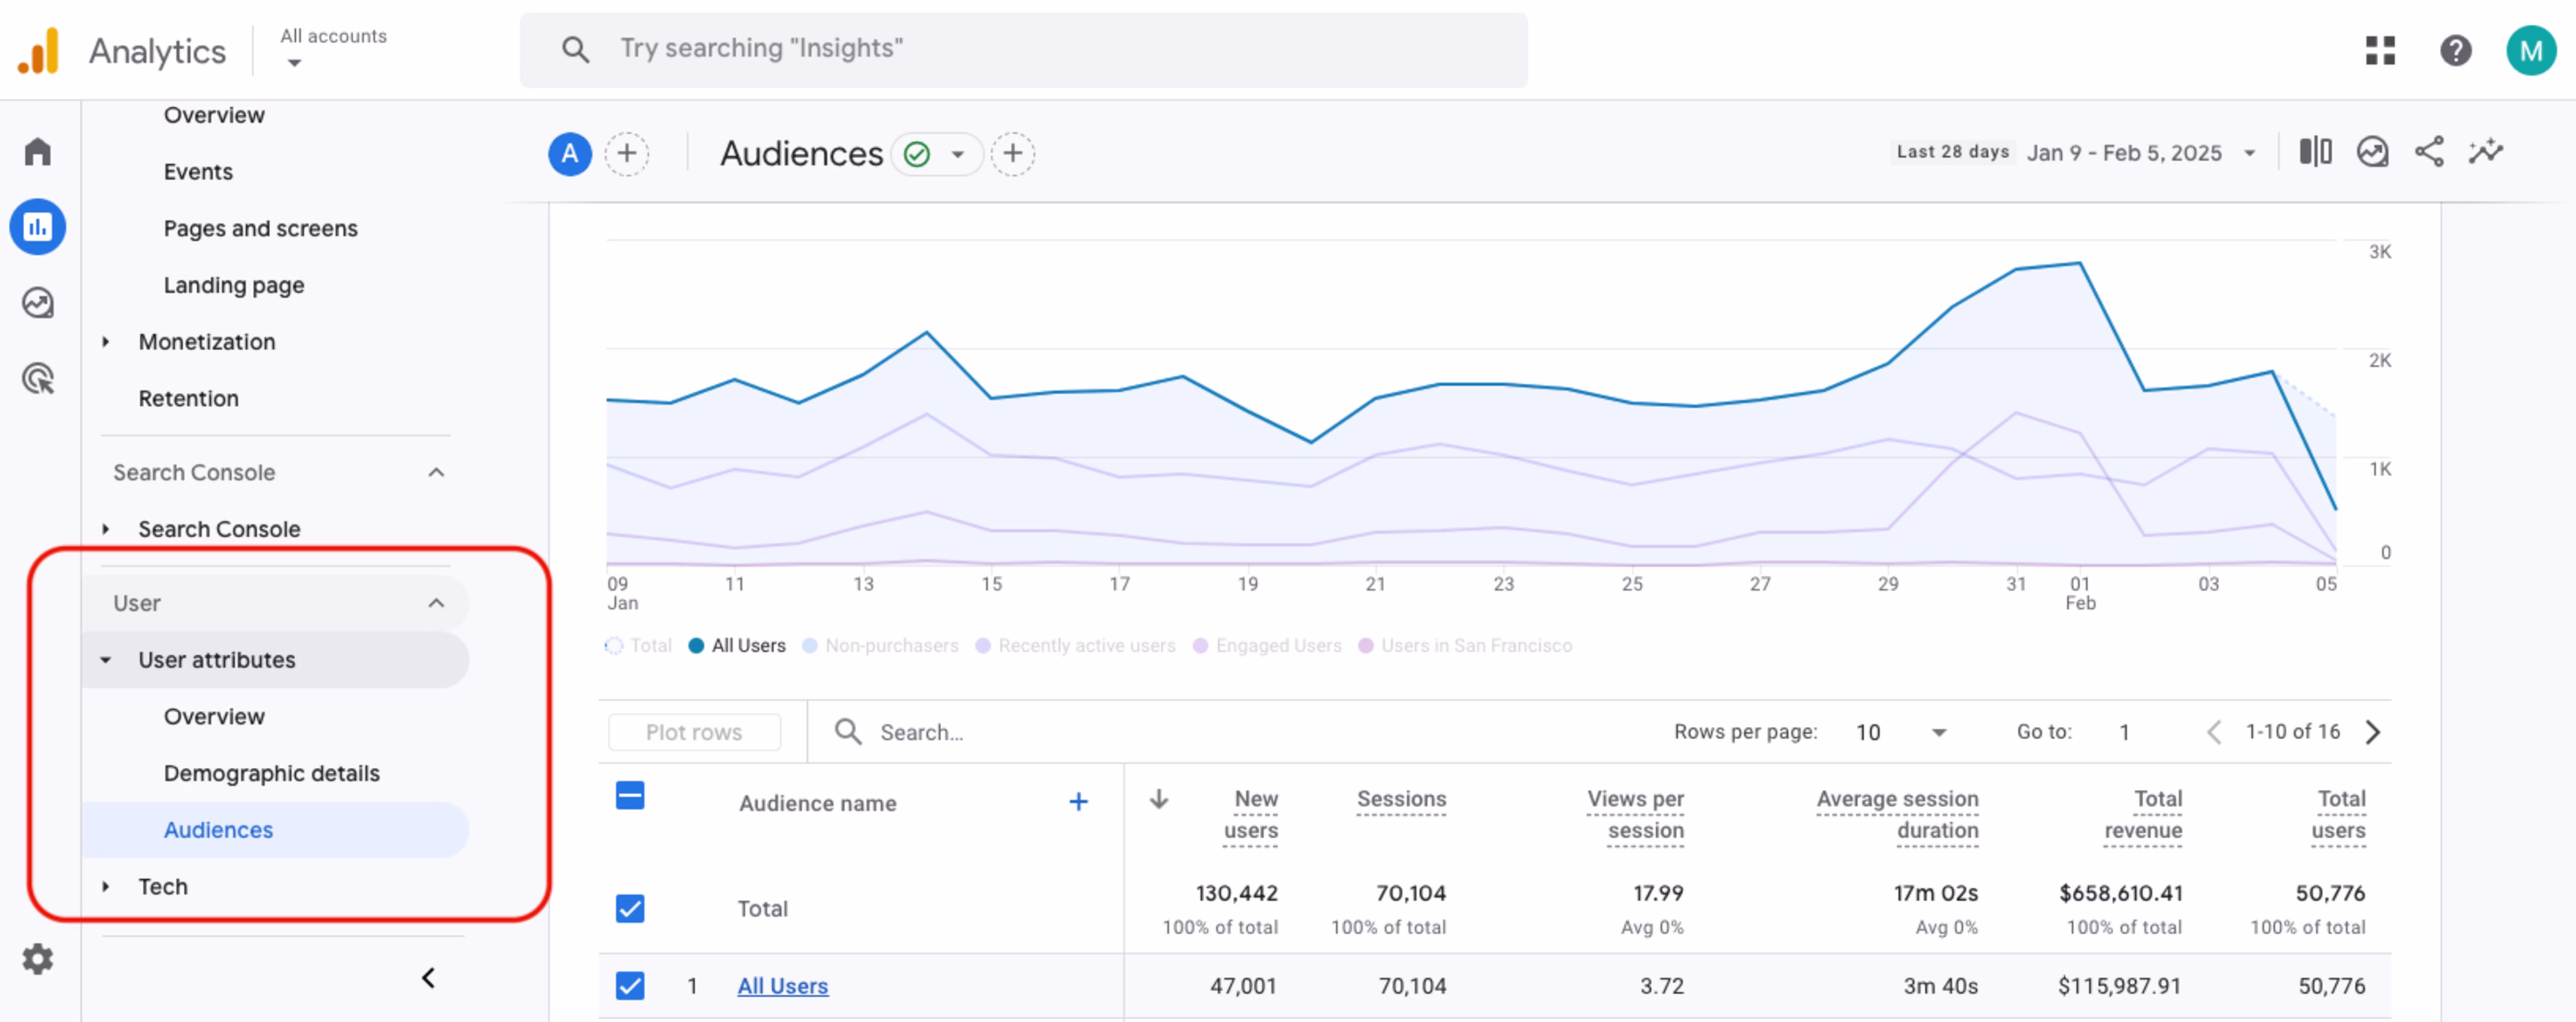
Once again, head to the Reports tab and configure the settings as they’re shown in the red box to get to this report
3. Understand which channels drive the highest revenue
The goal: find correlations between traffic sources and your revenue-generating items customers purchase.
What to do:
Open the ‘Monetization’ > ‘Ecommerce purchases detail’ report
Add the secondary dimension ‘Session source/medium’
Review the ‘Item revenue’ metric to see which items brought in the most money, then use your secondary dimension to discover how users found that item
Invest more resources into your successful channels (for example, if you spot that an email newsletter led to a major boost in sales, consider experimenting more with email marketing or growing your newsletter subscribers)
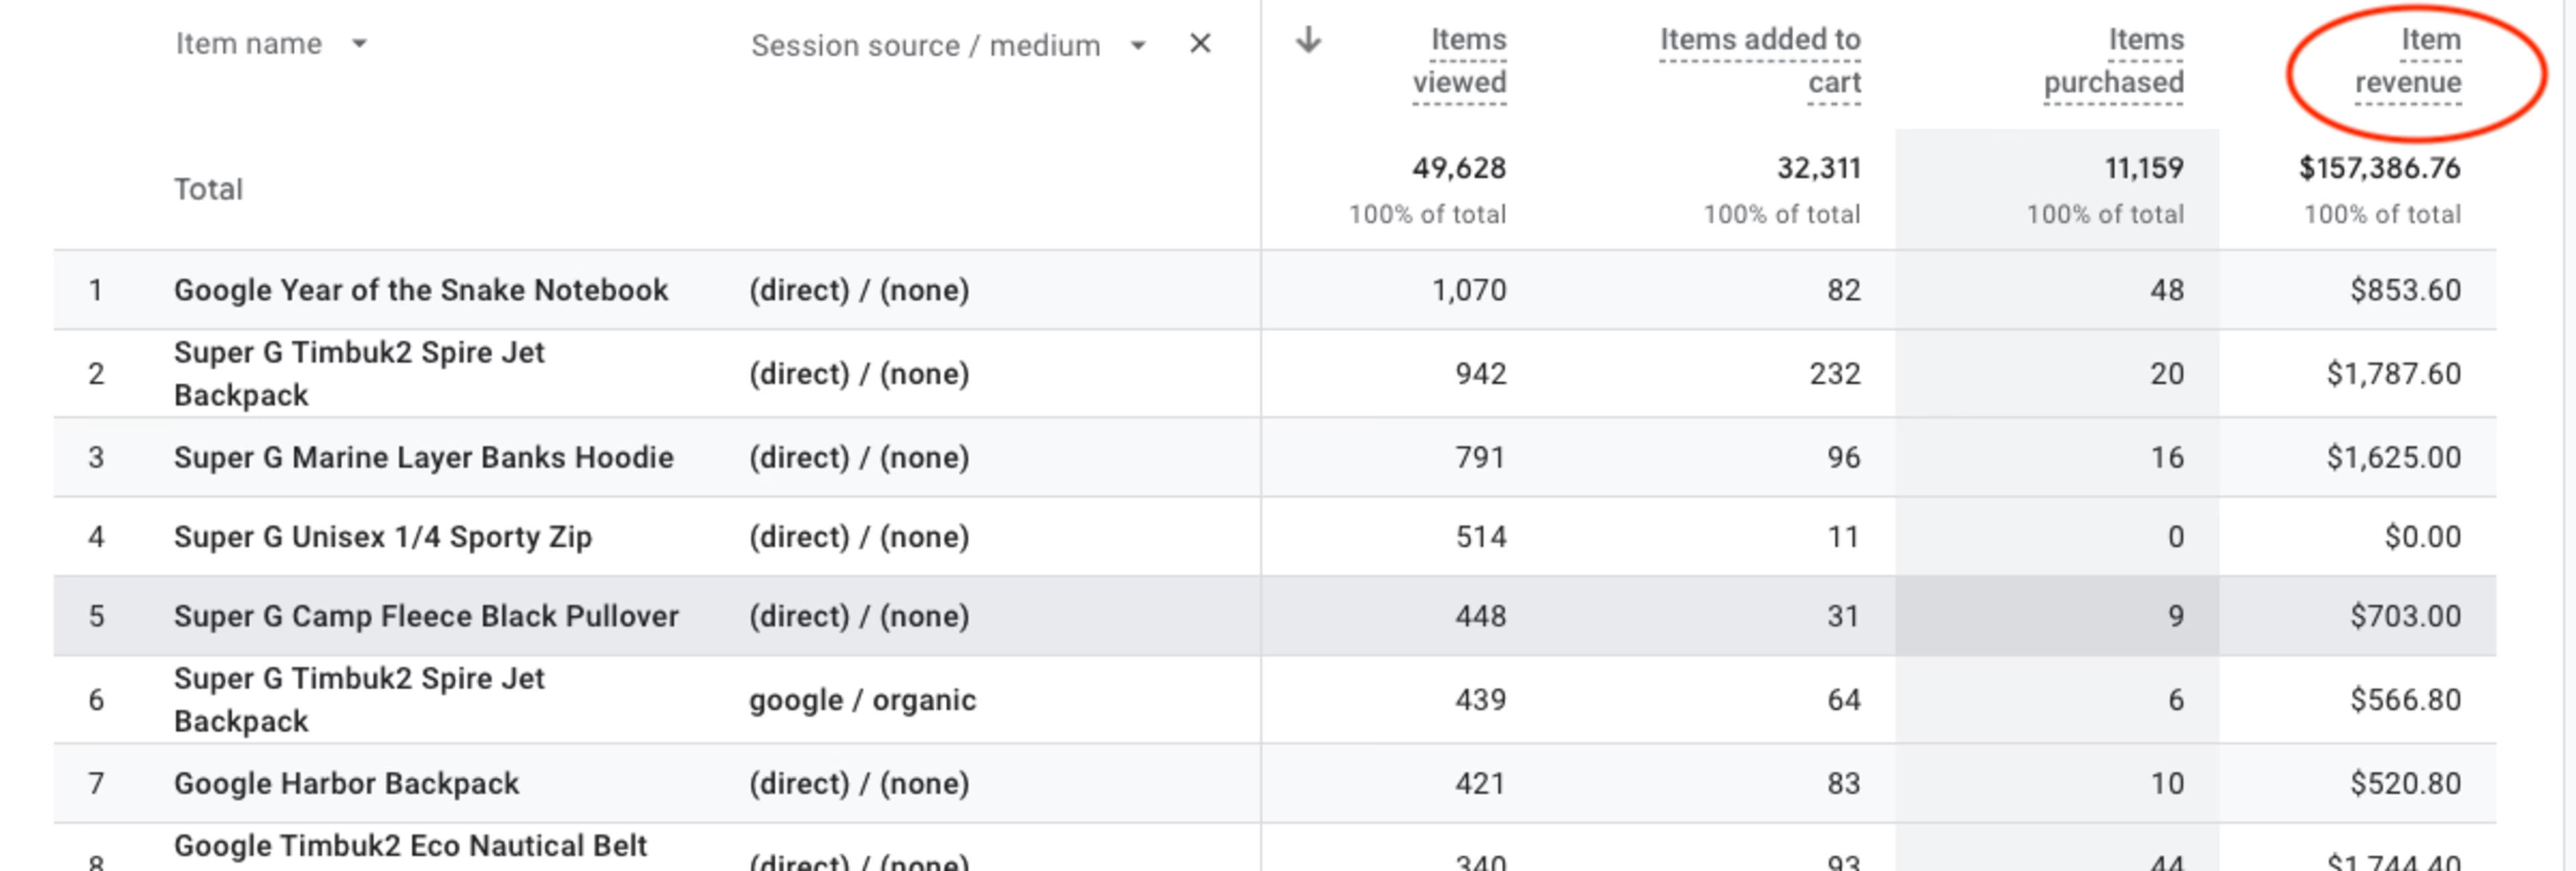
Once you’ve tweaked your settings as described, head to the ‘Item revenue’ column circled in red
4 ways to combine GA4 data with experience intelligence to make more customer-centric decisions
Primary and secondary dimensions offer a quantitative look at outcomes—like how long someone spent on your mobile site or how often new users in Canada completed a transaction.
But you need qualitative information to understand causes—like discovering that new users in Canada want to learn about shipping costs before they start a purchase or they’ll abandon the checkout process.
Actionable insights and user behavior patterns reveal themselves when you combine qualitative and quantitative data.
Experience intelligence tools teach you exactly how customers interact with your website so you can expand on what you find through your Google Analytics account, make customer-centric decisions about your next marketing campaign or product launch, and optimize your conversion rate. Here are some ways to get more from your GA4 data using experience intelligence tools like Contentsquare.
1. Visualize your user journey to find and fix website issues
Numbers only tell you what happened—not why or how it happened. For that, you need visual tools like session replays and heatmaps.
Session replays are video-like playbacks of real (anonymized) users as they navigate your site, showing you exactly what they interact with, what they ignore, and where they get stuck
Heatmaps are color-coded representations of where users scroll, click, and move on your site. They reveal which areas capture customer attention and which elements—like CTA buttons—get overlooked
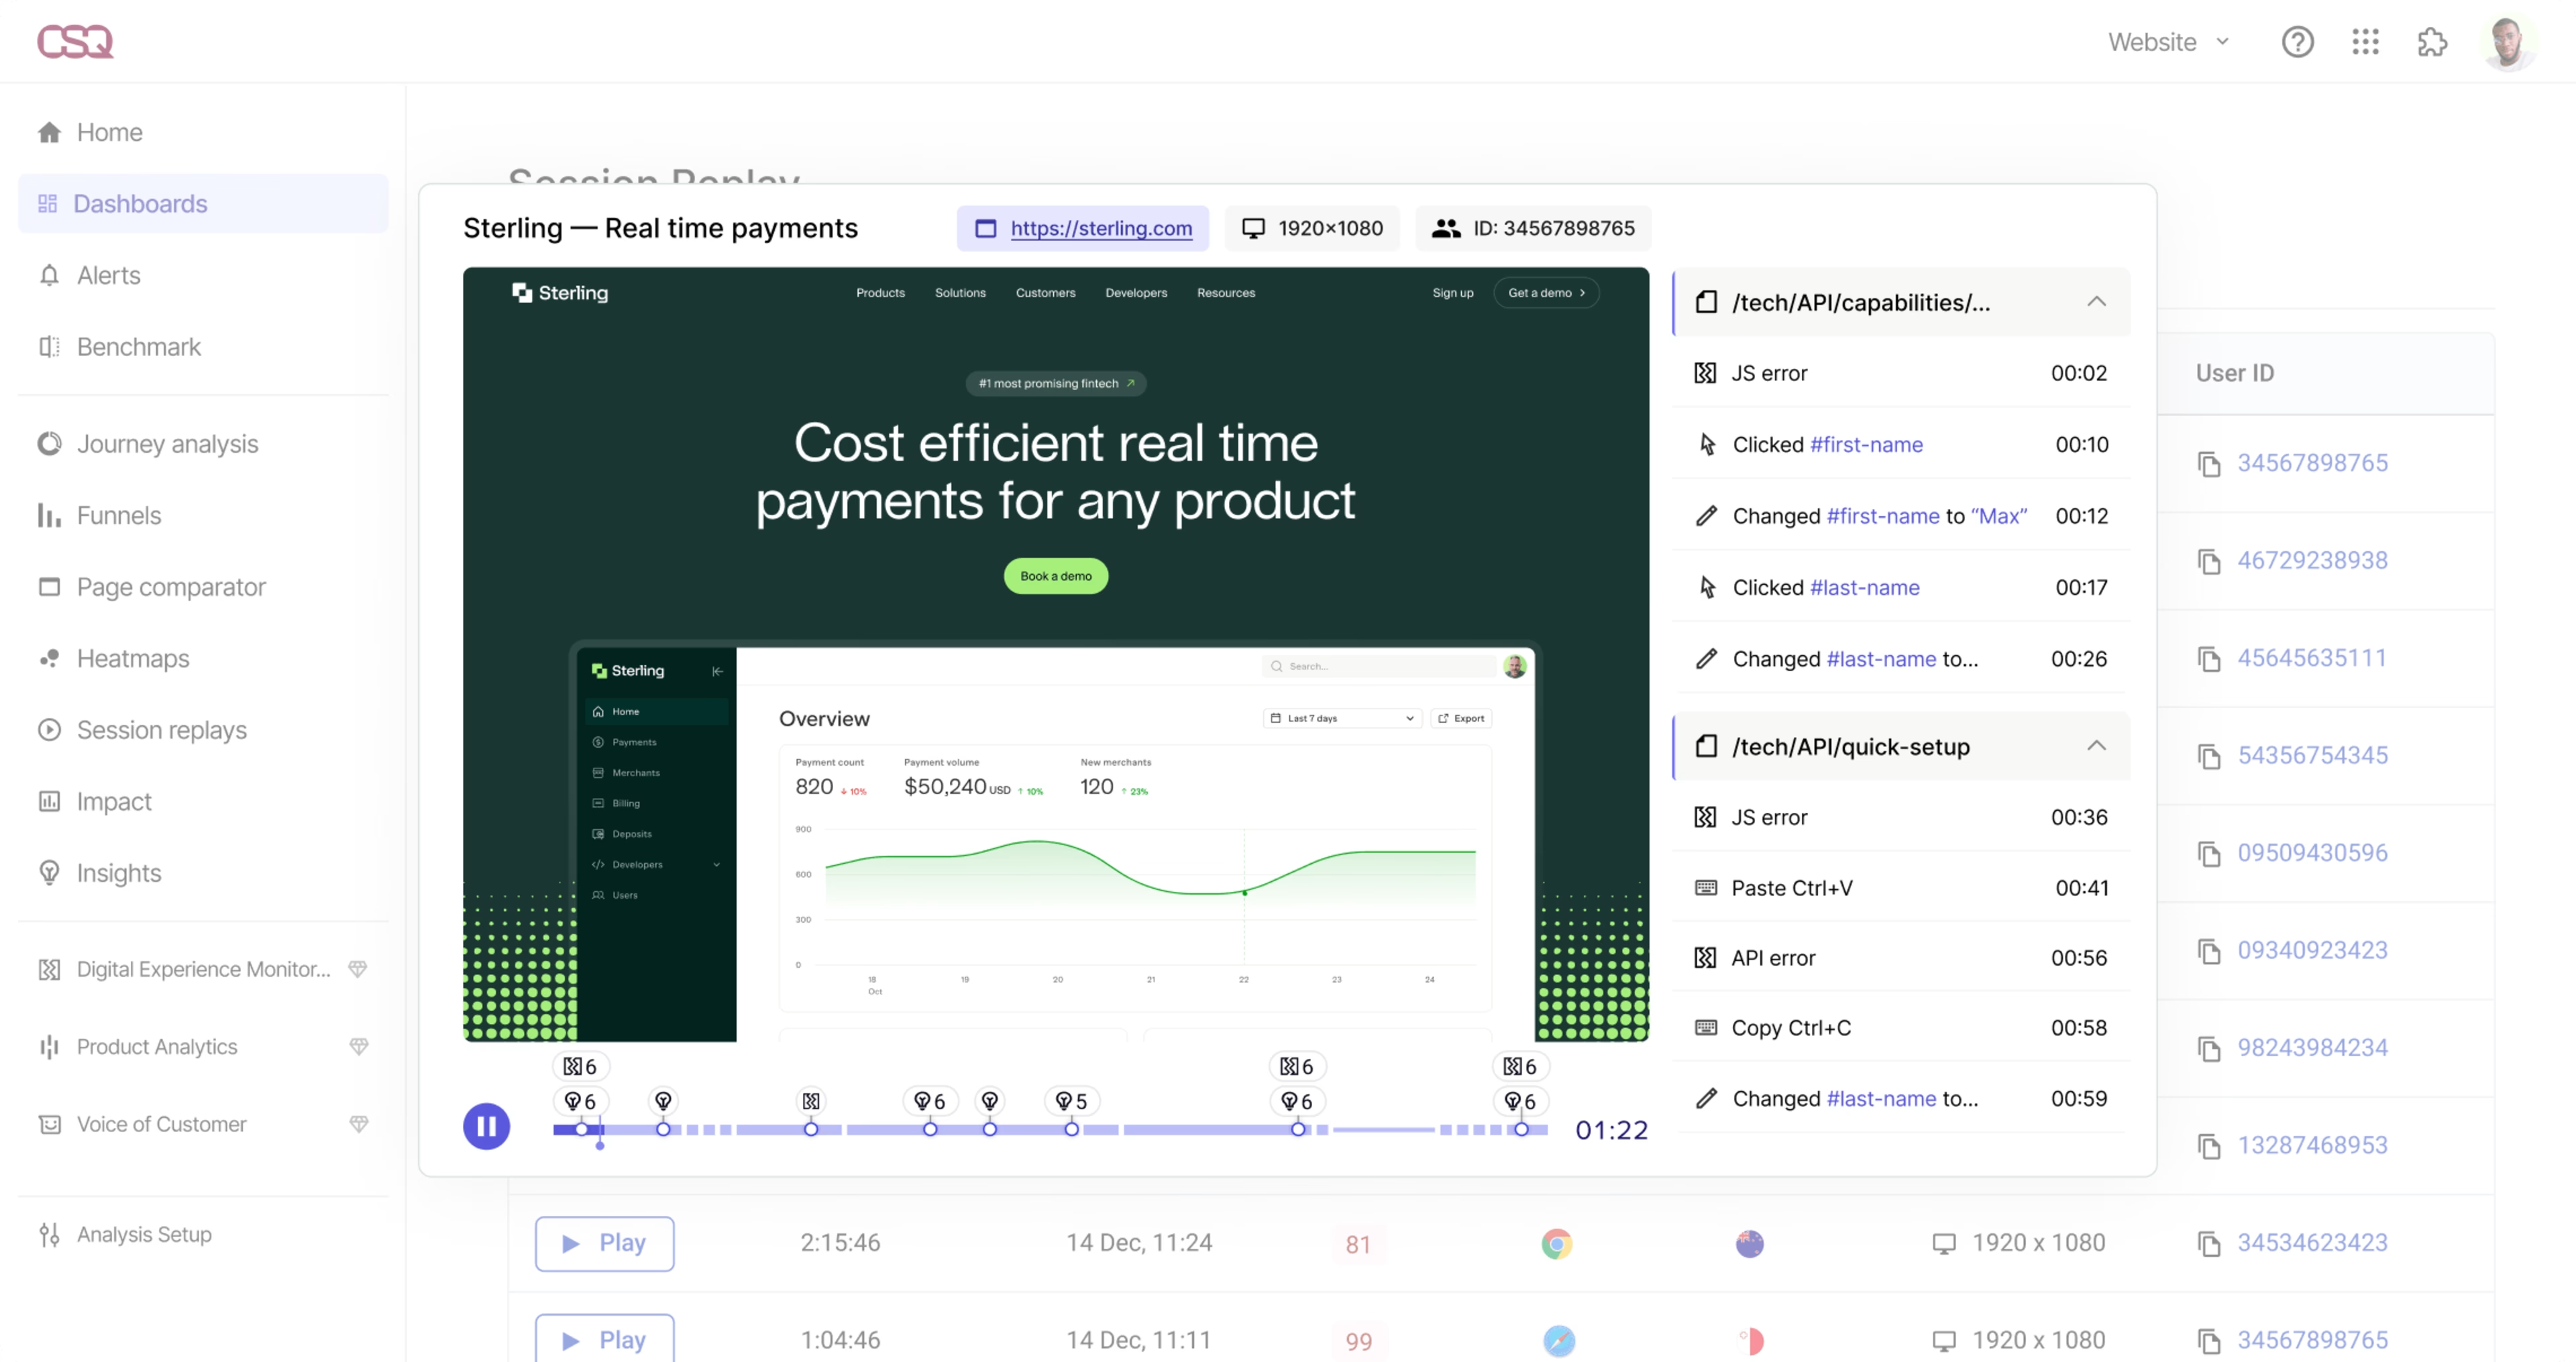
Use Contentsquare Session Replays to see exactly what customers do on your site—and bring your GA4 numbers to life
Use these tools to contextualize the numbers from GA4 and see exactly what your users see, so you can empathize with their experience.
For example, use GA4 to identify landing pages with the highest or lowest conversion rates, then use Contentsquare Heatmaps to discover which elements are driving those numbers. Jump straight from your heatmap into relevant session replays to watch what makes users rage click in frustration, or spot what caught their interest and compelled them to convert.
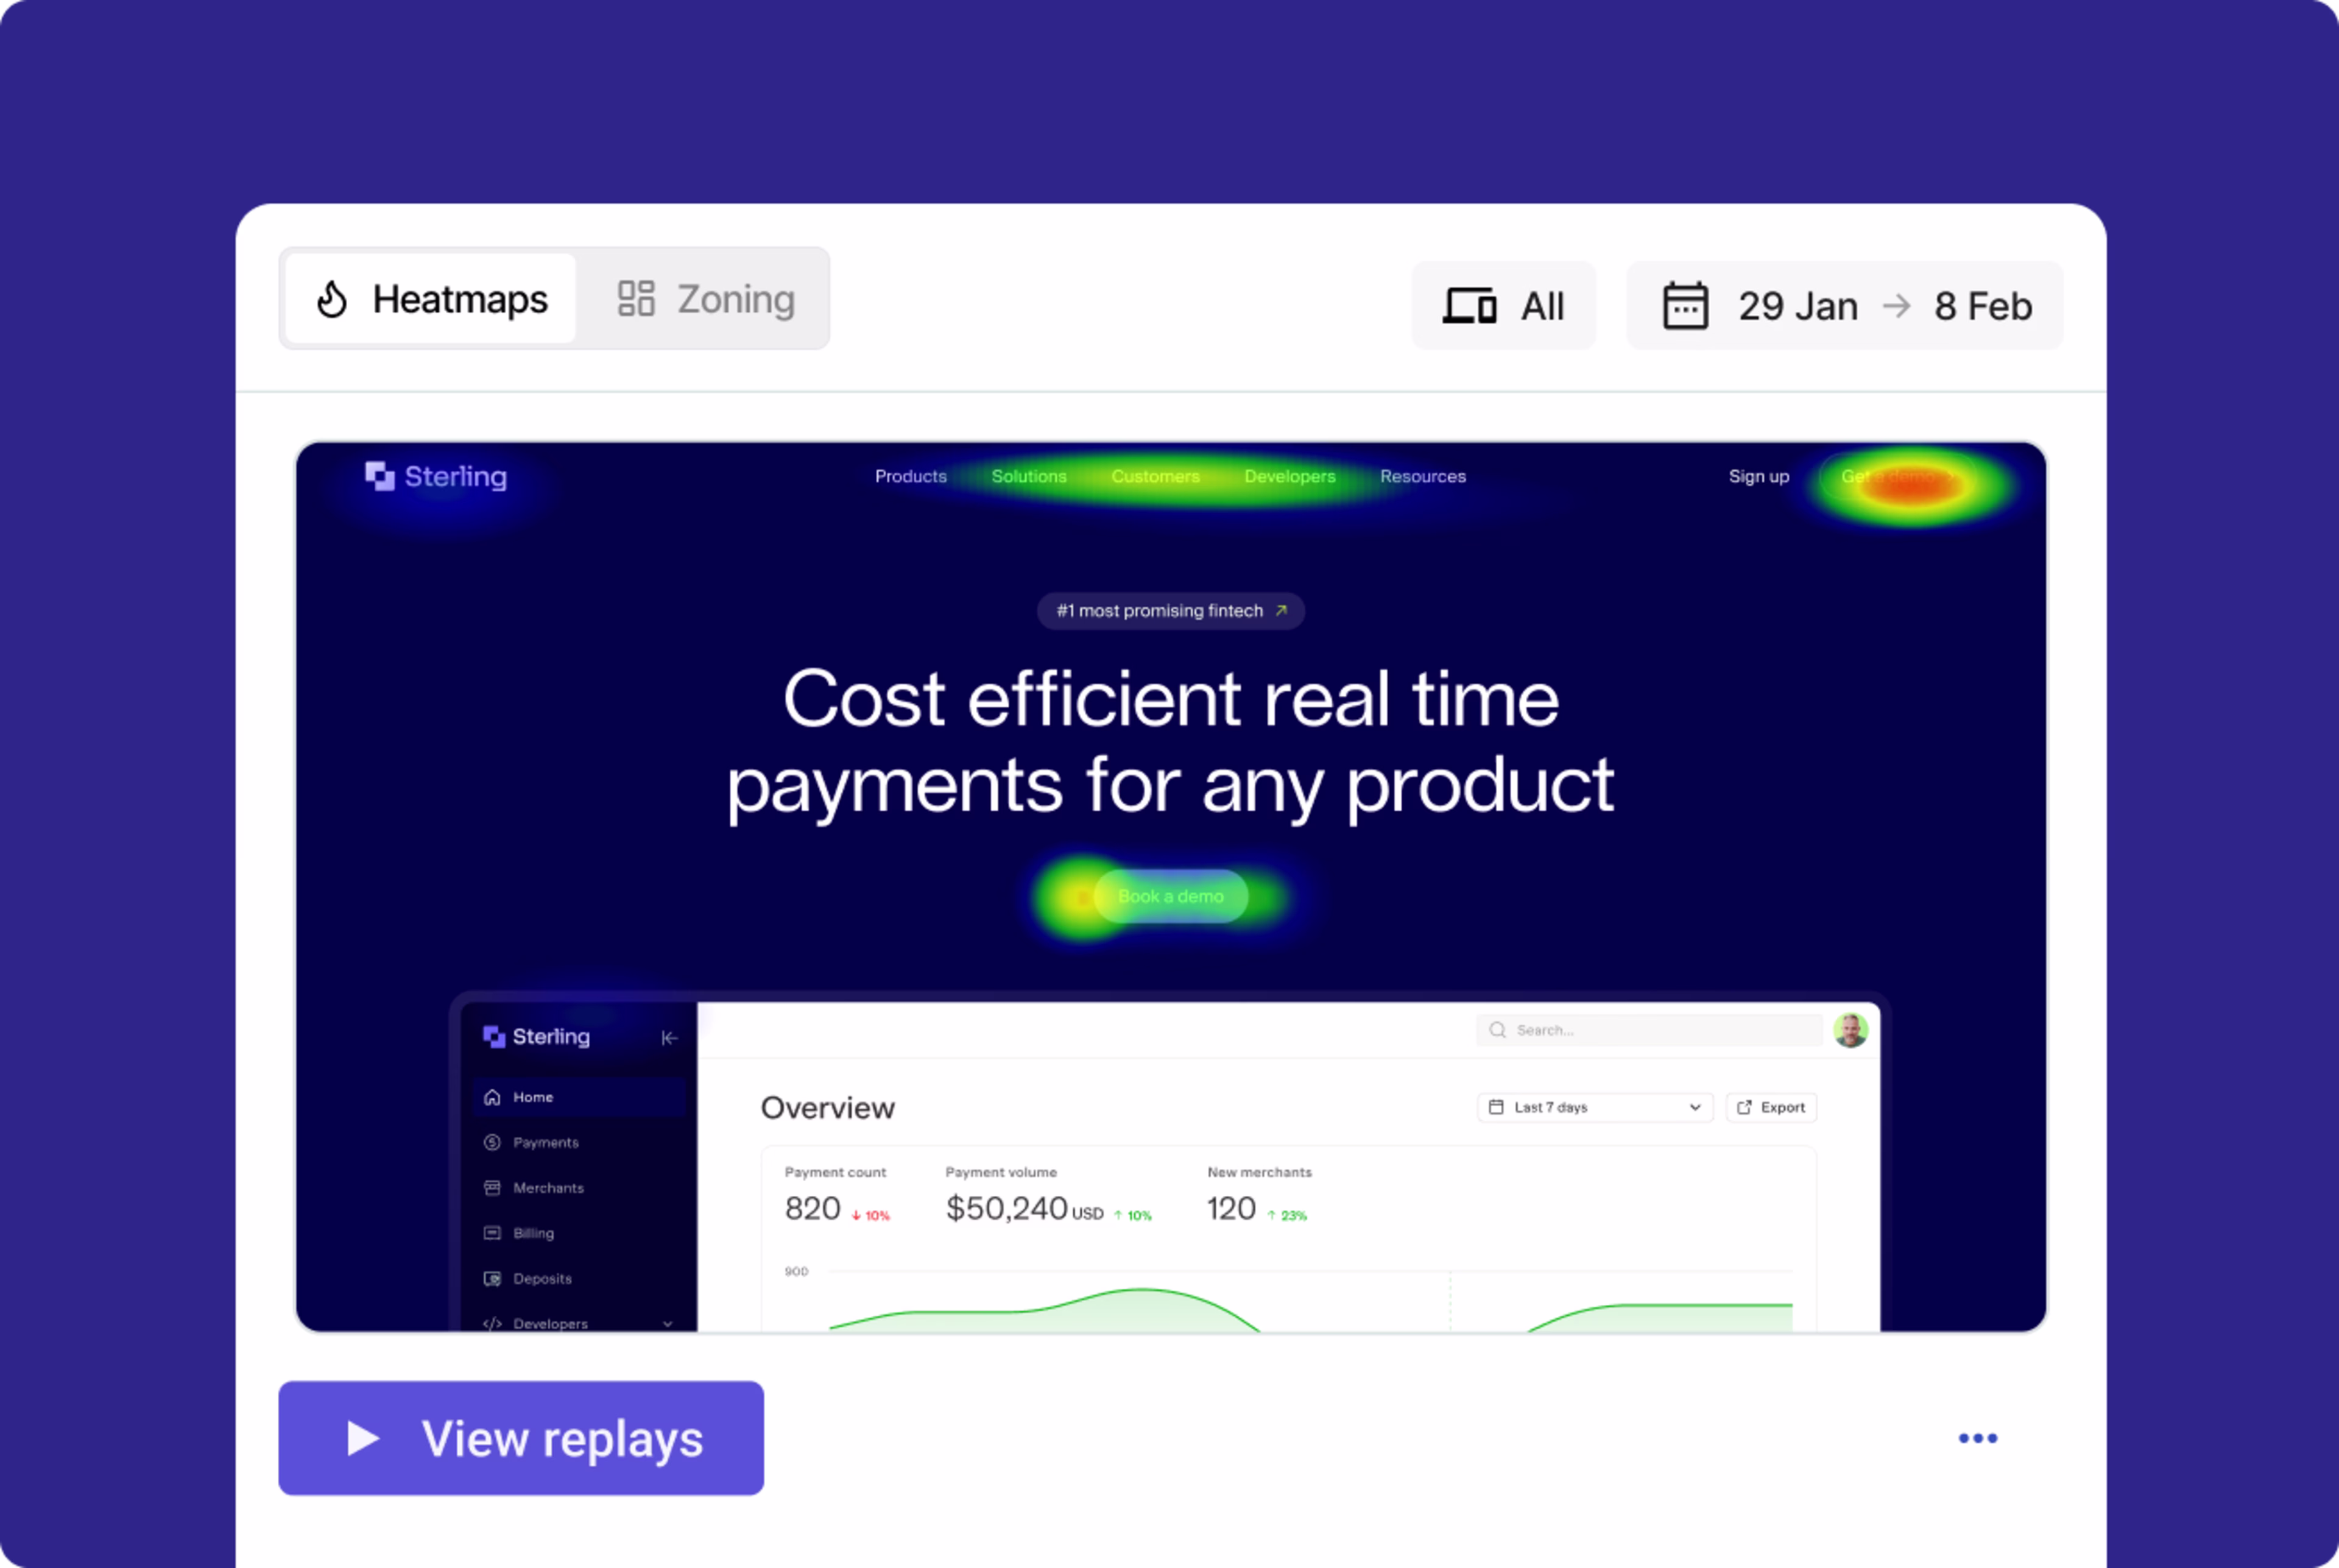
Go from your heatmap to related session replays in Contentsquare with the click of a button (the ‘View replays’ button, to be exact)
Pro tip: enable the Contentsquare and Google Analytics integration to get a deeper understanding of what happens on your site and why. You can even filter your Contentsquare session replays by Google Analytics events—this reveals the user behavior behind your numbers and quickly helps you discover opportunities to improve the customer experience.
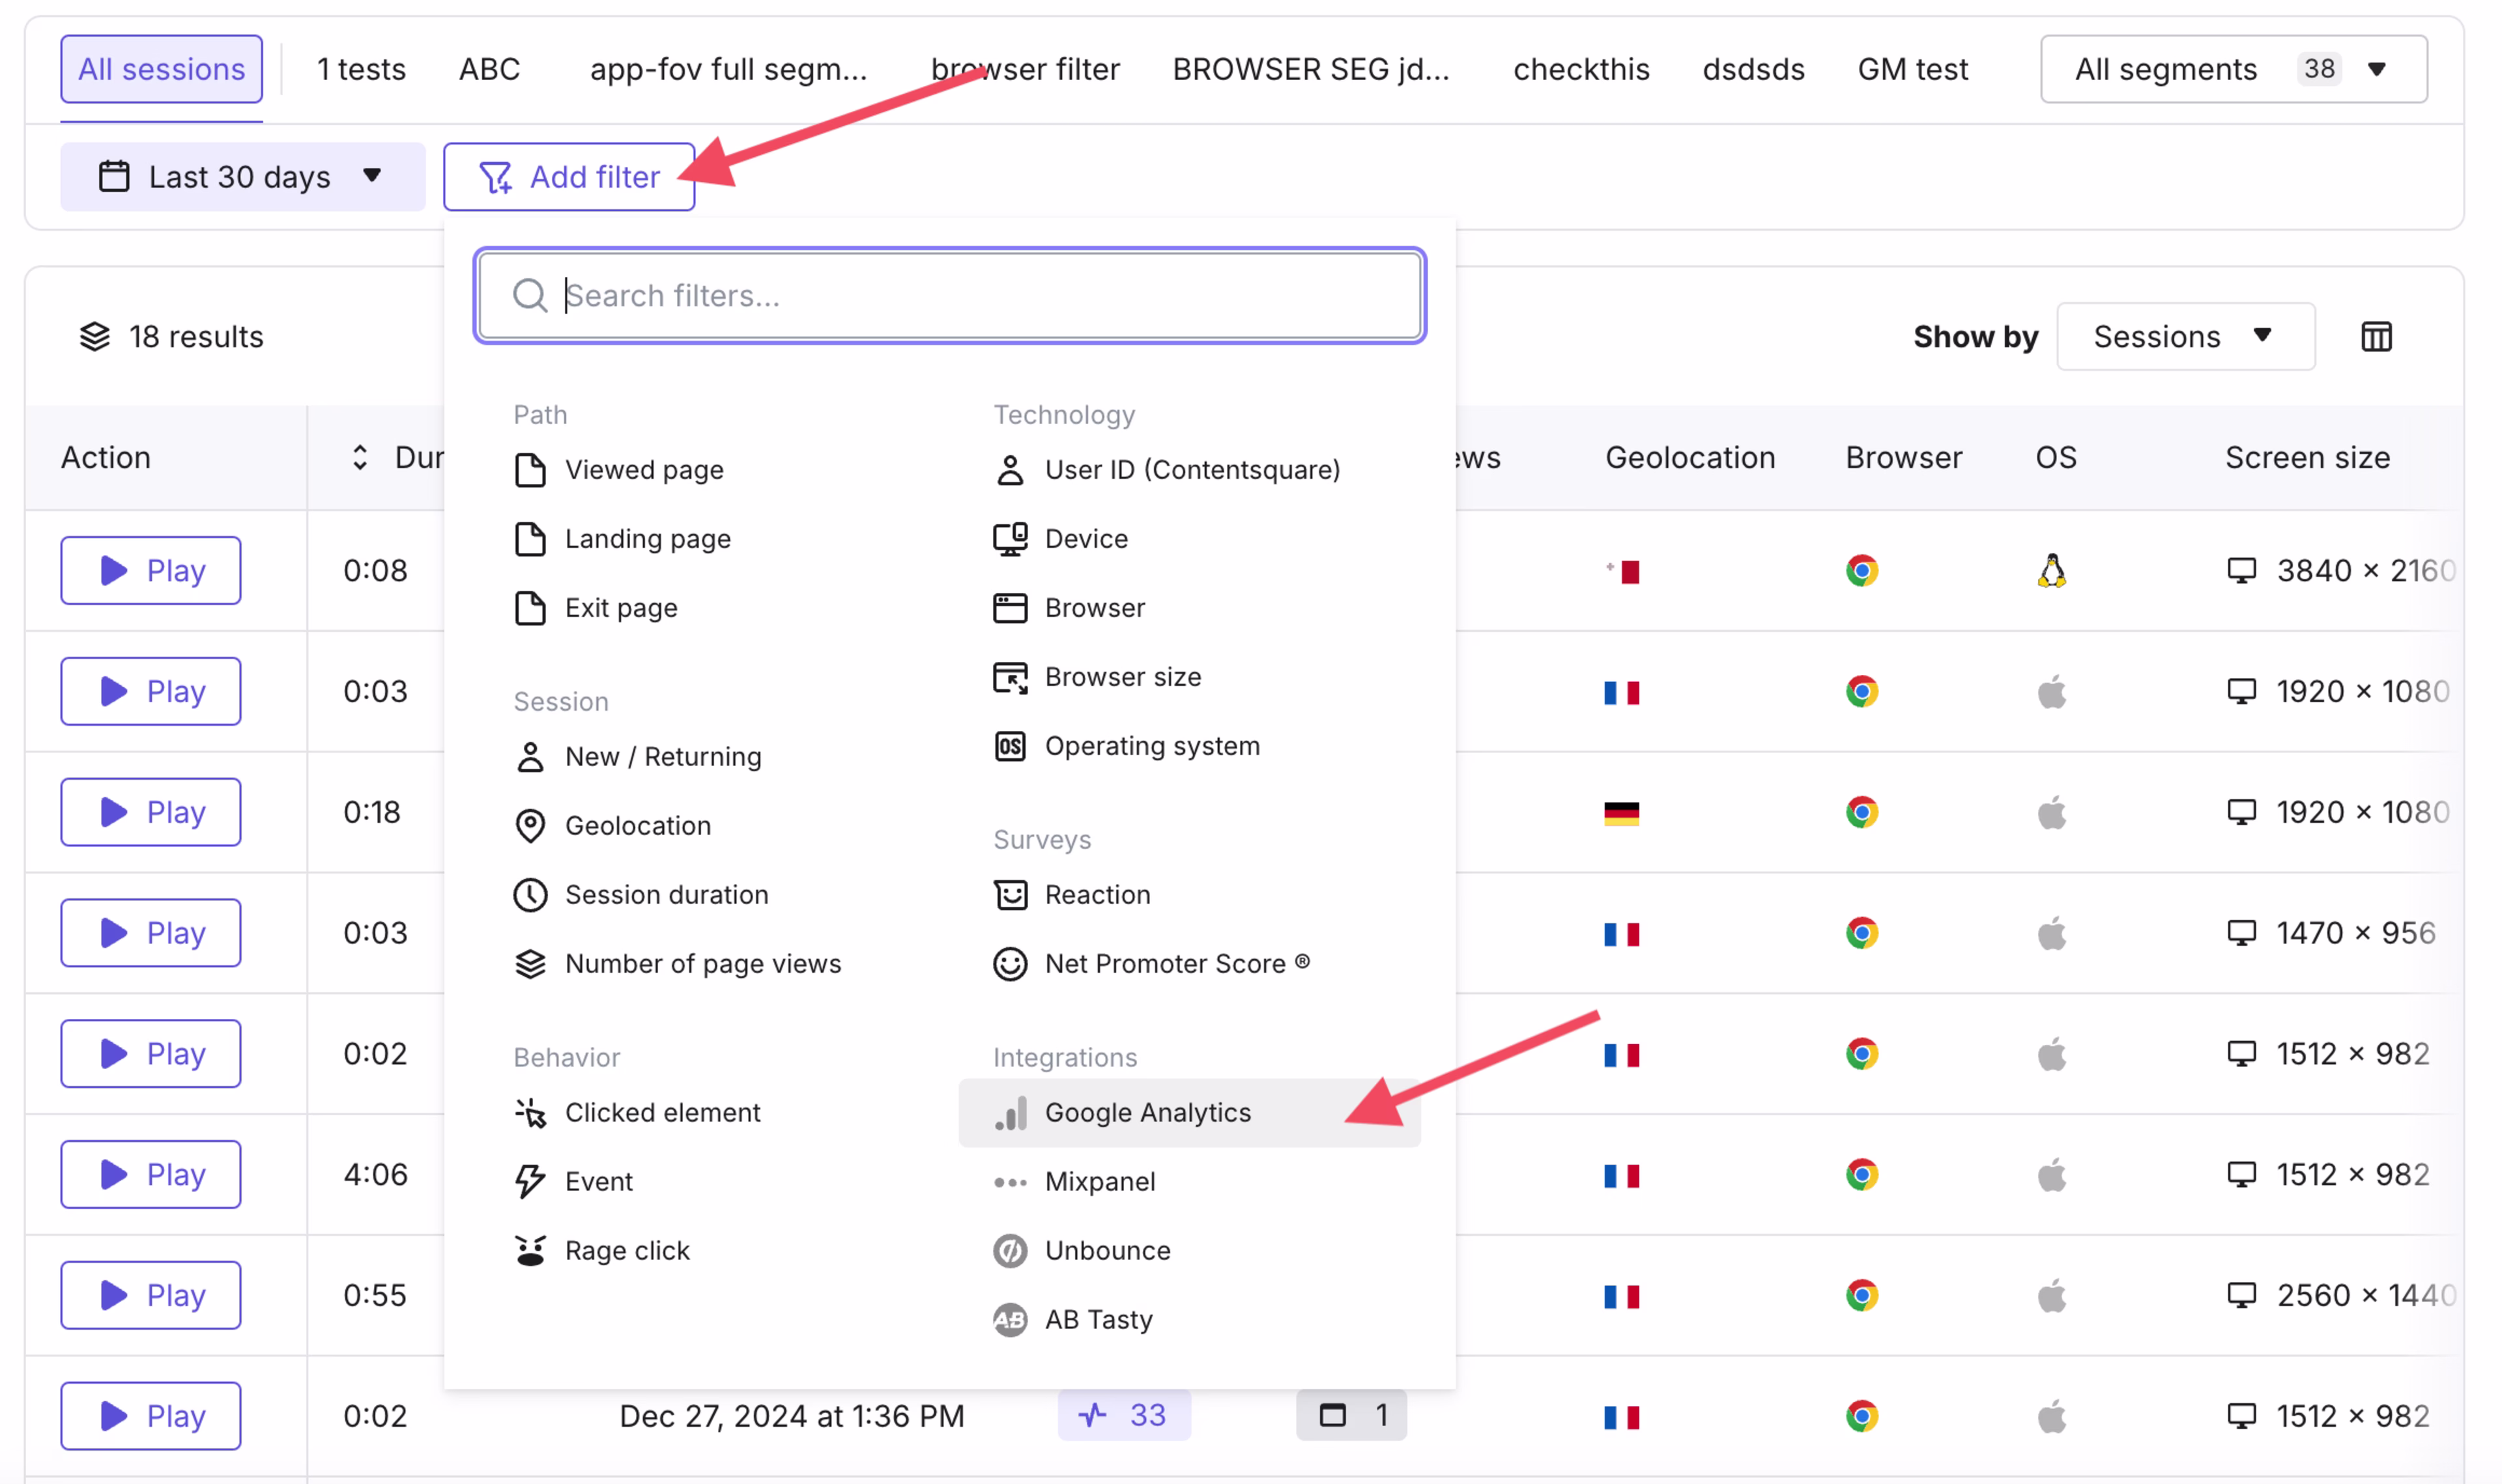
Use the ‘Add filter’ option to apply Google Analytics events to filtering capabilities for session replays.
2. Connect with customers directly to understand what matters to them
The people who use your site are more than numbers in user acquisition reports. To get a full picture of your customers—who they are, what they’re looking for, and what drives them—you need to talk to them directly using tools like Contentquare’s Surveys and Interviews.
Surveys are questionnaires you can trigger for targeted user groups. You can embed them anywhere on your pages or host them on separate web pages to be sent out by email. Use them to ask questions like, “How did you hear about us?” or “Would you recommend our company to a friend?”
Interviews make it easier to meet your users (or participants that match your user demographic from our pool of 200k+ people) face-to-face and 1:1 to discuss your product. Use interviews to dive into customers' pain points and drivers and understand their relationship with your product on a deeper level.
To get started with these tools, use the ‘events’ set up in Google Analytics to trigger a survey when users perform a certain action, like making a purchase. If your survey unlocks a particularly juicy insight, run user interviews to learn more.
Pro tip: create surveys in seconds with Contentsquare AI. Just enter your research goal and sit back as it generates relevant questions based on what you want to learn.
![[visual] Contentsquare-AI-survey-generator](http://images.ctfassets.net/gwbpo1m641r7/R0XvcAmxiHCMbk5hQqmQ2/b65b13b06ea2ebd0f3ba48d3935c1525/Contentsquare-AI-survey-generator.png?w=2048&q=100&fit=fill&fm=avif)
Use Contentsquare AI for Surveys to take the hassle out of creating questions
3. Analyze marketing flows to discover what prevents people from converting
If GA4 reveals a sudden drop in numbers for your conversion funnel, it can be panic-inducing: you know that people didn’t move to the next stage, but if all you have are numbers, you have no idea why not.
Enter: a funnel analysis tool that actually shows you. Contentsquare’s Journey Analysis visualizes the customer journey with a sunburst-shaped chart, which you can interact with to get all the insights you need.
It’ll offer an immediate overview of your funnel and quickly reveal where users drop off. Use filters and segments to get even more granular, so you can understand which marketing channels, locations, and user types have the best results and which ones need improvement.
Once you identify what prevents people from progressing through your funnel, you can address it—reducing customer effort and getting your website conversions back on track.

Contentsquare’s Journey Analysis tool in action
4. Keep on top of your key metrics at a glance
It can be difficult to cut through all the noise in Google Analytics. To stay on top of the metrics that matter to you, create custom dashboards and alerts, which give you overviews of key user behavior data in one place.
Dashboards provide a high-level overview of your site’s key metrics using graphs and charts, reducing the need to switch between GA4 and other tools to get the information you need.
Alerts notify you of any important changes to the metrics that matter most to you—so if, for example, there’s a spike in errors or a sudden drop in page views or users, you’ll be made aware. You can configure which metrics can trigger alerts for your account, and Contentsquare’s AI helps you determine the right reporting threshold.
![[Visual] Contentsquare for Slack](http://images.ctfassets.net/gwbpo1m641r7/113iKQLXi5H7Usy4ADamHj/e6e4bdb7b64b5dda9d92d82c02d522a0/Screenshot_2025-01-10_at_16.42.29.png?w=1920&q=100&fit=fill&fm=avif)
Use Contentsquare’s integrations to receive your alerts wherever makes sense for you—such as in Slack, as shown here
Make user empathy part of your analysis with behavior insights
Secondary dimensions in Google Analytics are an opportunity to look at website analytics from new angles, but they’re just one tool you can use to create a positive customer experience.
Enrich your GA4 data with insights from experience intelligence tools to go beyond the numbers and truly empathize with your customers. Identifying the motivations and needs that drive user behavior lets you tailor your product, marketing campaigns, and customer experience to real users—so you can make long-lasting connections.
FAQs about secondary dimensions in Google Analytics
Every report has a primary dimension, but you don’t have to add a secondary dimension in Google Analytics. Use secondary dimensions in Google Analytics when you want to compare customer sub-segments in more detail.
![[Visual] Contentsquare's Content Team](http://images.ctfassets.net/gwbpo1m641r7/3IVEUbRzFIoC9mf5EJ2qHY/f25ccd2131dfd63f5c63b5b92cc4ba20/Copy_of_Copy_of_BLOG-icp-8117438.jpeg?w=1920&q=100&fit=fill&fm=avif)

![[Stock] Unlocking the power of customer journey visualization – Step by step — Cover Image](http://images.ctfassets.net/gwbpo1m641r7/1E3yKJe4En4Jq36yjJl4vW/f7befc254b7ce2102e5ebe1e4586814b/customer-journey-visualization-people-draw-1.jpg?w=1920&q=100&fit=fill&fm=avif)