![[visual] Blog - anscombe quartet stock image](http://images.ctfassets.net/gwbpo1m641r7/5cPY8sQJxGIEOu052njiCb/b6ff0931add6905d4ff939909663c8f6/adam-satria-uXLgmicKSi4-unsplash.jpg?w=3840&q=100&fit=fill&fm=avif)
In a highly competitive market where user attention is expensive to win and even more difficult to keep, frustration is a major threat to your business. Just a few moments of friction on your site or app can cause users to abandon their journey, negatively impacting conversions, revenue, and brand reputation.
Luckily, recent data from our 2026 Digital Experience Benchmark Report shows that frustration is decreasing overall—but that doesn’t mean the challenge is over. More than a third of all sessions (35.2%) are still impacted by friction, revealing a significant opportunity for businesses to improve their experiences and stand out from the competition.
In this article, we explore 4 core insights about frustration from the report, which examined over 99 billion sessions on 6,500 websites across 9 key industries. Read on to discover how frustration has changed year-over-year, its impact on engagement, and what you need to do today to reduce friction and deliver seamless experiences.
Key insights
Frustration refers to specific moments of friction in the user experience, such as rage clicks, slow-loading pages, excessive hovering, and technical errors
Reducing frustration is important because it helps visitors explore more pages on your site, which is essential for engagement, conversion, and customer satisfaction. This makes it crucial for both acquisition and long-term retention.
When it comes to frustration, the data shows that different industries face different challenges. There’s no one-size-fits-all solution to fixing friction: businesses must explore behavior on their own site to find the biggest pain points impacting their users.
1. Frustration has declined for the second year in a row
User frustration fell -4.3% overall compared to last year, with some industries showing even stronger results:
Frustration in the software industry decreased by -14.5%
Energy, utilities, and construction saw a -6.5% drop
Frustration on retail sites decreased by -6%
The biggest improvement is in speed. Slow page loads declined by -20%, now impacting just 1 in 10 (10.9%) sessions, removing a major source of early abandonment.
But while cross-industry trends are mostly positive, there’s one noteworthy exception: frustration on travel sites increased by +7.6% YoY. Travel and hospitality is the only industry where frustration increased rather than decreased, with significant increases in API error rate (+20.6%), JavaScript error rate (+20%), and multiple button clicks (+14.3%), as well as several other friction factors.
What does this mean for you?
This YoY trend shows that organizations take reducing friction seriously. But as smoother, less frustrating digital experiences become the norm, it also raises the bar for businesses.
Now, visitors expect better experiences to be standard practice—like faster load times and fewer errors—meaning that any issues they do experience will have a more negative impact.
Teams can’t become complacent: they need to maintain momentum to ensure they continue to deliver the baseline performance levels users demand.
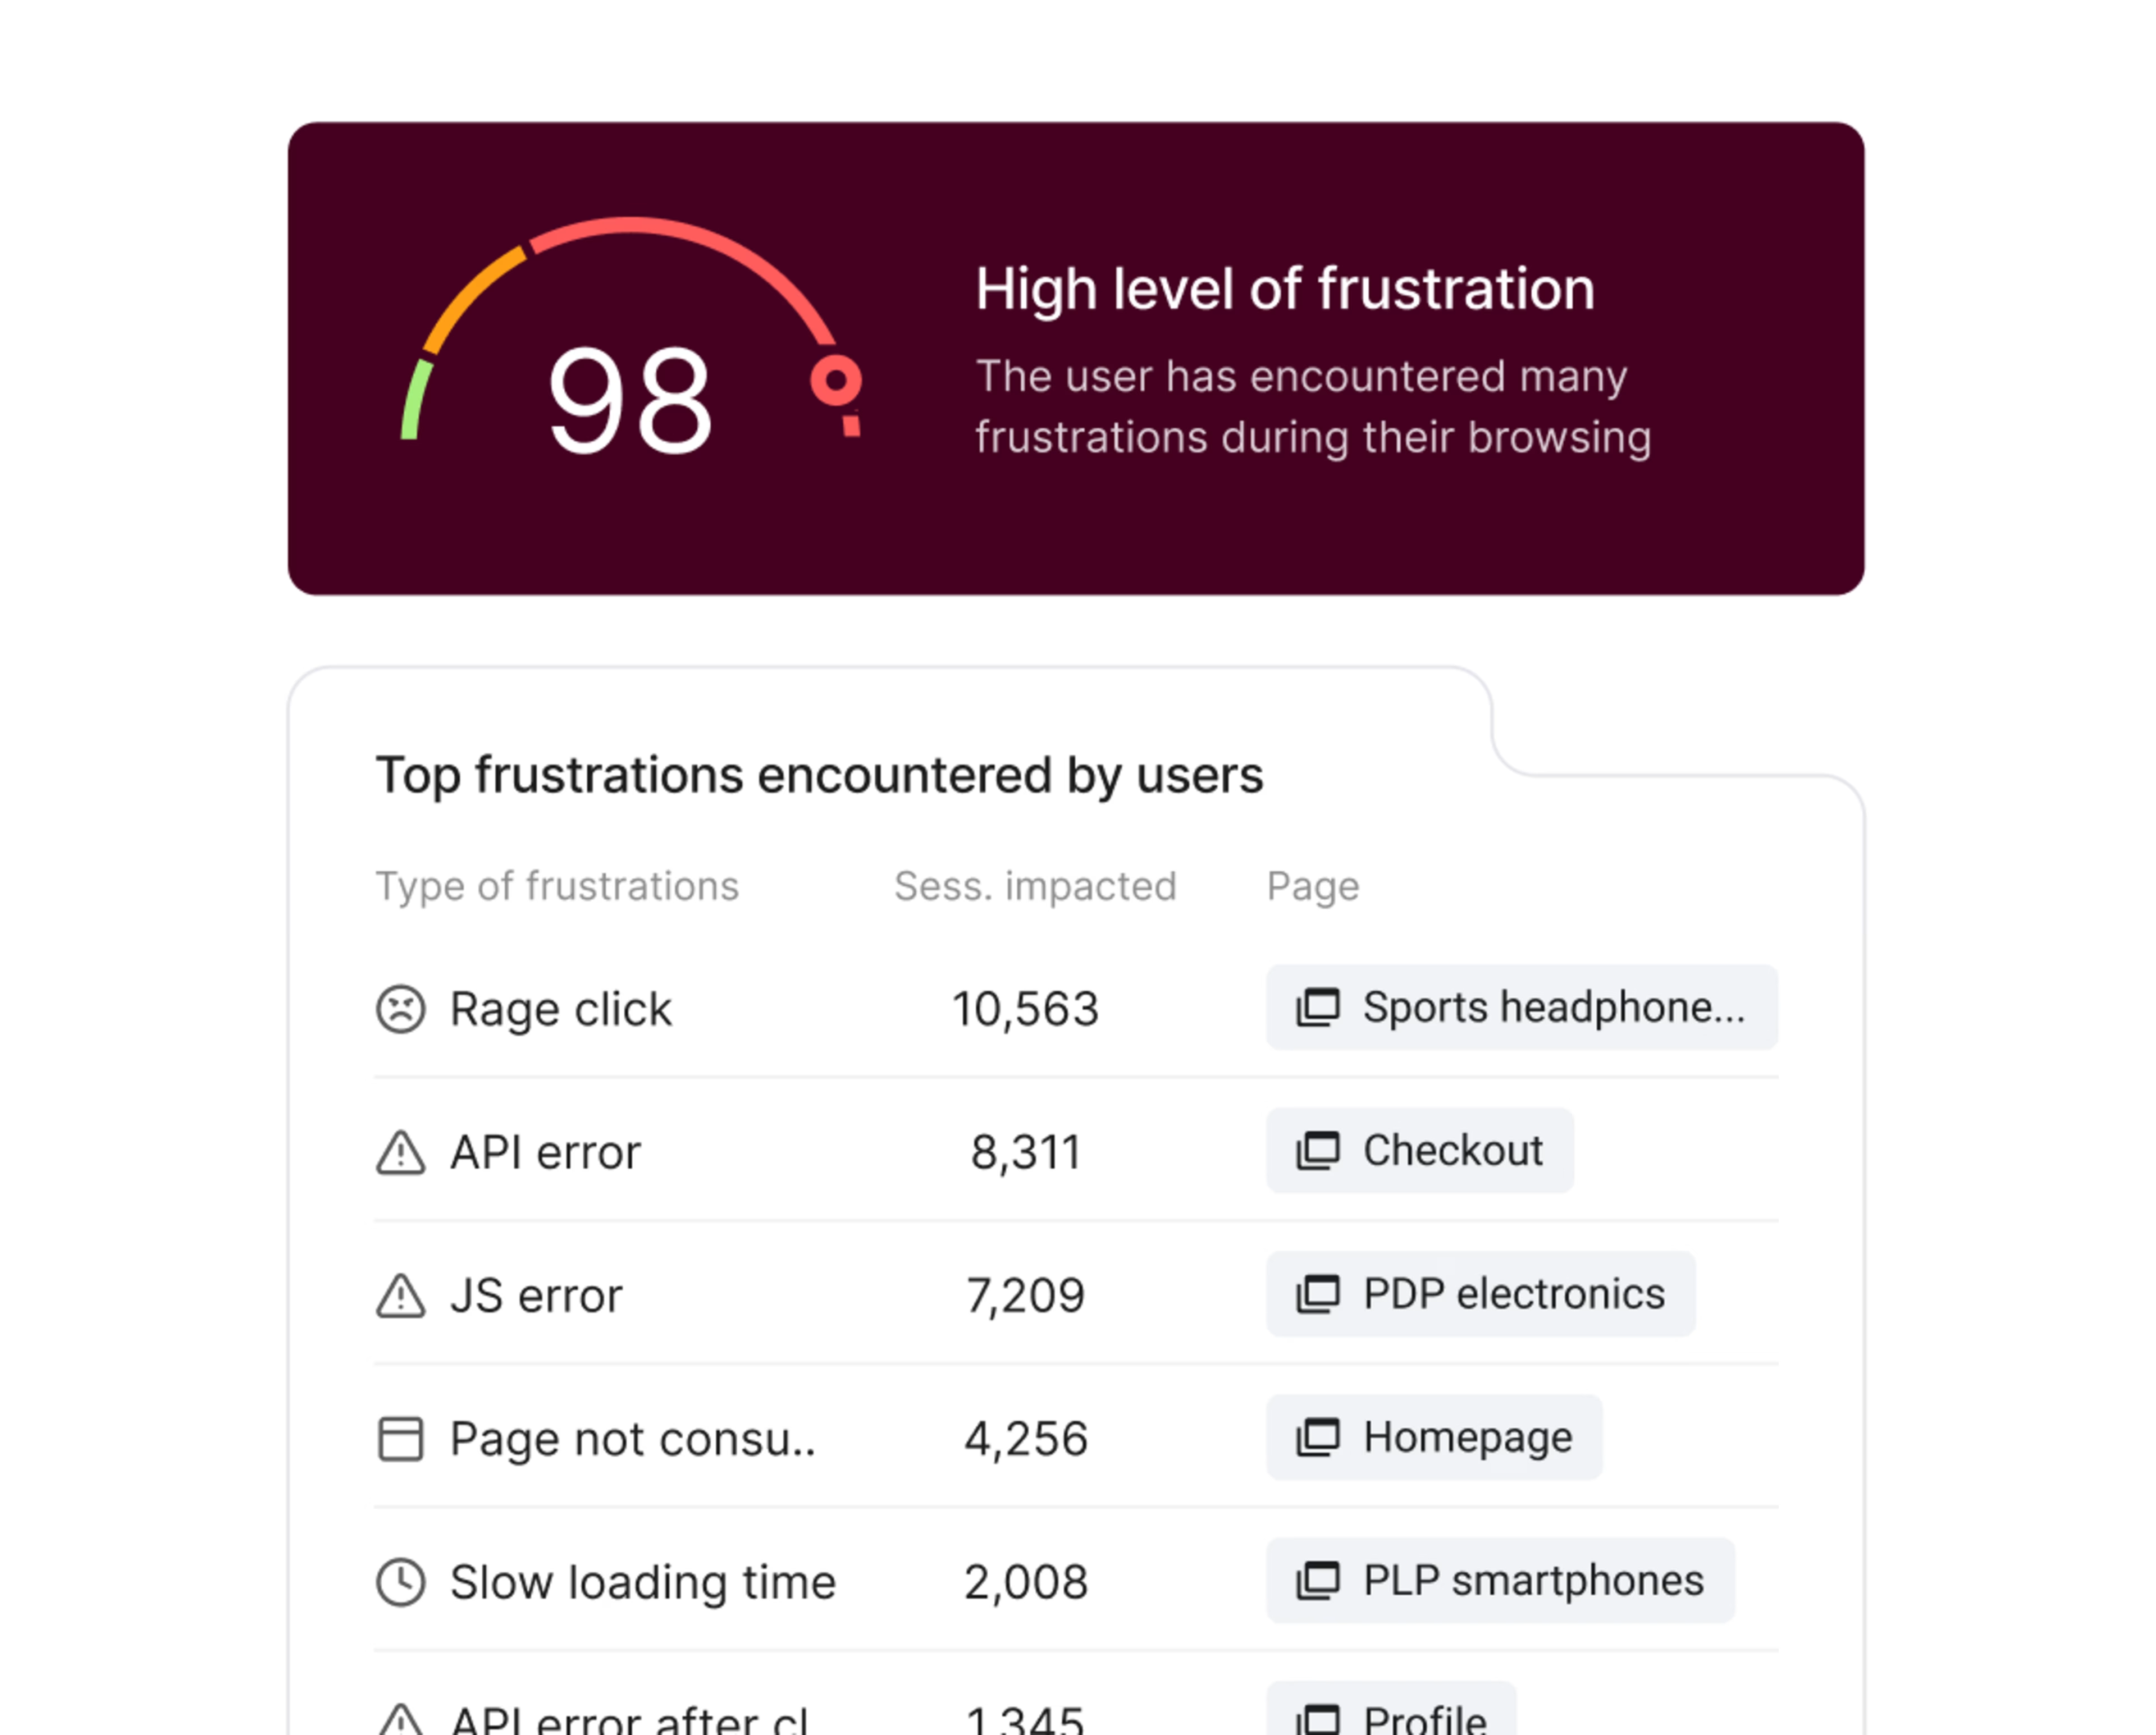
💡 Pro tip: use AI-powered frustration signals and rage analytics to automatically surface—and prioritize—the most impactful instances of friction. Contentsquare’s Frustration Score detects multiple sources of friction and assigns each session a score from 0–100, ranking them by business impact so you can quickly address the most painful issues hurting your site.
2. API errors are the new frustration factor to watch
Across all industries, almost every frustration factor decreased—but 3 grew YoY.
JavaScript error rates increased by just +0.3% across all industries. When we dig deeper, however, we see that this is mostly due to significant increases in 2 key industries: financial services (+18.1%) and travel and hospitality (+20%).
Rage clicks also increased +1.5% overall. Again, we see a wide discrepancy across industries: rage clicks decreased by -7.9% in the media industry, while they rose +7.4% in travel and hospitality.
But the biggest new frustration factor—and one to watch across all industries—is API error rate.
Overall, API errors rose +16% YoY, making it a rapidly emerging issue. The rate increased in every industry except energy, utilities, and construction (decreasing by -16.5% YoY) and software (decreasing by -13.8% YoY). In particular, it’s a rising source of frustration on finance sites, where it grew +22.8% compared to last year.
API error rates currently account for 7.8% of sessions with frustration, making it the third-most common cause of frustration overall.
What does this mean for you?
APIs play a central role in personalizing experiences, delivering content, and connecting systems to enhance functionality.
As sites become more integration-driven and experiences are assembled dynamically—that is, by pulling data from one system to enrich another—proactively monitoring and resolving API errors is critical. Brands that can quickly detect and fix API issues will be better positioned to protect engagement and improve conversions.
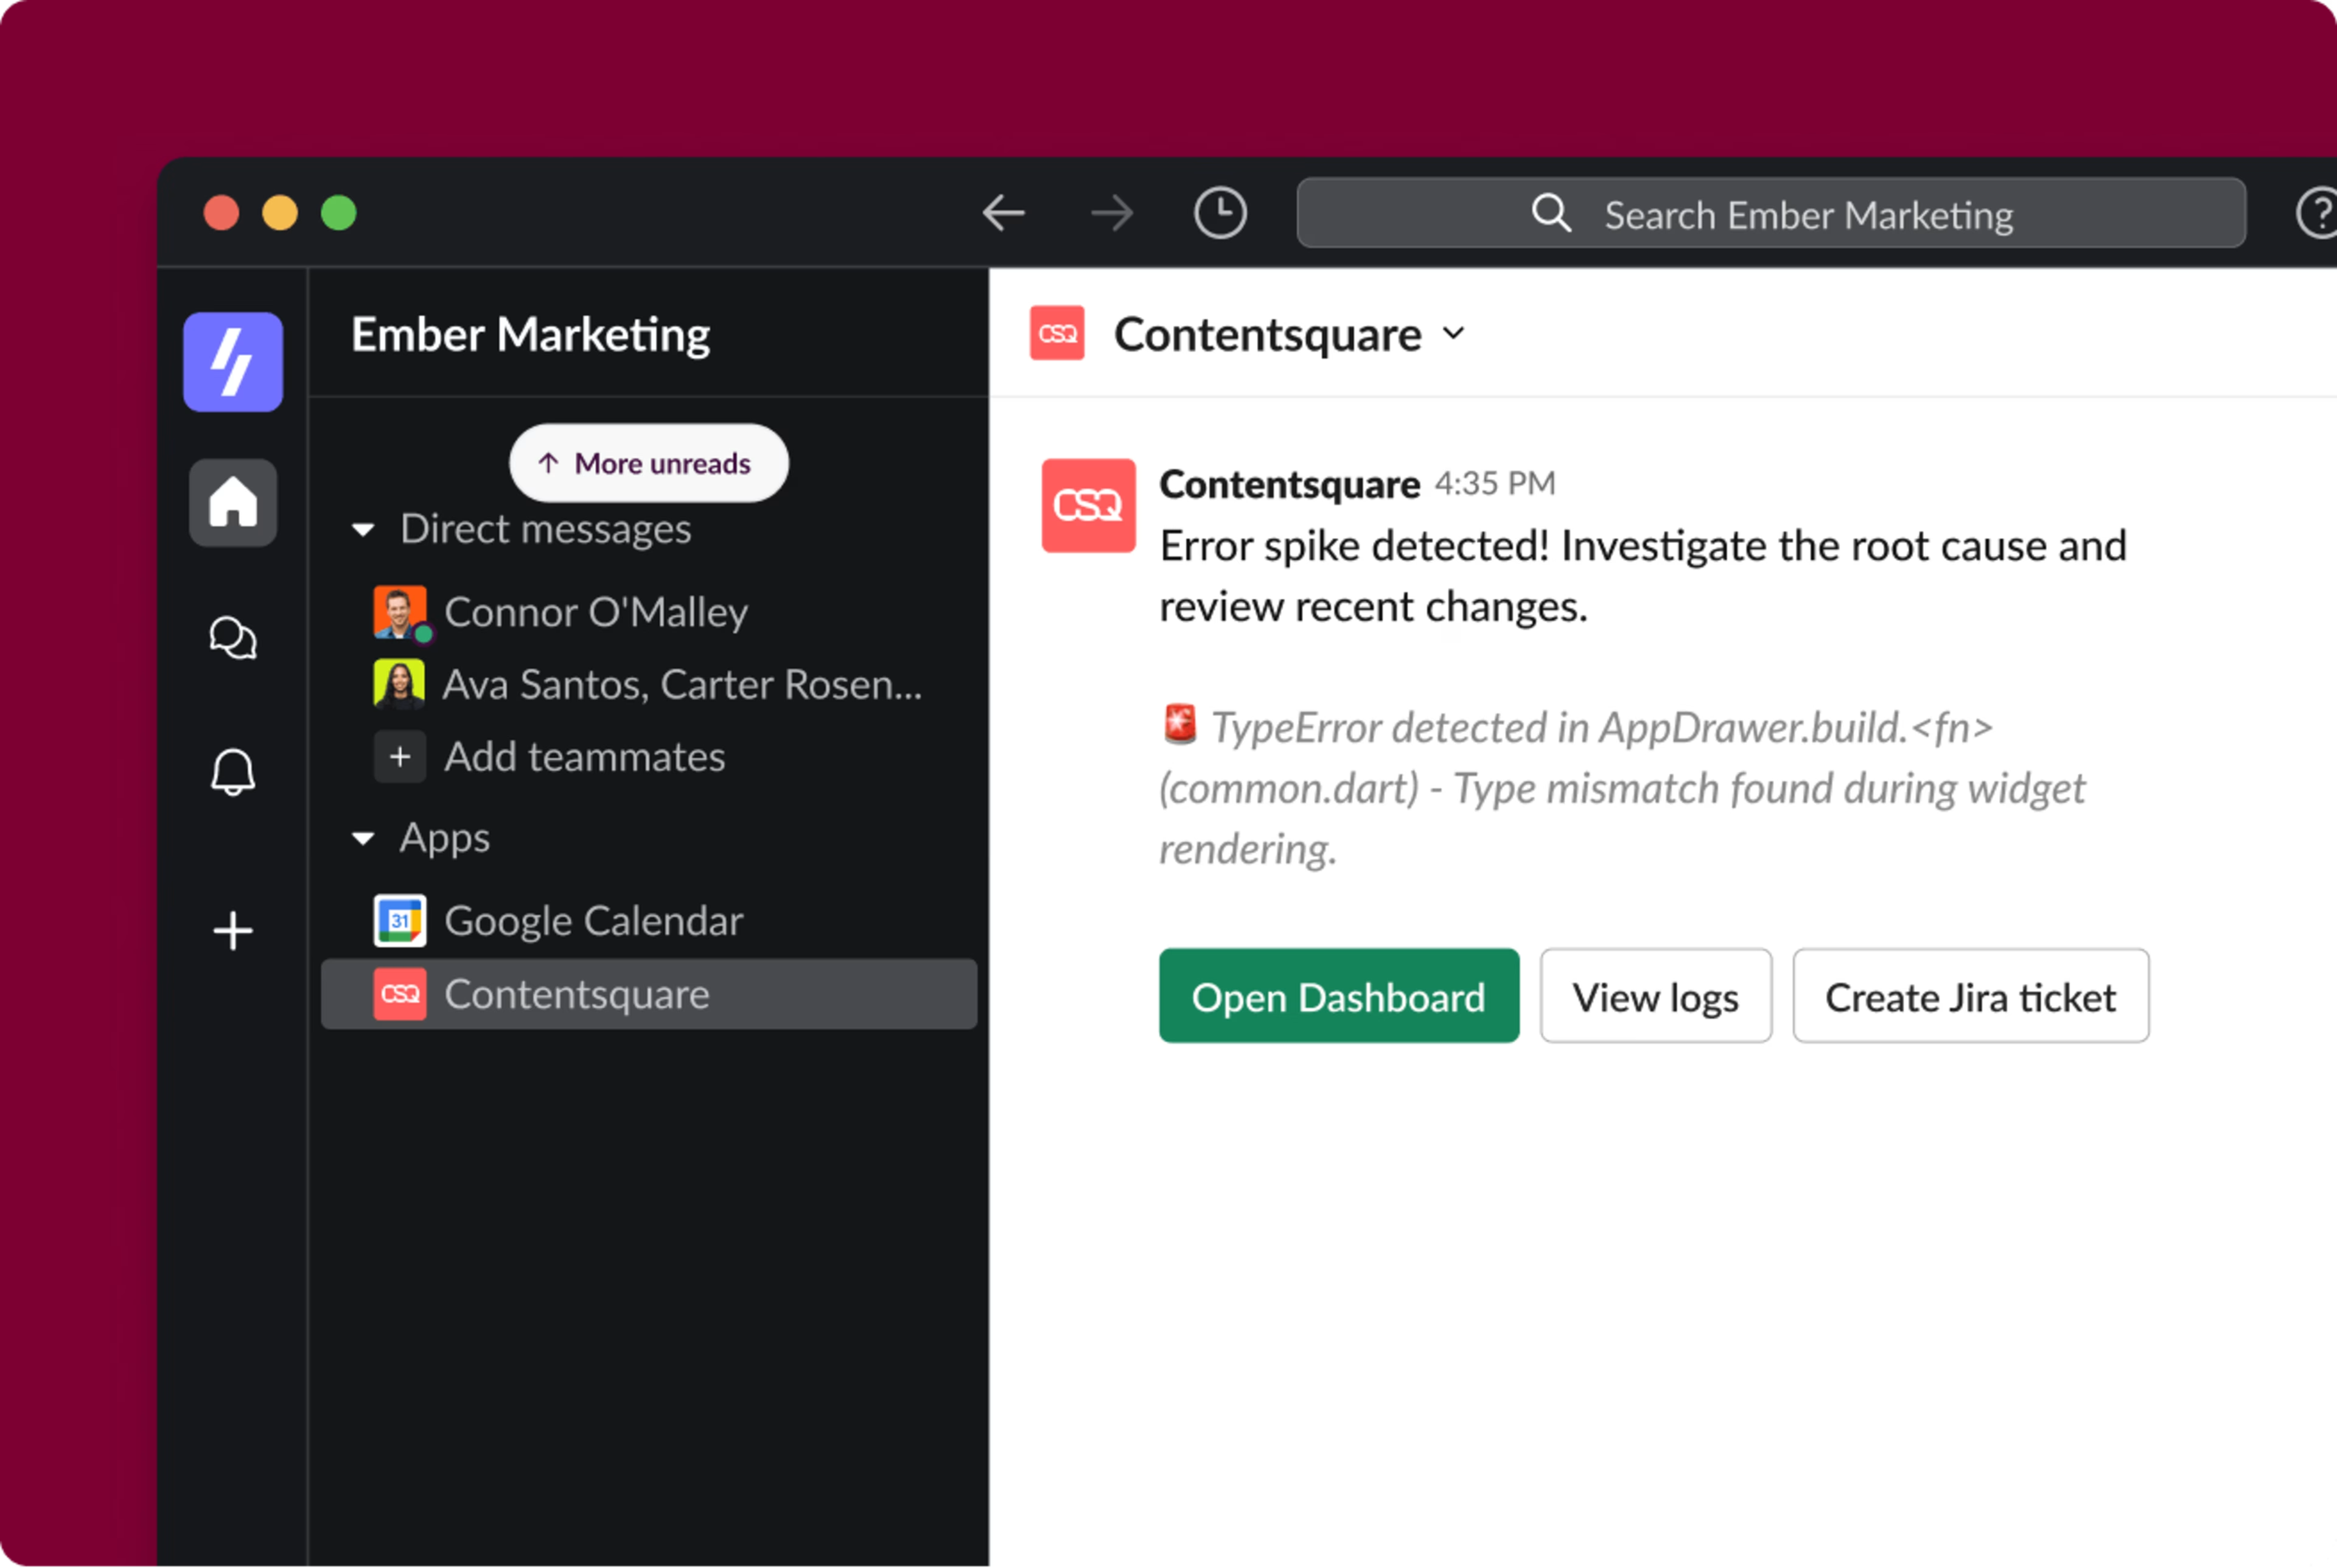
💡 Pro tip: use Contentsquare’s Error Analysis capability to detect API and 404 errors, and even get real-time error alerts in your workspace of choice, like Slack or Microsoft Teams channels, so you never miss user frustration.
You can even quickly create a Jira ticket (as seen in the image below) for your technical team with one click, giving them all the data they need to fix the issue.
3. Analyzing pages individually helps reduce friction, increase engagement
Session-level metrics remain a useful signal of frustration, but there’s an important caveat: longer sessions naturally create more opportunities for friction.
Page-level analysis is the missing link to understanding how frustration really affects outcomes. The report data shows that reducing rage clicks per page by -1.5 percentage points adds another page view to each session, encouraging users to explore your site further.
This means that reducing frustration on individual pages meaningfully extends sessions—and has a measurable impact on engagement.
What does this mean for you?
Small improvements can have an outsized impact. Make frustration monitoring a part of your team’s culture to build continuous improvement into your workflow.
For example, use rage click maps to surface page-level frustration on key pages—like your homepage, landing pages, product detail pages (PDPs), or checkout page—and identify optimization opportunities.
💡 Pro tip: understand how individual pages affect user engagement, so you can connect this friction to business-level outcomes like retention and revenue.
With Data Connect, you can automatically sync frustration and behavioral data from Contentsquare to your warehouse, then use it to build advanced analytics capabilities like churn prediction models based on frustration signals and engagement patterns.
4. Hidden user friction is the next big challenge in experience optimization
As businesses reduce common sources of friction and user expectations increase, teams must move beyond the basics. Site performance is table stakes, and it’s no longer enough to reactively fix what’s broken.
In 2026, you must proactively address more subtle and complex sources of user friction, like cognitive and emotional friction. These include
Unclear information hierarchies
Hard-to-find content
Looping or stalling journeys
These hidden types of friction are harder to detect, but they can quietly degrade user trust and satisfaction.
What does this mean for you?
Proactively removing user friction before it even happens helps you elevate user experiences beyond the baseline.
These frustration-free, seamless journeys don’t just enable users to engage more deeply with your site; they become a true differentiator for your business, helping you stand out against less user-centric competitors.
💡 Pro tip: get a nuanced understanding of how different types of frustration impact real users using Contentsquare’s Session Replay capability. Watch what happens when users experience cognitive or emotional friction, and see what they did before and after that moment to understand how it impacts overall journeys.
If you don’t have time to watch the recordings, Session Replay Summaries analyzes hours of footage for you, giving you key insights, potential issues, and behavioral trends. Chat with Contentsquare’s AI, Sense, to dive deeper into your data and ask for clear, targeted recommendations on what to do next to make the biggest improvements.
![[Visual] CSQ-Frustration-Score](http://images.ctfassets.net/gwbpo1m641r7/42XUbRA4QZNcWpukMpln1m/44c3ab68cd5de383e3811680e94bd8a5/CSQ-Frustration-Score.png?w=3840&q=100&fit=fill&fm=avif)
Even small experience fixes make a big impact
The headline is positive, but teams can’t afford to lose focus. As frustration decreases, standards—and user expectations—for page performance increase, and even small spikes in friction can have negative and lasting effects.
Businesses must remain laser-focused on finding and fixing frustration. Build frustration monitoring into your team’s culture and empower everyone, from marketing to product teams, to dig into behavioral data and understand its causes and effects. Only then can you make meaningful, data-driven improvements that benefit both your users and your business.
FAQs about digital frustration benchmarks
Overall, frustration has dropped by -4.3% compared to last year. This is a positive sign, but teams can’t become complacent. Frustration still affects more than a third of sessions (35.2%), and certain types of frustration, like API errors, are on the rise.
As frustration-free site performance becomes table stakes, any instance of frustration can have an outsized impact. Teams must continuously monitor for technical issues, while also looking for ways to enhance user experiences by removing more ‘hidden’ sources of frustration.
![[Visual] Contentsquare's Content Team](http://images.ctfassets.net/gwbpo1m641r7/3IVEUbRzFIoC9mf5EJ2qHY/f25ccd2131dfd63f5c63b5b92cc4ba20/Copy_of_Copy_of_BLOG-icp-8117438.jpeg?w=1920&q=100&fit=fill&fm=avif)