![[Visual] [Guide] Customer retention - Saas Stock image](http://images.ctfassets.net/gwbpo1m641r7/2Lmp9XhnD3Za2Q7fDglUJB/635404b1e617e2aa950703f719c0f0fa/Woman_with_Curly_Hair_Using_Tablet_on_Couch_Indoors.jpg?w=3840&q=100&fit=fill&fm=avif)
As search and discovery evolve with the rapid use of AI, we’re witnessing a change in how users engage with websites. Recent data from our 2026 Digital Experience Benchmark Report reveals that today’s visitors are consuming less content but showing higher levels of intent.
This means users are arriving with a clearer sense of what they want. This means that, to capture their attention and transform it into long-term loyalty, you need to deeply understand what’s driving visits and deliver targeted experiences that earn their engagement.
Read on to discover 4 key findings from our 2026 Digital Benchmarks Report, where we explored data from 99 billion web and app sessions, looking at cross-device behavior on 6,500 websites across 9 industries, and check out the other chapters in this guide to learn more.
Key insights
Engagement—how much visitors interact (or ‘engage’) with your website—is a critical KPI for any business, often used as an indicator that users are getting value from your site or product. We measured engagement using metrics such as page views per session, scroll rate, time spent per visit, and bounce rate to understand how traffic translates into meaningful engagement.
As acquisition costs continue to rise and traffic is harder to win, retention becomes an even more essential lever. By deepening engagement for both new and returning visitors, you can build stronger customer relationships that encourage long-term loyalty from day 1.
1. Engagement rates have dropped—but that’s not a bad thing
Overall user engagement rates dropped by –10% compared to last year. The research found that:
Time on site fell –7%
Page views per session declined –1%
Scroll rate decreased –2%
But while these stats may initially seem alarming, the full picture is more encouraging. Rather than general disengagement, these declines signal a broader shift in user behavior.
We see this when we look at bounce rates, which improve year-on-year for several key channels:
AI-referred traffic –5%
Paid search –3%
Organic search –4%
The takeaway? Yes, visitors are spending less time browsing, but that’s because they’re arriving with clearer intent.
What does this mean for you?
To capture and maintain engagement, businesses must meet search intent immediately.
To do this, you need a clear understanding of what customers are looking for, as well as which channels they came from. Equipped with these insights, you can create seamless multi-channel journeys that reduce friction and anticipate user needs, leading to deeper engagement where it really matters.
💡 Pro tip: use Contentsquare’s Journey Analysis to uncover how high-intent visitors navigate your site. Work backwards from desired outcomes—like journeys that end in conversions or purchases—to understand the behaviors and touchpoints that influence user decisions, then encourage more visitors to take similar paths or actions.
Segment journeys by channel, device, or audience to discover how different factors impact navigation, understand what users are really looking for, and find opportunities to boost conversions—for example, by optimizing for AI-influenced, high-intent traffic.
![[Visual] Journey analysis on reference mapping](http://images.ctfassets.net/gwbpo1m641r7/30V6WdNQ7xg3mlOFV7DkmY/0e2235977563e2c759fdbd873d51ae59/01-Masthead__1_.png?w=3840&q=100&fit=fill&fm=avif)
2. Design for desktop depth, not just mobile reach
Mobile may take the largest traffic share (70%), but while desktop accounts for under a third of visits, it drives almost 47% of total time spent on site.
The data shows that website engagement is higher on desktop compared to mobile across a range of metrics:
2x time spent per session: 4:46 mins on desktop vs. 2:20 mins on mobile
Scroll rate is 5 percentage points higher: 50.5% on desktop vs. 45.2% on mobile
Desktop traffic converts 75% higher: average conversion rates are 3.4% on desktop vs. 2% on mobile. This is even higher for retail (3.7% vs. 2%) and travel and hospitality (4.5% vs. 2.1%).
When it comes to depth of engagement, desktop remains crucial to engaging and converting users.
What does this mean for you?
Don’t overlook desktop experiences in favor of mobile app engagement. Teams that optimize for both desktop and mobile—and address the nuances of both to create truly user-centric experiences—will gain a significant advantage.
💡 Pro tip: watch how user journeys differ by device with Session Replay. Anonymized recordings show you exactly how mobile and desktop users navigate your site, where they click or tap, and what they miss on different screen sizes.
Accelerate analysis with AI-powered Session Replay Summaries, which extract the key insights from hours of footage. Jump straight to relevant moments to see what happens before, during, and after friction, and share clips with cross-functional colleagues (like your web, marketing, or technical teams) to quickly resolve issues before they affect revenue.
![[Visual] Session replays AI summaries](http://images.ctfassets.net/gwbpo1m641r7/513RGRBy7acZFtxrrMg1cE/7f6851e3d8f3c4ca804c3e8cde0f847a/Session_replays_summaries.png?w=3840&q=100&fit=fill&fm=avif)
3. Product detail pages can make or break your engagement strategy
1 in 3 visits now starts on a product detail page (PDP), with these pages driving roughly 40% of total page views. At the same time, 61% of visits to these PDPs bounce.
Why is engagement on these pages so challenging?
PDPs work best when intent is high, but they’re now receiving a broader mix of traffic due to factors like AI. As a result, many visitors are landing on pages that simply don’t speak to them at their stage of the journey, leading to lost opportunities.
What does this mean for you?
PDPs are no longer exclusively for high-intent, ready-to-convert users who already know exactly what they want. In 2026, these pages must address multiple levels of intent, including early-stage visitors who are still in the exploration phase.
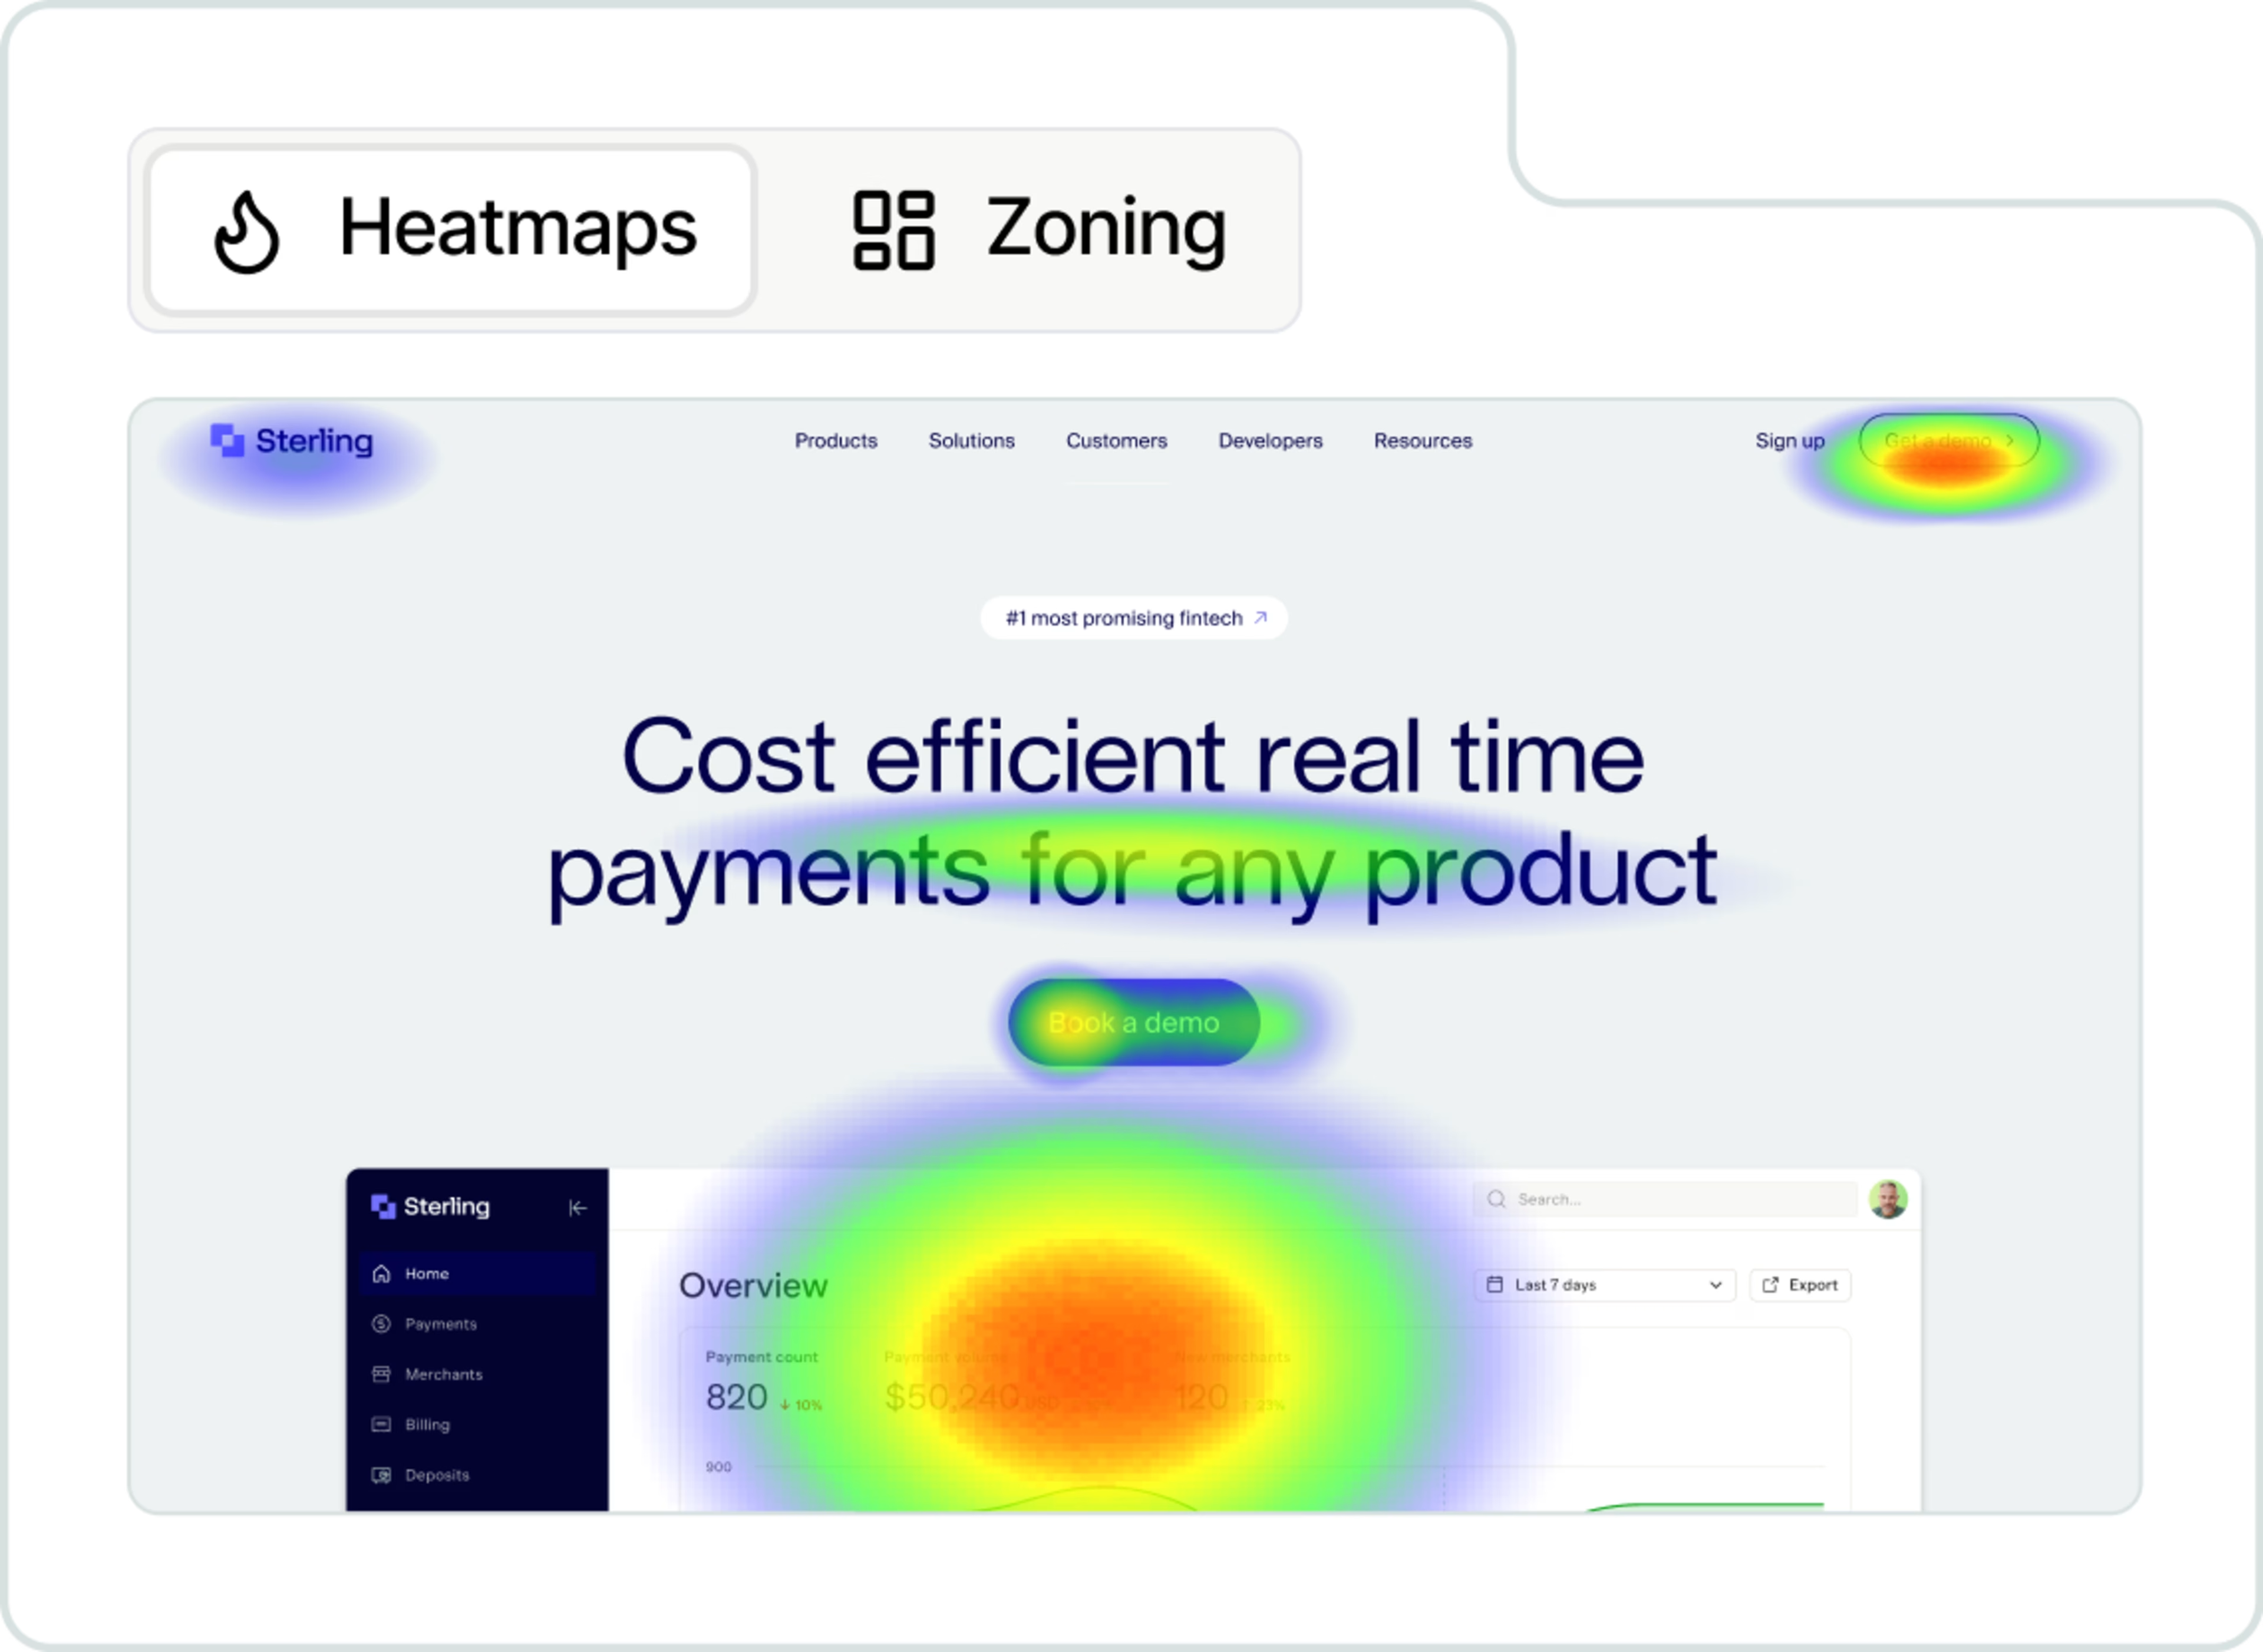
💡 Pro tip: use Contentsquare Heatmaps and zone-based insights to see which areas of your PDPs visitors notice, ignore, or interact with. Segment by source (like paid ads or AI-referred traffic) to uncover which zones capture engagement and drive revenue for users at different levels of intent.
Use these insights to optimize your PDPs and guide more visitors to the right next step for them—whether that’s detailed product information that helps users at the bottom of the funnel confidently make a purchase or educational blog posts that nurture low-intent users who aren’t yet ready to buy.
4. Personalization and segmentation are critical to engagement growth
In addition to differences by device, the data also reveals key differences by industry. For example, the benchmarks for engagement on finance sites are different from those for general services: the overall time spent per session for services is over twice of that of financial services (5:40 mins vs. 2:47 mins).
It’s a valuable reminder that you need specific benchmarks to gauge your progress—and that tactics need to be personalized to each audience. What works to increase engagement on retail sites may not have the same impact on engagement in travel and hospitality.
Similarly, capturing the attention of new users requires a different approach from that of returning users. The more you can tailor experiences to each audience segment, the more meaningful that engagement will be.
What does this mean for you?
There’s no one-size-fits-all approach to engagement. This is why it’s so important to drill into real data to understand how different segments interact with your site, what’s driving their visits, and where they get frustrated and switch off. Only then can you make informed, strategic decisions to boost engagement on key pages.
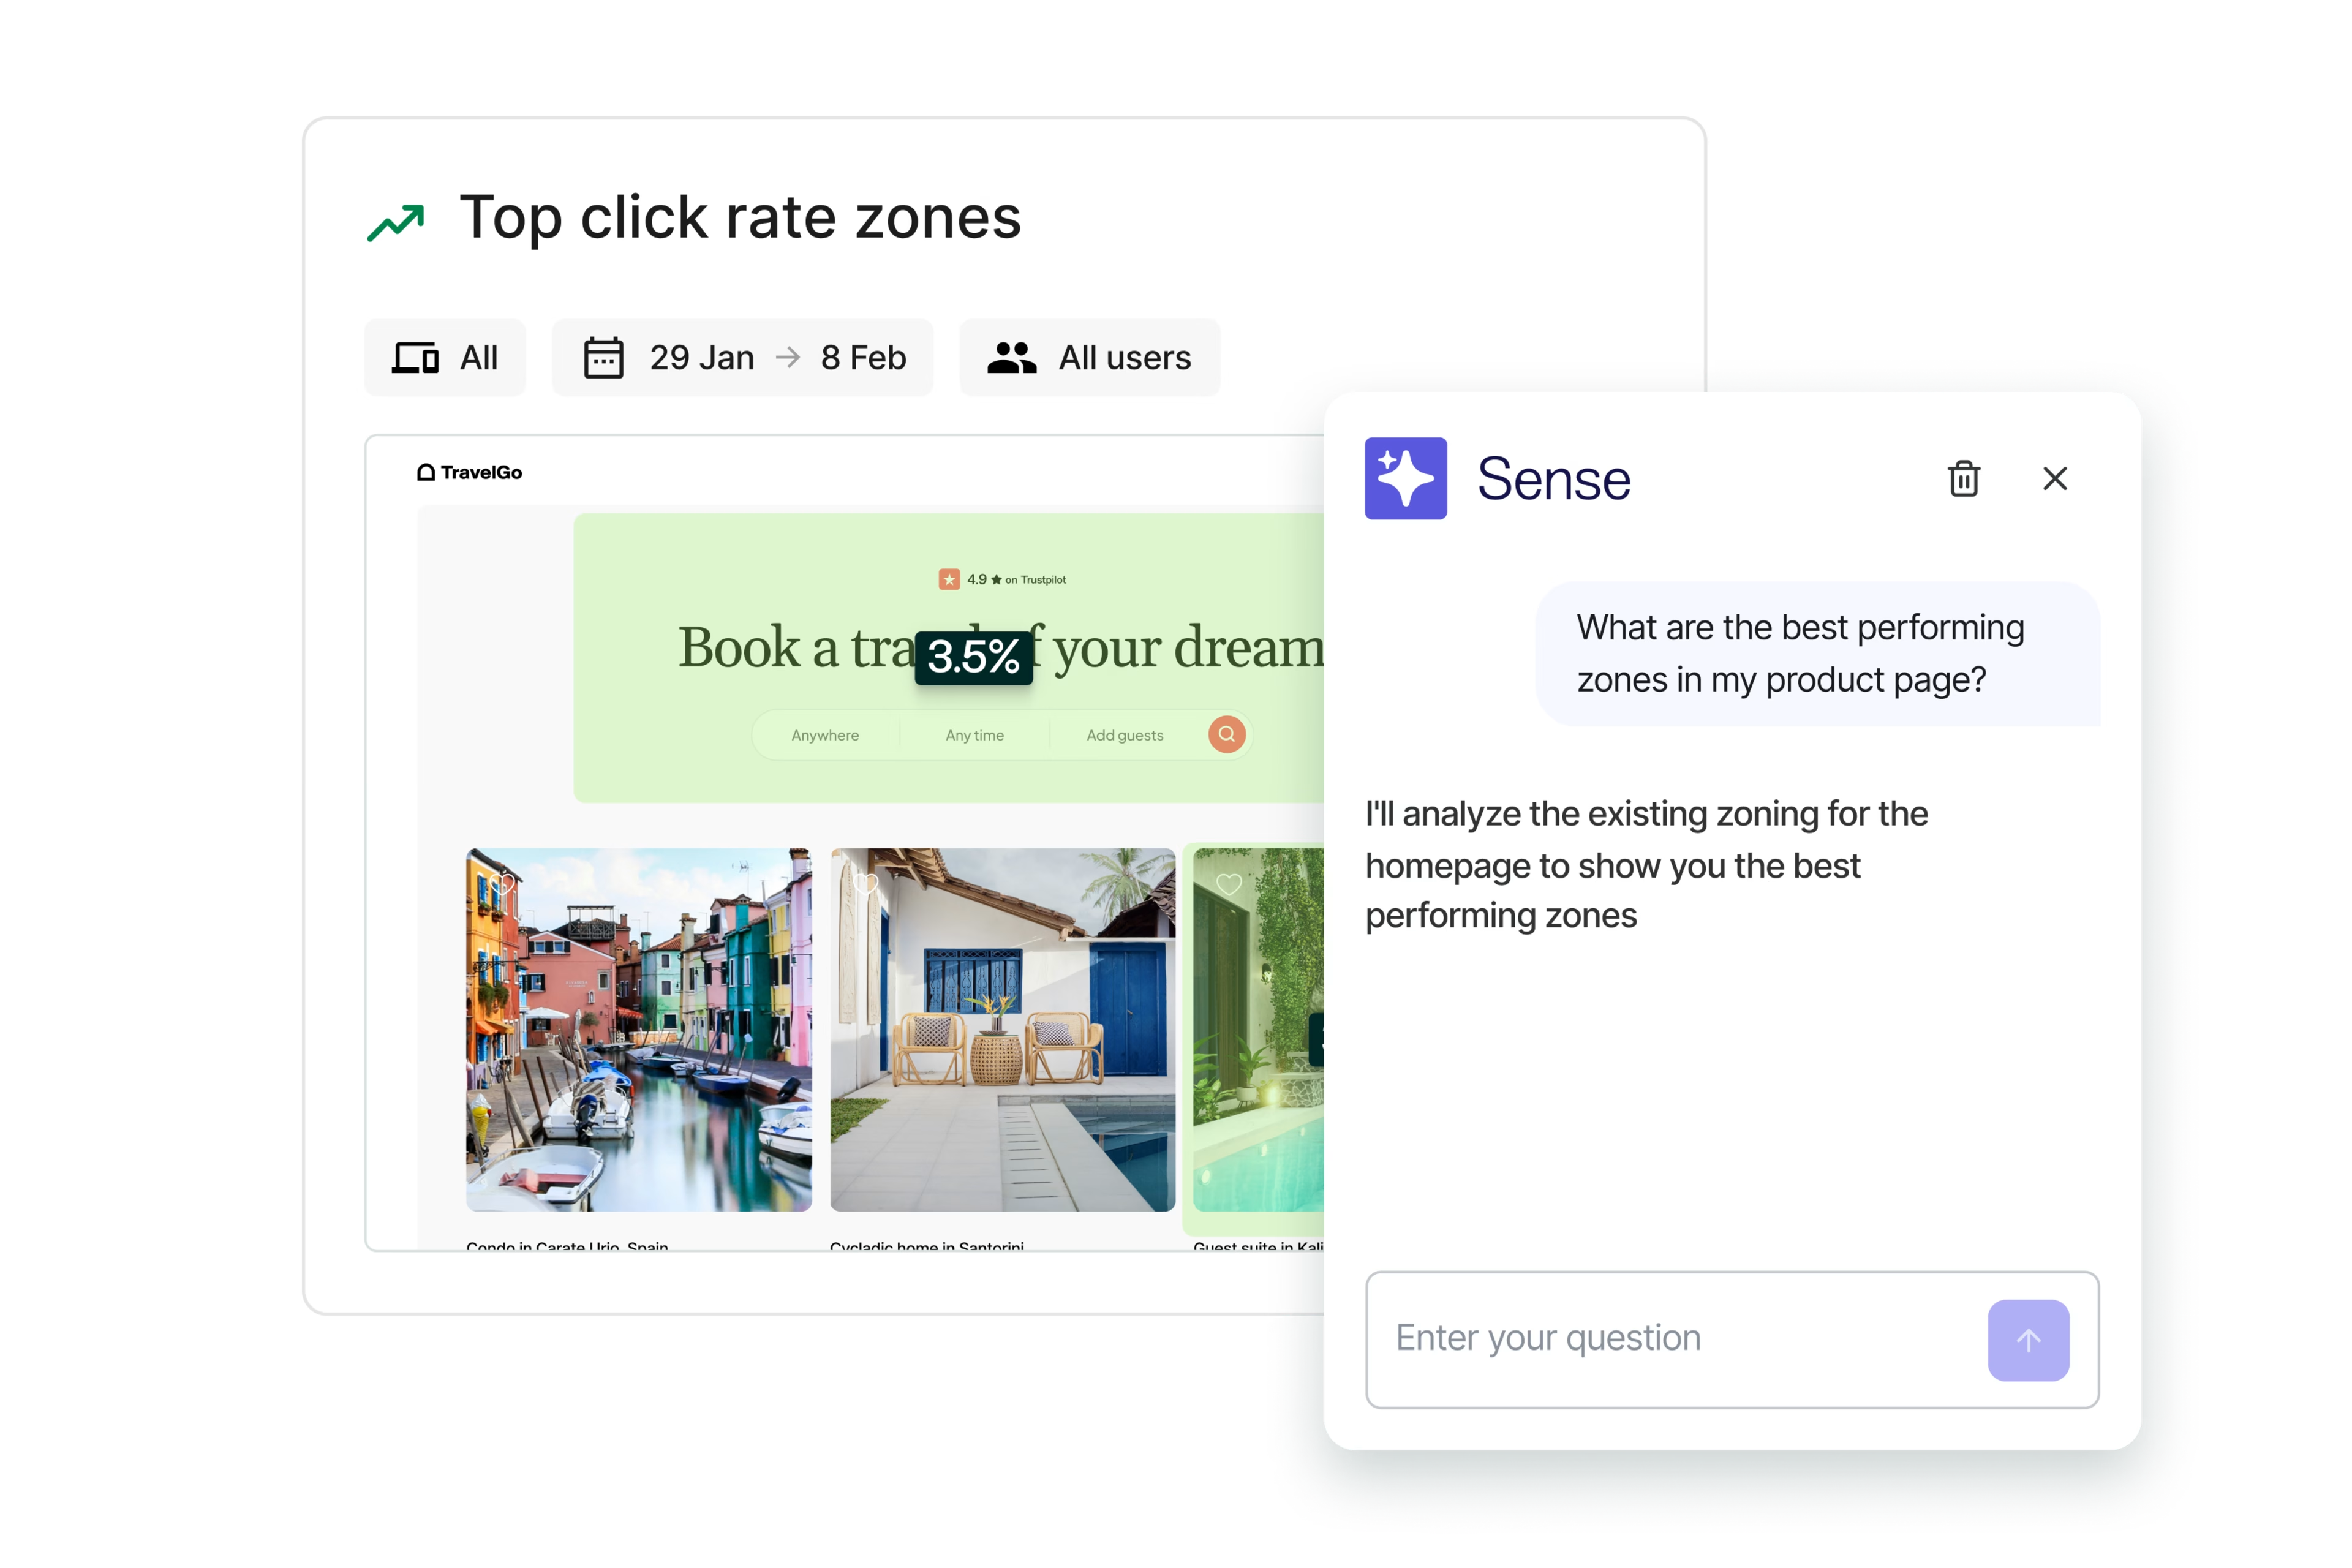
💡 Pro tip: use Contentsquare’s powerful AI agent, Sense Analyst, to perform in-depth, multi-step analyses and recommend next steps based on your data. Ask complex questions like:
How do returning users differ from new users, and how can we increase engagement for each segment?
Which friction points had the greatest impact on conversions and revenue over the last month, and what should we do to fix these issues?
How does the conversion rate for AI-referred traffic compare to other sources, and how can we enhance the conversion flow for this segment?
Sense outlines the steps it will take, walking you step by step through the analysis, and delivers clear results with concrete, data-driven actions to take, saving you hours of manual research.
Meaningful engagement starts with understanding intent
The data is clear. In 2026, visibility isn’t enough: you need to deeply understand and proactively address user intent. Only then can you successfully guide all users—from first-time visitors to returning customers—down the right path for them, capturing their engagement and earning their loyalty for the long-term.
FAQs about digital engagement benchmarks
Engagement rates have dropped year-on-year, with overall engagement falling by –10%. Visitors are spending less time on site, viewing fewer pages per session, and scrolling less.
But bounce rates have also declined year-on-year. This suggests that rather than growing disengagement, we’re actually seeing a shift in user behavior. Visitors are landing on site more informed and prepared, thanks in part to AI-influenced traffic—so while they’re consuming less, they’re showing higher intent.
This means that websites must cater to a range of visitor types on key landing pages, which now include product detail pages (PDPs), to capture and nurture users’ attention.
![[Visual] Contentsquare's Content Team](http://images.ctfassets.net/gwbpo1m641r7/3IVEUbRzFIoC9mf5EJ2qHY/f25ccd2131dfd63f5c63b5b92cc4ba20/Copy_of_Copy_of_BLOG-icp-8117438.jpeg?w=1920&q=100&fit=fill&fm=avif)