![[Visual] AI analytics home - stock](http://images.ctfassets.net/gwbpo1m641r7/64i3HakmQ9aHWYWEEqpFUM/f1d5d2a41b5c7d7a523a34b58bd50ece/AdobeStock_634961399.png?w=3840&q=100&fit=fill&fm=avif)
Imagine you have a 100,000-piece jigsaw puzzle spread out before you, the pieces tumbling together in a variety of colors. Your task is to put them together in a way that makes sense—without using the picture on the box for help.
That’s exactly what working with raw data feels like. Every day, your organization collects thousands (or even millions!) of scattered data points—user clicks, purchase behaviors, engagement metrics, and feedback forms. But without data processing, they’re just confusing, disconnected fragments that don’t reveal the bigger picture.
In this guide, we explore what data processing is, explain the different types, and outline the essential steps to help you make sense of your raw data. You’ll also see real-world applications that drive tangible business results.
Key insights
Build a solid foundation: use platforms (like Contentsquare 👋) that prioritize data processing privacy and security from day one to avoid unnecessary risk
Focus on data quality over quantity: clean, well-structured data from fewer sources gives you more reliable insights than messy data from all over the place
Choose tools that democratize analytics: ensure non-technical team members can get answers to their questions without needing help from data scientists—AI-powered analysis tools like Contentsquare’s Chat with Sense are perfect for this
Design visualizations for action, not just information: create dashboards and reports that highlight what needs attention and what steps to take next, instead of just providing snapshots of every available metric
What is data processing?
Data processing is the collection, transformation, and analysis of data to extract meaningful insights. It’s how you turn scattered data points into clear patterns and trends that guide your business decisions and strategy.
For example, raw data might show you that 500 users visited your checkout page yesterday. But through data processing tasks, you learn that 40% of them abandoned their carts at the payment step, and 10% clicked frantically on a broken button. Now you have insights you can actually act on. 👏 Whether you’re looking at customer surveys or financial records, getting data processing right matters. It helps you
Make better decisions (and fewer costly mistakes) with clean, well-processed data
Save time and resources with automated processing that eliminates manual data wrangling, freeing up your team to focus on taking action
Catch errors and inconsistencies before they skew your insights and affect your choices
Maintain compliance with well-managed processing that meets regulatory requirements and maintains audit trails
4 types of data processing
In the past, you always knew what type of data processing you conducted—because it was all manual data processing, all the time. You had to go out and find the data points and determine how to turn them into something usable.
Now, so much of data processing happens automatically and seamlessly in the background that you might not give it quite as much thought. Most likely, though, it’s one of these 4 types:
1. Batch processing
Batch processing handles large volumes of data in scheduled chunks. The system collects data over time, and then processes it all at once during pre-set intervals—like overnight or weekly. This approach works well for resource-intensive tasks or historical analysis.
Example: an ecommerce company might use batch processing to analyze all of last month’s purchase data to identify seasonal trends and plan inventory.
2. Distributed processing
Distributed processing spreads large datasets across multiple computers or servers. This allows you to process massive amounts of information that would overwhelm a single system, dramatically increasing speed and scalability.
Example: a major streaming service like Netflix might use distributed processing to analyze viewing patterns across millions of users simultaneously so that personalized movie recommendations load quickly for everyone.
If you can achieve a full picture of your customer in one place with all business properties and unified interaction history, then you're able to actually understand your customer and also implement it in the tools that you have available to you.
3. Real-time processing
Real-time processing analyzes data instantly, allowing for quick decision-making. It’s perfect when you need to respond to events as they happen rather than waiting for scheduled analysis.
Example: a fraud detection system might use real-time data processing to instantly flag suspicious transactions, allowing it to automatically block fraudulent purchases before they go through.
4. Multiprocessing
Multiprocessing uses multiple processors or CPUs within a single system to handle intensive computing tasks. This method makes quick work of complex calculations, simulations, or rendering activities by breaking them down and tackling them at the same time—also called parallel processing.
Example: a video game studio might use multiprocessing to render realistic 3D animations, with one processor handling character movements and others handling textures or setting details.
💡Pro tip: regardless of the processing method you choose, ensure you use software that keeps privacy and security top of mind.
Look for platforms that offer:
Industry certifications, like ISO 27001, ISO 27017, ISO 27018, and ISO 27701, with SOC 2 Type II compliance
Published security frameworks, like those set by the National Institute of Standards and Technology (NIST) or the Trans-Atlantic Data Privacy Framework
Transparent privacy policies and data handling practices, published online
Dedicated privacy and security leadership, like a chief information security officer (CISO)
At Contentsquare, we work hard to check every box to ease your mind and protect your reputation. Learn more by checking out our Trust Portal.
How to conduct effective data processing in 5 steps
Knowing about data processing methods is one thing—actually using them successfully is another. Whether you’re analyzing user behavior or optimizing operations, follow these 5 stages of data processing to get reliable insights every time.
1. Collect data
Gathering raw data is your foundation, and getting it wrong here affects everything downstream.
Avoid selection bias—the trap of only collecting data that supports what you already believe or expect to find—by pulling usable information from multiple sources. This also ensures that you walk away with the most complete, accurate understanding of your data.
Your data sources might include
Experience analytics platforms to understand how users behave on your site
Experience monitoring tools to spot technical issues like slow load times or errors
Product analytics platforms to analyze and optimize experiences across web and mobile devices
Customer feedback, from sources like Contentsquare’s Surveys and Interviews tools, to get input directly from users
Transactional systems—think sales data, payment records, and inventory levels
Social media and marketing platforms, from Meta Business Suite to Sprout Social, to get meaningful information like engagement metrics and campaign performance
Market research for customer demographic information and industry benchmarks
The list above is long—and it represents only a small snapshot of some of the data sources you might use. Our tip? Curb software sprawl by choosing comprehensive platforms that collect multiple types of data.
Contentsquare, for example, combines experience analytics, experience monitoring, product analytics, and voice-of-customer feedback into a single user-friendly platform. Fewer platforms means your employees spend less time toggling between platforms and less time navigating the learning curve.
![[Visual] Meet up event feedback survey](http://images.ctfassets.net/gwbpo1m641r7/6JaKIovRKhnH2TcMdHER3Q/9cf8574d490138596540de8eb9da59d8/Group_1948760392__1_.png?w=3840&q=100&fit=fill&fm=avif)
With Contentsquare’s unified platform, you can view the voice-of-customer data you collected—and quickly jump to see product analytics or other data with a single click on the left-hand menu
2. Clean data
Data cleaning might be the most important step in your entire process. No matter how sophisticated your analysis, the old expression ‘garbage in, garbage out’ still holds true. That’s because real data is messy, inconsistent, and full of errors that might skew your results if left unchecked.
Data preparation and cleaning involves
Identifying missing data and determining whether to fill in the gaps or exclude them from your data set
Standardizing formats across different sources (like converting all dates to the same format)
Removing duplicates that could inflate your metrics or create false patterns
Correcting obvious errors such as typos
Handling outliers by figuring out whether these values represent real insights or simple mistakes
Conducting data validation by checking that totals add up and relationships between fields make sense logically
3. Transform data
This is where you (or, in most cases, your software tools) actually process your clean data, organizing and converting it into formats that make sense for your goals.
Key actions involved in transforming data include
Aggregating information to group it (like calculating average session duration)
Normalizing data to ensure that you compare different datasets fairly, like adjusting for different time zones
Integrating and enriching data to combine your internal data with external data from third-party sources
Through Contentsquare, we transformed our digital space, bringing hidden gems to light, removing our internal bias on content and ultimately driving revenue for Early Settler. It's more than just a platform; it's our roadmap to understanding customer behavior, optimizing content, and making every click count.
4. Analyze data
Data analytics is where things start getting good. This is where your transformed data starts revealing its secrets. By looking for patterns and trends, you start to get answers to your original business questions. The goal at this stage is to move from ‘what happened’ (say, an increase in rage clicks) to ‘why it happened’ and ‘what should we do about it.’ Some common data analysis methods include
Comparative analysis to compare benchmarks across segments or time periods
Correlation analysis to discover relationships between variables (like how page load speed affects conversion rates)
Cohort analysis to track how different user groups behave over time
Sentiment analysis to make sense of users’ emotions about your brand or product
While these types of analyses sound challenging, they don’t have to be—and you don’t need a background in advanced statistics either. Contentsquare’s Chat with Sense, for example, lets you simply ask questions like, ‘What’s causing checkout abandonment this week?’ or ‘Which paths do paid users take after landing?’ The AI technology instantly analyzes your data for you, offering actionable answers with supporting visualizations.
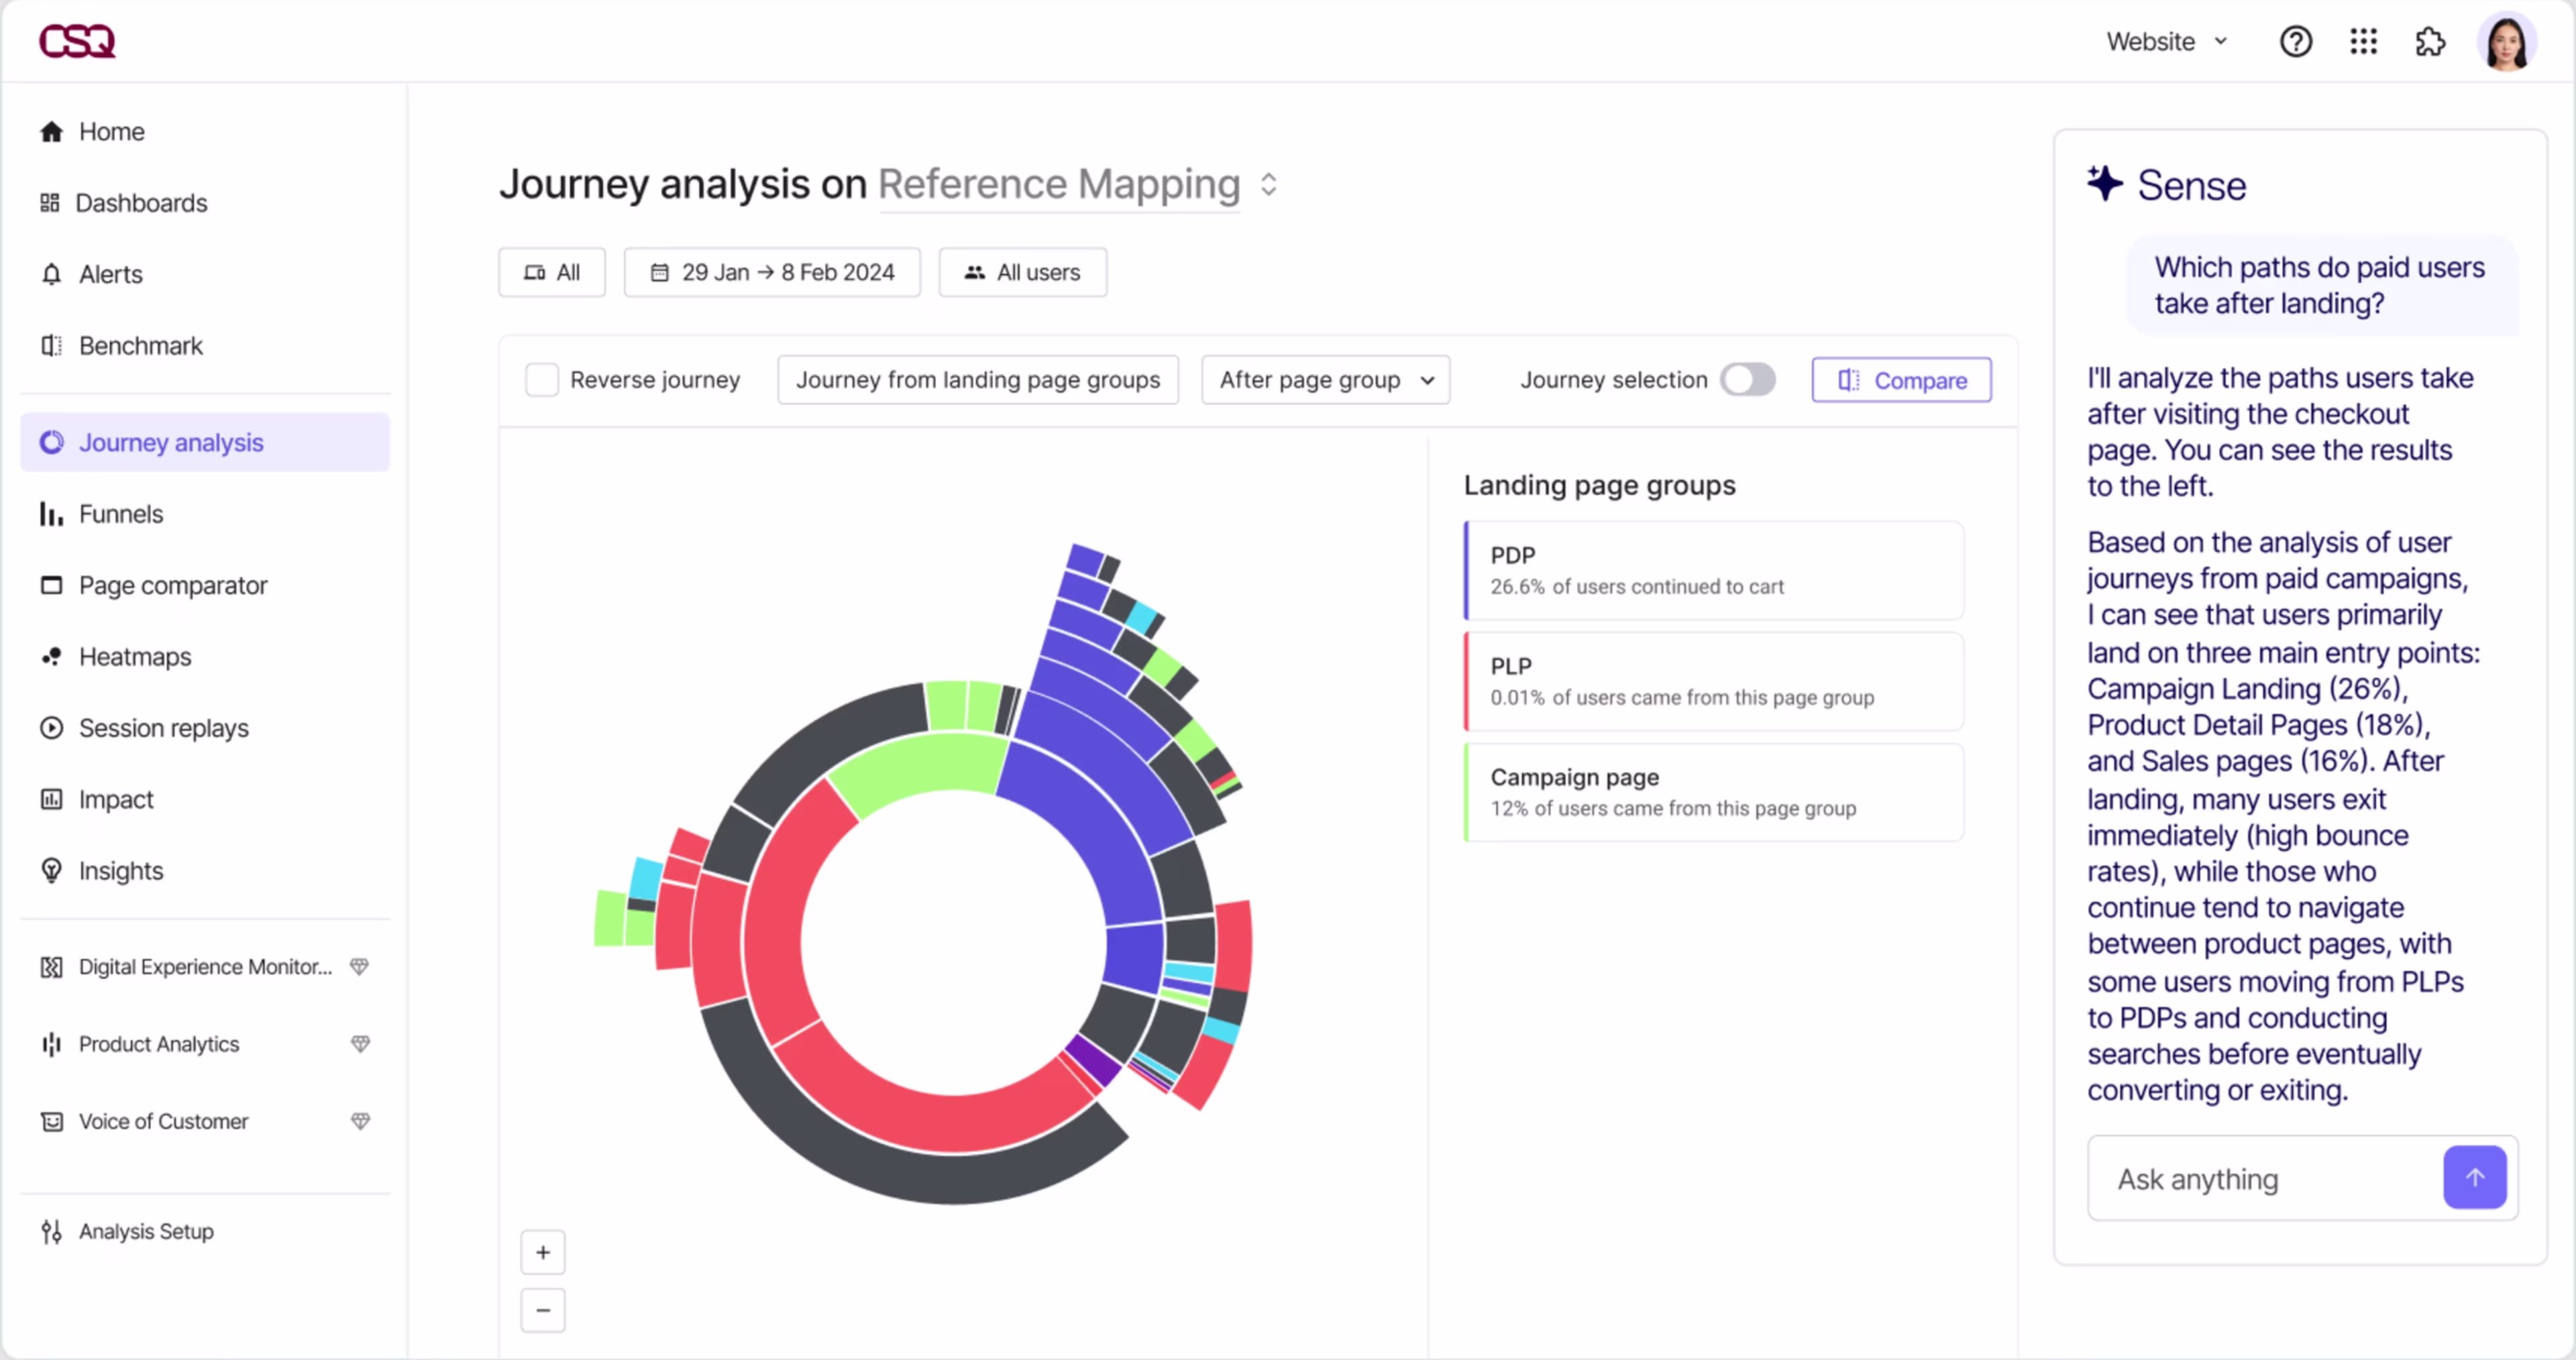
Use Sense with Journey Analysis for help analyzing your data in seconds
5. Visualize data
By creating high-quality dashboards and reports, you transform your insights into a resource your team can use and act upon. Meaningful data visualizations make complex data easier to understand, highlighting the most important findings.
Choose the right visualization type for your data:
Line graphs for showing trends and changes over time
Bar charts for comparing quantities across categories
Pie charts for showing percentages and proportions
Funnels for tracking conversion processes and identifying drop-off points
Heatmaps for visualizing user engagement and interaction patterns
Journey maps for understanding user paths through your product or site
Remember to keep digital accessibility in mind when creating your visualizations — tweaking things like colors, font size, and white space to keep them accessible to all.
🤔 Did you know? Contentsquare’s dashboard templates offer one-click setup for common use cases, like a retention overview or an audience overview. Plus, our integrations with over 100 tools—including Stripe and Salesforce—let you visualize customer data from across the entire journey in one unified view.
Choose from a variety of dashboard templates to organize your visualizations with Contentsquare
2 powerful data processing use cases
These 2 use cases show how data processing transforms raw data into strategic advantages that impact your bottom line—from faster product decisions to lower churn rates.
1. Improve features through behavior tracking
Say a SaaS company launches a new product dashboard, but initial adoption numbers are a little disappointing. By processing user data and reviewing session replays, the data and product teams notice that many users abandon the feature after just two clicks. The processed insights reveal confusing navigation labels and a missing onboarding tooltip.
The product team then prioritizes targeted user interface (UI) tweaks or adds a brief walkthrough for new users. And as a result, the feature adoption rate rises, and the company reduces time-to-insight for product decisions from weeks to days.
2. Predict churn and boost retention based on data
Imagine the data team of a subscription-based healthcare app creates a churn prediction model using cleaned and processed behavioral data, engagement metrics, and usage patterns. The model flags users likely to churn within 7 days with 82% accuracy.
Using these insights, the product management team develops an automated retention campaign that surfaces help documentation through in-app messages or triggers follow-ups from customer success. The result? Overall churn decreases by 19%, customer lifetime value (CLTV) increases, and the support team can focus its efforts on users who need help the most.
💡 Pro tip: create even more accurate churn prediction models by pulling together data from different platforms.
Contentsquare’s Data Connect automatically exports your clean, structured behavior, performance, and error data straight to data warehouses like Snowflake, BigQuery, or Databricks.
There, it can mix and mingle with data from other platforms, like customer relationship management (CRM) records or support tickets. And connected data means better churn prediction in your AI and machine learning algorithms—all while keeping your data easily accessible across teams.
Level up your data processing
Data processing is more than just a technical necessity—it’s a way to uncover the story your customers tell you through their behavior, preferences, and pain points. Whether you want to reduce customer churn or personalize your website experiences, data processing helps you turn scattered insights into focused action.
Ready to dive deeper? The next chapters in this guide show you how to take your data processing to the next level:
Automatic and AI-assisted data processing: learn how artificial intelligence helps you surface patterns and generate recommendations faster
Data processing software and tools: explore the platforms and integrations that make sophisticated data processing accessible to any team
FAQs about data processing
Data processing is the way you collect, clean, transform, analyze, and visualize raw data to capture valuable insights. You go from scattered information to a clear picture of what’s happening in your business and why. Typically, companies use business intelligence and data processing systems for this purpose.
