
Every retailer knows the frustration of customers abandoning carts, browsing but not buying, or leaving your site after just a few seconds. You have heaps of customer data, but translating those numbers into actionable insights that actually improve sales feels impossible.
The solution lies in retail data analytics—the practice of collecting, analyzing, and acting on customer behavior data to create seamless shopping experiences that convert browsers into buyers.
This guide shows you exactly how to leverage analytics tools and strategies to transform your customer experience, boost conversions, and stay ahead of your competition.
Key insights
The most visible elements on your site aren’t always the most effective. Use heatmaps to identify which content actually drives conversions and prioritize accordingly.
Campaign optimization requires ongoing monitoring across multiple touchpoints. Set up automated alerts for key metrics, and then act quickly when performance drops.
To increase revenue, customize interactive tools and personalized journeys based on how different customer segments navigate your site
1. Test individual elements on product detail pages
Product detail pages (PDPs) are where browsers become buyers—or abandon their carts entirely. These individual product pages are make-or-break moments for conversions, so testing each element is critical.
Instead of guessing what might work, use a tool like Contentsquare Heatmaps (it’s free forever) to see exactly how customers interact with your PDPs.
Here’s how:
Spot ‘dead zones’ where important elements like product benefits or specifications get ignored, and then reposition or redesign these areas
Check your scroll depth on your retail heatmap to see what percentage of customers scroll down to view reviews or related products—and then move key information higher if needed
Use side-by-side heatmap analysis to compare PDP performance across mobile vs. desktop, different traffic sources, demographics, or A/B test variants to understand what drives better results
![[Visual] ab test heatmaps](http://images.ctfassets.net/gwbpo1m641r7/71Feljv3nwR0ng3PEiPGEG/c5c4f991ef679e660e08970edb2a894a/ab_test_heatmaps.png?w=3840&q=100&fit=fill&fm=avif)
Compare user behavior between two different A/B test variants with Contentsquare Heatmaps
💡 Pro tip: find points of frustration where customers repeatedly click on non-clickable elements—like product images that should zoom but don’t—and then follow up by watching session replays to see what happened. |
Our PDP tests were developed from Contentsquare’s unrivalled customer insight, driving significant, incremental revenue, and have paved the way for our upcoming site redesign. The results have since inspired and enabled app optimizations, and more importantly, this is just the start. We’ll continue to iterate, helping customers in their mission to find their new look.
2. Customize interactive digital experiences
According to McKinsey, brands that get personalized experiences right generate 40% more revenue. Interactive tools like quizzes, virtual consultation, and package recommendation engines help you deliver that personalization at scale.
The key is to use customer behavior data to create engaging experiences that feel genuinely helpful.
Here’s how:
Discover how different segments explore your website or app using our Journey Analysis tool—our AI-powered Chat with Sense can analyze the data for you in seconds. Then, customize experiences for each group (for example, first-time visitors vs. returning customers).
Test interactive elements to refine quiz questions and tool layouts based on real data. (Contentsquare integrates with traditional A/B testing tools to let you analyze heatmaps or session replays from two variants side by side.)
Collect customer input about your interactive experiences via Contentsquare Surveys or feedback widgets and tailor them accordingly
Track funnel performance with Funnel Analysis to see where customers drop off in multi-step experiences like product quizzes, and then optimize those friction points
![[visual] Contentsquare Funnel setup](http://images.ctfassets.net/gwbpo1m641r7/5EX1R2zY8dxcIJvHEYEe8m/b31846b2b709fad619d81fe04bcadbd4/funnels.png?w=3840&q=100&fit=fill&fm=avif)
See where users drop off and why with Funnel Analysis
🔥 How INKEY boosted conversions with personalized skincare tools
UK skincare brand INKEY created 3 interactive tools on their website—Skincare Quiz, a Build Your Own Bundle, and Breakout Analyzer Pro. These tools provided target solutions for different customer needs, from product discovery to personalized treatment plans.
Using Contentsquare’s analytics capabilities—including Funnel Analysis, Journey Analysis, Heatmaps, and Dashboards—INKEY gained a deeper understanding of user behavior and optimized each tool. The result? Higher conversion rates, stronger customer retention, and award-winning digital experiences.
With Contentsquare, we proved that people who engage with our skincare tools have 155% higher conversion rates, drive 45% higher AOV, and spend 256% more time on the site.
3. Measure the impact of errors and site speed on conversions
Even small performance issues can devastate your bottom line. According to Contentsquare’s 2025 Digital Experience Benchmarks report, sites with poor page load speeds see bounce rates of 53%—4 percentage points higher than fast-loading sites. This translates to 1.5% fewer page views and countless lost sales.
With Contentsquare’s Experience Monitoring tools and Impact Quantification, you can find and fix the performance issues that affect conversions on your retail site.
Here’s how:
Use the Speed Analysis capability to monitor Core Web Vitals—like Largest Contentful Paint (LCP), Cumulative Layout Shift (CLS), and Interaction to Next Paint (INP)—with real user monitoring (RUM) to see how these metrics affect actual shoppers’ behaviors
Set up synthetic monitoring to automatically test key pages—like PDPs or your shopping cart—to catch performance issues before they affect real customers
Calculate how much slow load times or errors cost you in lost revenue and missed conversions using Impact Quantification
For example, Specsavers, an international optical and audiology retailer with 2,400 stores and 12 websites, used this approach during a major back-end platform update. Using Contentsquare’s Speed Analysis tool before and after the update, they could measure the direct impact of improved site speed on business metrics like retail conversion rates.
4. Improve product discovery with merchandising analytics
Smart digital merchandising makes it easier for customers to find products they want, discover items they didn’t even know they needed, and ultimately spend more per visit.
When your merchandising strategy is backed by data about customer preferences and behavior, you place the right products in front of the right customers at exactly the right moment.
Here’s how to use Contentsquare’s Merchandising capability to do just that:
View performance and sales data visualizations to learn which products customers viewed, added to cart, and actually bought after clicking campaign banners—then double down on what’s working
Optimize product placement based on behavior analytics and website analysis by seeing how different products perform in specific zones of your pages. Use the Merchandising view in our Zoning tool to learn which products convert best in hero banners, recommendation carousels, and category grids.
Analyze your catalog performance. See which categories, brands, and individual products drive the most revenue, helping you make better decisions about price, inventory management, product placement, and cross-selling.
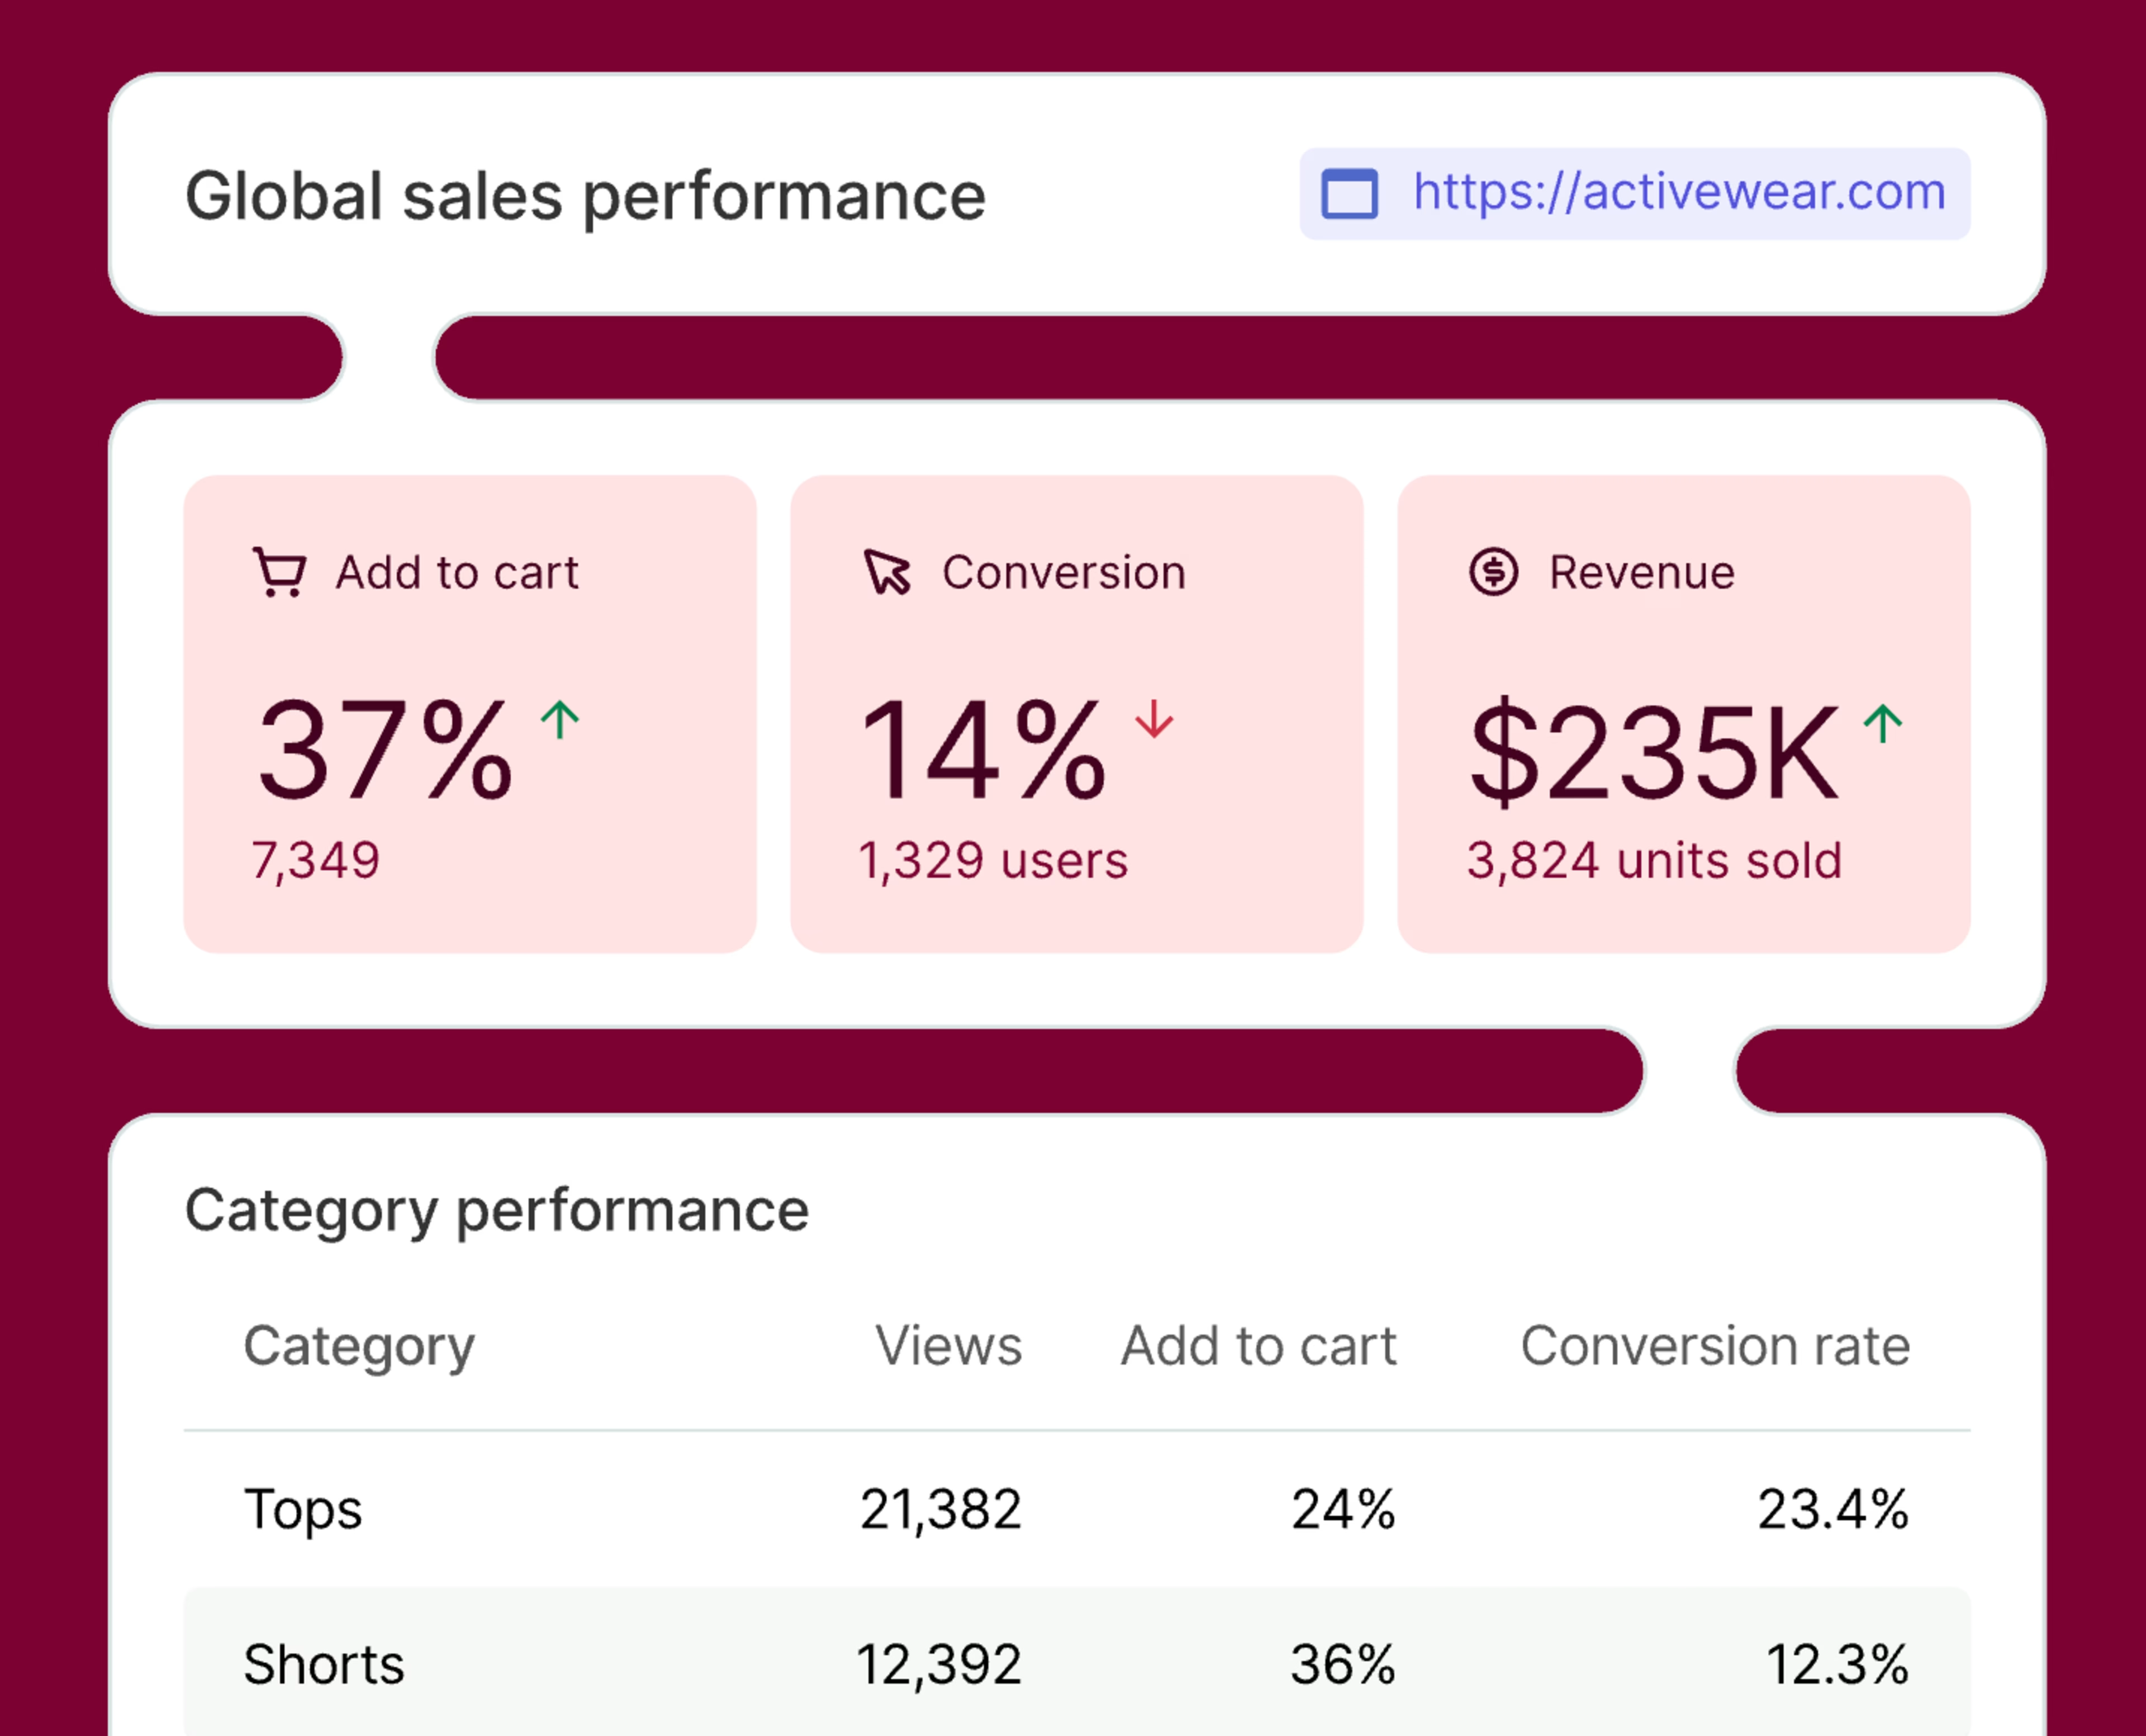
Get a 360-degree view of catalog performance with Contentsquare’s Merchandising tool
5. Optimize campaign landing pages and ads
The difference between a high-converting landing page and one that people leave in droves often comes down to small details, like which elements grab attention and where people get stuck.
Without data on these elements, you have to guess what’s happening. But with the right analytics, you can turn your omnichannel campaigns into revenue drivers.
Here’s how to do it with Contentsquare:
Compare performance across traffic sources using Acquisition Analysis to discover which marketing campaigns and channels deliver the highest customer engagement and conversions. Double down on channels that work—and investigate why others underperform.
Set up automated monitoring with Contentsquare’s AI alerts for key metrics like bounce rate, conversion rate, and call-to-action (CTA) click-through rates by traffic source. Get notified immediately when campaign performance drops, so you can take action fast.
Find images, buttons, and content that attract attention and drive revenue with Heatmaps and Impact Quantification. Then, move these to a more prominent part of the page, such as above the fold.
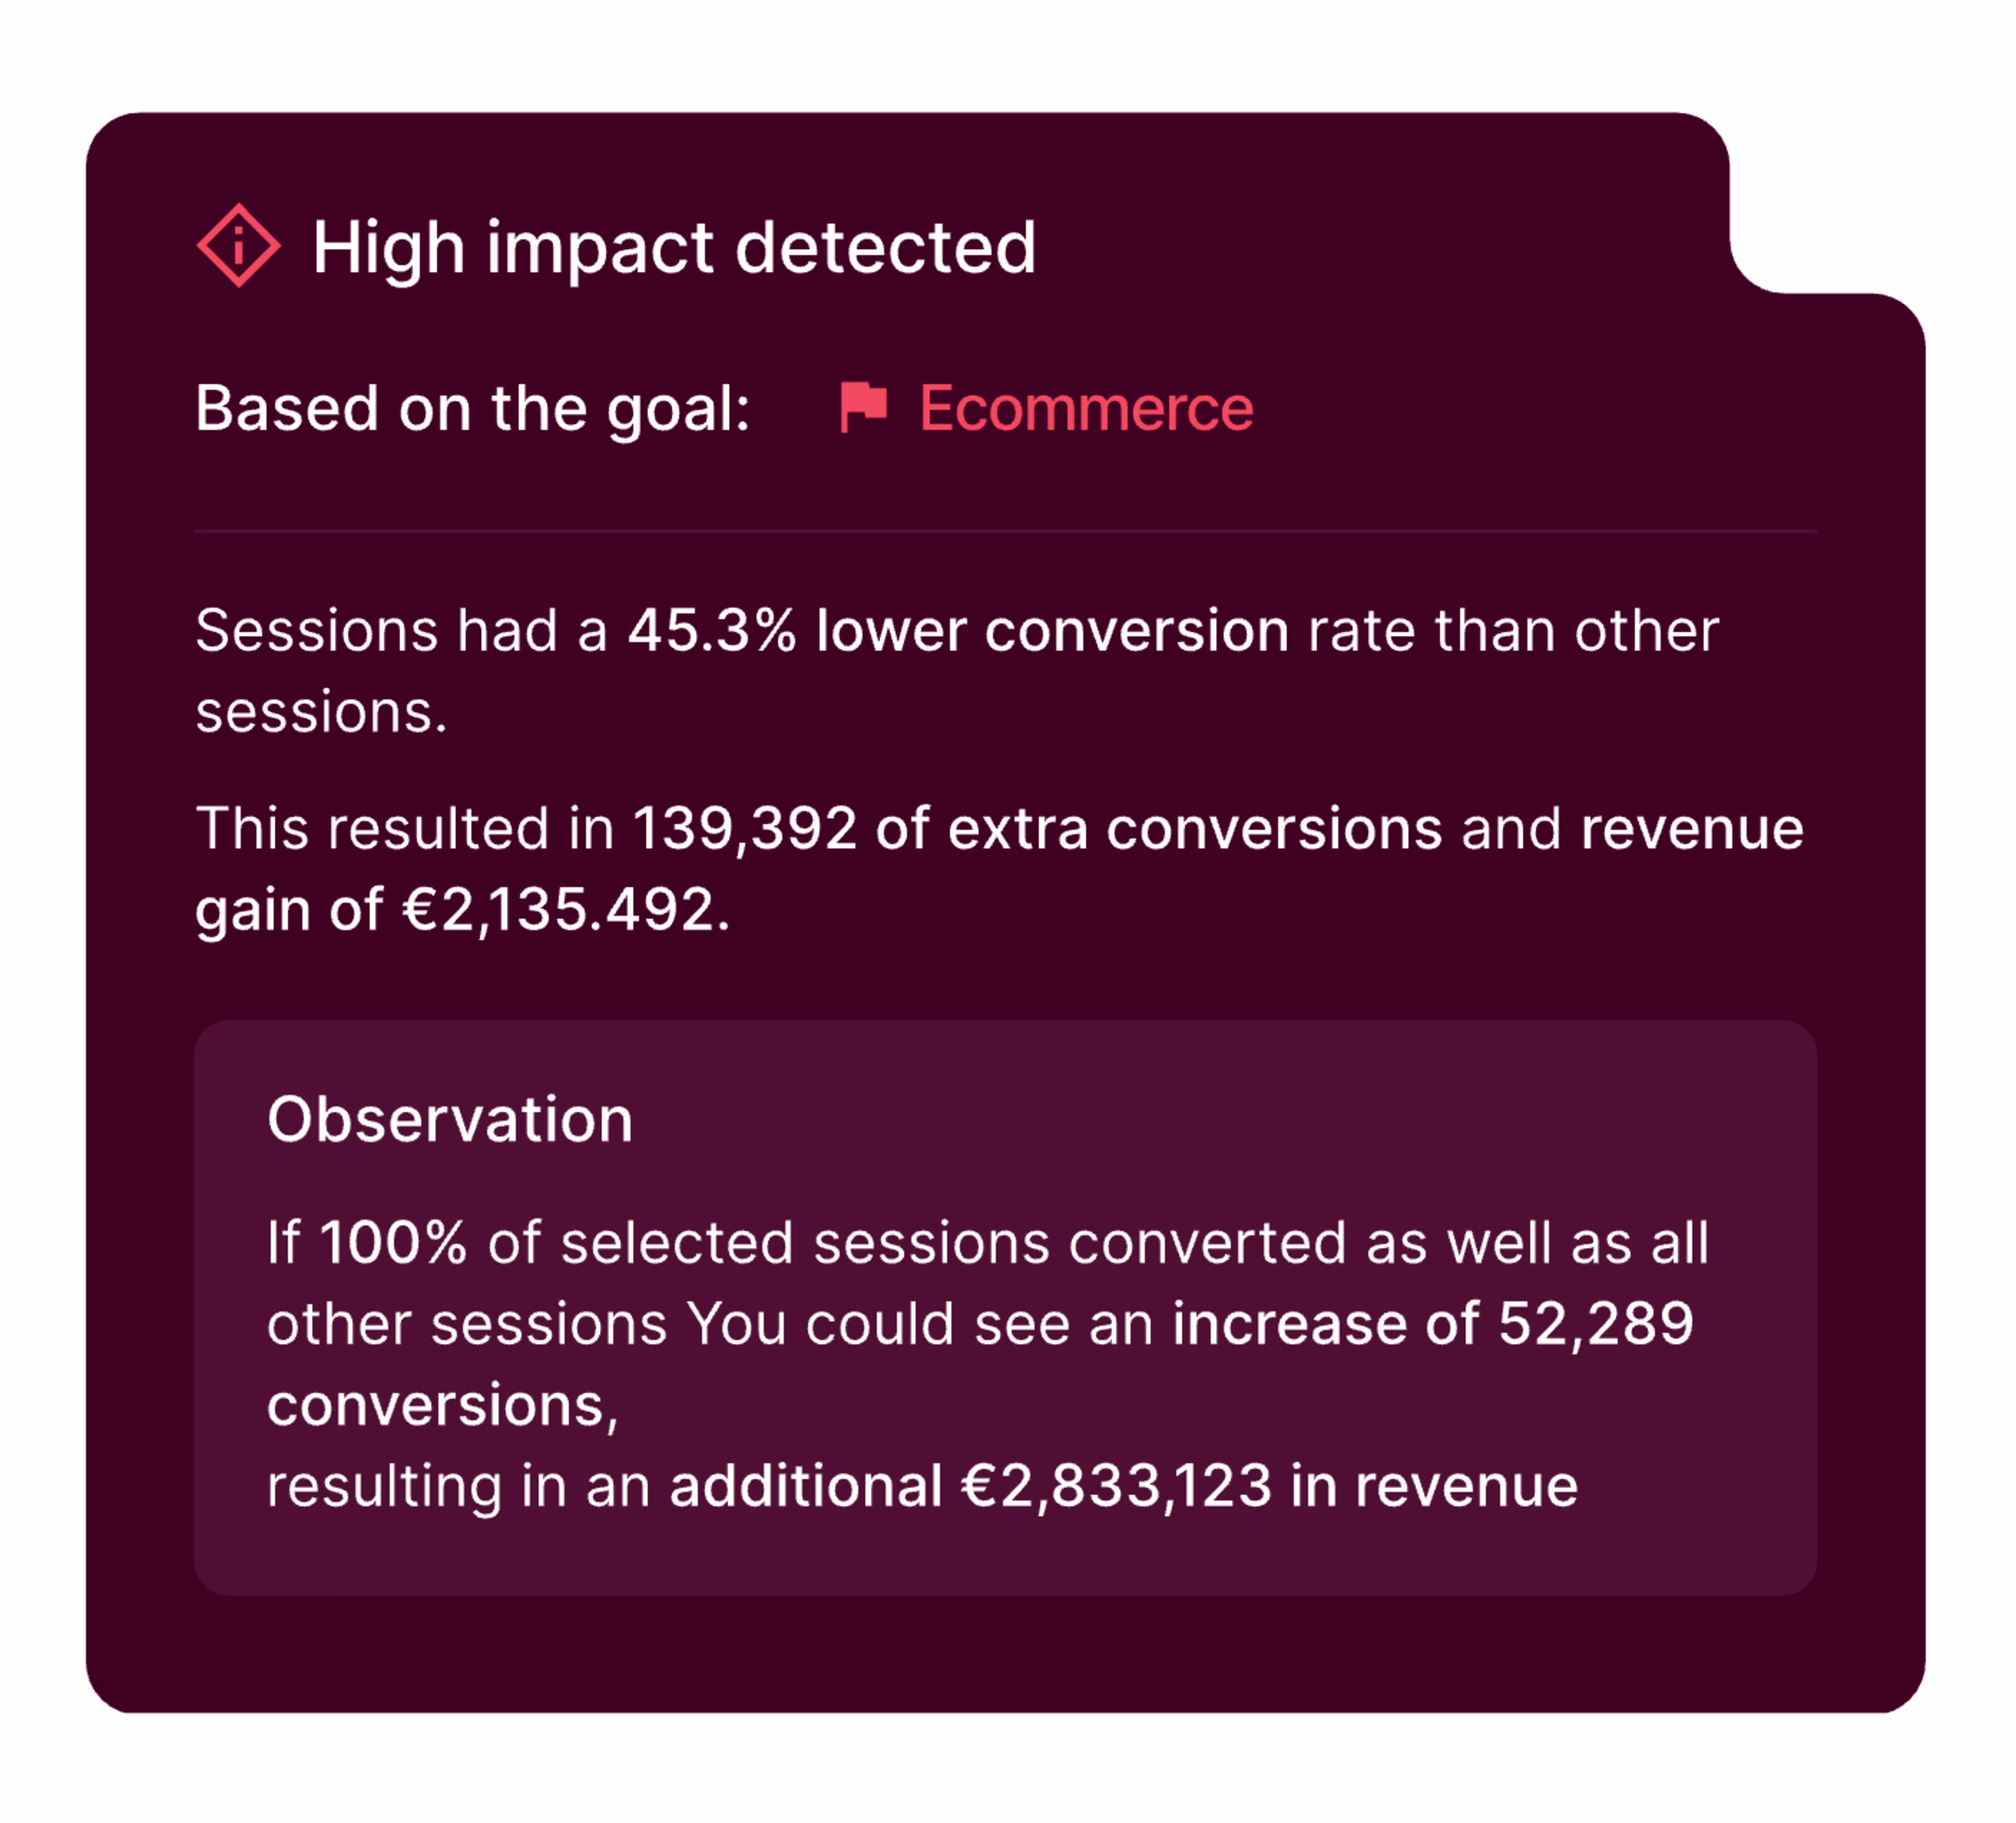
Use Impact Quantification to understand which issues to fix first on your retail site
For example, Australian furniture retailer Early Settler used Contentsquare’s Heatmaps and Impact Quantification for their Black Friday campaign. They discovered that their ‘Shop Catalogue’ section had the lowest conversion rate despite high visibility. Meanwhile, less visible elements like their ‘Black Friday Favourites’ carousel drove much more revenue per interaction. After reorganizing their homepage to prioritize the carousel, they boosted engagement and revenue in days.
Your roadmap to retail analytics success
Your customer data holds the answers to more conversions, increased revenue, and better experiences. Lean into the data analytics process to get insights that give you a complete understanding of the retail customer journey.
Start with the area that’s costing you the most revenue right now—whether that’s cart abandonment on product pages, poor campaign performance, or technical issues driving customers away. Then, use the insights you gain to expand every touchpoint, creating an effortless and effective retail experience.
FAQs about retail data analytics
Retail analytics is the process of using data to understand and improve a retail business’s performance. It helps you make data-driven decisions—like what products to stock, what marketing strategies to try, and how to streamline and optimize the digital experience. This results in benefits like more sales, better operational efficiency, and higher customer satisfaction. It also helps you forecast future trends and adapt to changes in the retail landscape.
![[Visual] Contentsquare's Content Team](http://images.ctfassets.net/gwbpo1m641r7/3IVEUbRzFIoC9mf5EJ2qHY/f25ccd2131dfd63f5c63b5b92cc4ba20/Copy_of_Copy_of_BLOG-icp-8117438.jpeg?w=1920&q=100&fit=fill&fm=avif)
![[visual][Ecommerce analytics] Tools](http://images.ctfassets.net/gwbpo1m641r7/1QIREJa6WCXWftNzRbYGYb/da9e0c9501f2a7abdae07b76209f4d8c/pexels-diva-plavalaguna-6147360.jpg?w=1920&q=100&fit=fill&fm=avif)
![[Visual] Website monitoring Checklist Header](http://images.ctfassets.net/gwbpo1m641r7/28V4u2ZjcAoBy3805D8mkV/a87f42078ded3e74b73bc55e979a0783/AdobeStock_963706233.jpeg?w=1920&q=100&fit=fill&fm=avif)