
Getting users from signup to real, tangible value fast is one of the hardest and most consequential challenges in product growth. If users don’t experience meaningful progress early on, they disengage, churn, or never return. Time to value (TTV) is what determines whether your product becomes essential—or forgotten.
However, without a clear understanding of what users actually do inside your product—where they hesitate, get stuck, drop off, and why—it’s challenging to determine which changes will actually help them make meaningful progress.
This guide explains exactly what time to value means, ways to measure it, and how to spot friction points that slow users down—so you can prioritize high-impact fixes and confidently validate product decisions.
Key insights
Define what success should look like at each stage of the customer journey and the events that prove users reached it, so every team works toward improving TTV
Use funnel, user behavior, and error data together to find where people stall to understand why and fix the issues that’ll have the highest impact on customer success
What is time to value?
Time to value is how long it takes for a user to experience a tangible benefit from your product—like completing their first end-to-end workflow, generating actionable insights, or solving a critical problem they couldn't address before.
TTV isn’t the same as an ‘aha’ moment—which is when users first realize your product can help them. TTV is when they actually get the outcome they came for, and that can happen multiple times as they move from onboarding to adoption and into advanced workflows.
When users reach value quickly at each of these stages, they're more likely to adopt your product, stick around long term, and recommend it to others. But when the path to value takes too long, users are more likely to churn. Pendo found that many software products lose about 70% of users within 3 months—which is why shortening TTV matters.
5 types of time-to-value metrics
Time to value isn’t a single moment—that’s why it helps to track multiple TTV metrics, each tied to a specific outcome you want to achieve.
Let’s go over 5 of the most common time-to-value metrics.
1. Immediate time to value
Immediate time to value is the first quick win (usually within minutes) that shows a new user your product helps them solve their problem. For example, in a CRM, users experience immediate TTV when they share their sales process preferences during onboarding, and the product instantly configures a dashboard with the right templates, so they get started right away.
2. Time to first value
Time to first value (TTFV)—also called the aha moment—is how long it takes a new user to achieve their first tangible outcome tied to why they signed up. It's usually reached on the first day, depending on your product's complexity.
In a CRM, that tangible outcome could be building a usable mini pipeline—the user logs 3 to 5 deals, sets next steps and due dates, and immediately gets a clear pipeline view that shows what to follow up on today and which opportunities are at risk.
3. Short-term time to value
Short-term time to value is how long it takes a user to get their first repeatable win—typically within the first few weeks of their aha moment—that proves your product works reliably for their workflow.
This could be a user running their first full week of sales execution inside their CRM platform—every active deal has a current stage, a next step, and an owner with a due date, and the team can generate a forecast without chasing updates.
4. Long-term time to value
Long-term time to value is how long it takes users to realize sustained, compounding benefits that prove your product’s ongoing worth, typically measured over several months.
In practice, this happens in a CRM when a sales team has managed multiple quarters of pipeline successfully, can quantify measurable improvements, like 20% faster deal velocity or higher win rates—and the platform has become integral to how they forecast revenue, coach reps, and run sales operations.
5. Time to exceed value
Time to exceed value is how long it takes users to adopt capabilities beyond their initial use case in ways that expand their usage, deepen integration, or turn them into advocates.
For instance, this happens when a sales team that initially used their CRM for pipeline tracking starts using automation for follow-up sequences, builds custom reports for leadership, integrates it with their marketing tools, and pushes for rollout to adjacent teams like customer success and product.
What factors influence time to value?
Several factors can slow down how quickly users reach value, and understanding these helps you identify where to focus your optimization efforts.
Here are 5 common factors that affect time to value:
Product complexity: the more steps, configurations, or integrations required before users accomplish their main goal for signing up, the longer TTV becomes
No shared KPIs: when departments define success differently and lack clarity on which user actions indicate value, it's difficult to measure progress or prioritize the right fixes
Poor onboarding quality: unclear or generic onboarding questions and steps prevent users from connecting product capabilities to their specific goals—increasing the chances of early drop-off before they experience real value
Data integration requirements: the more systems users need to connect before they can accomplish basic tasks, the higher the risk they'll abandon the product before reaching their first win
Data silos: when user behavior data is fragmented across tools—analytics in one place, support in another, product usage elsewhere—teams lose visibility into the complete journey and can't proactively prevent customer churn
6 ways to optimize time to value
To identify what's influencing time-to-value for your SaaS product and shorten it, here are 6 tips with real-world examples.
1. Define what ‘value’ means and align on shared KPIs
Having every team agree on what success looks like from the get-go prevents siloed decision-making and keeps everyone focused on moving users to value faster.
Without that shared definition, each team naturally optimizes for what matters most to their own function—product for activation milestones, sales for win rate, customer success for ticket volume and time to resolution, and marketing for qualified leads.
To fix this, run a cross-functional workshop to define the outcome users signed up for and the key events that prove they’ve reached it at each stage. Anchor your ‘value’ definition to what the customer wants to achieve—complete a core workflow, save time, see measurable impact, or feel confident they’re set up correctly. Then turn those value events into journey-based KPIs everyone can use to track progress.
Pro tip: use Contentsquare’s product analytics dashboard, powered by Heap, to track these time-to-value events and KPIs in a single place—so every team is aligned around the same source of truth. Build your KPI set across the full customer journey:
Immediate time-to-value signals like onboarding completion rate
Time to first value KPIs like time to insight and time to activation
Short-term TTV metrics like repeat engagement, daily active users, feature usage, and weekly cohort retention
Long-term TTV KPIs like monthly active users, retention rate, repeat-user session frequency, subscription churn, and customer lifetime value
Time to exceed value metrics like new feature activation rate, adding seats, upgrading a plan, or measurable feature adoption uplift
This gives you a clear view of how users progress from sign-up to sustained adoption, so you know where to prioritize your optimization efforts.
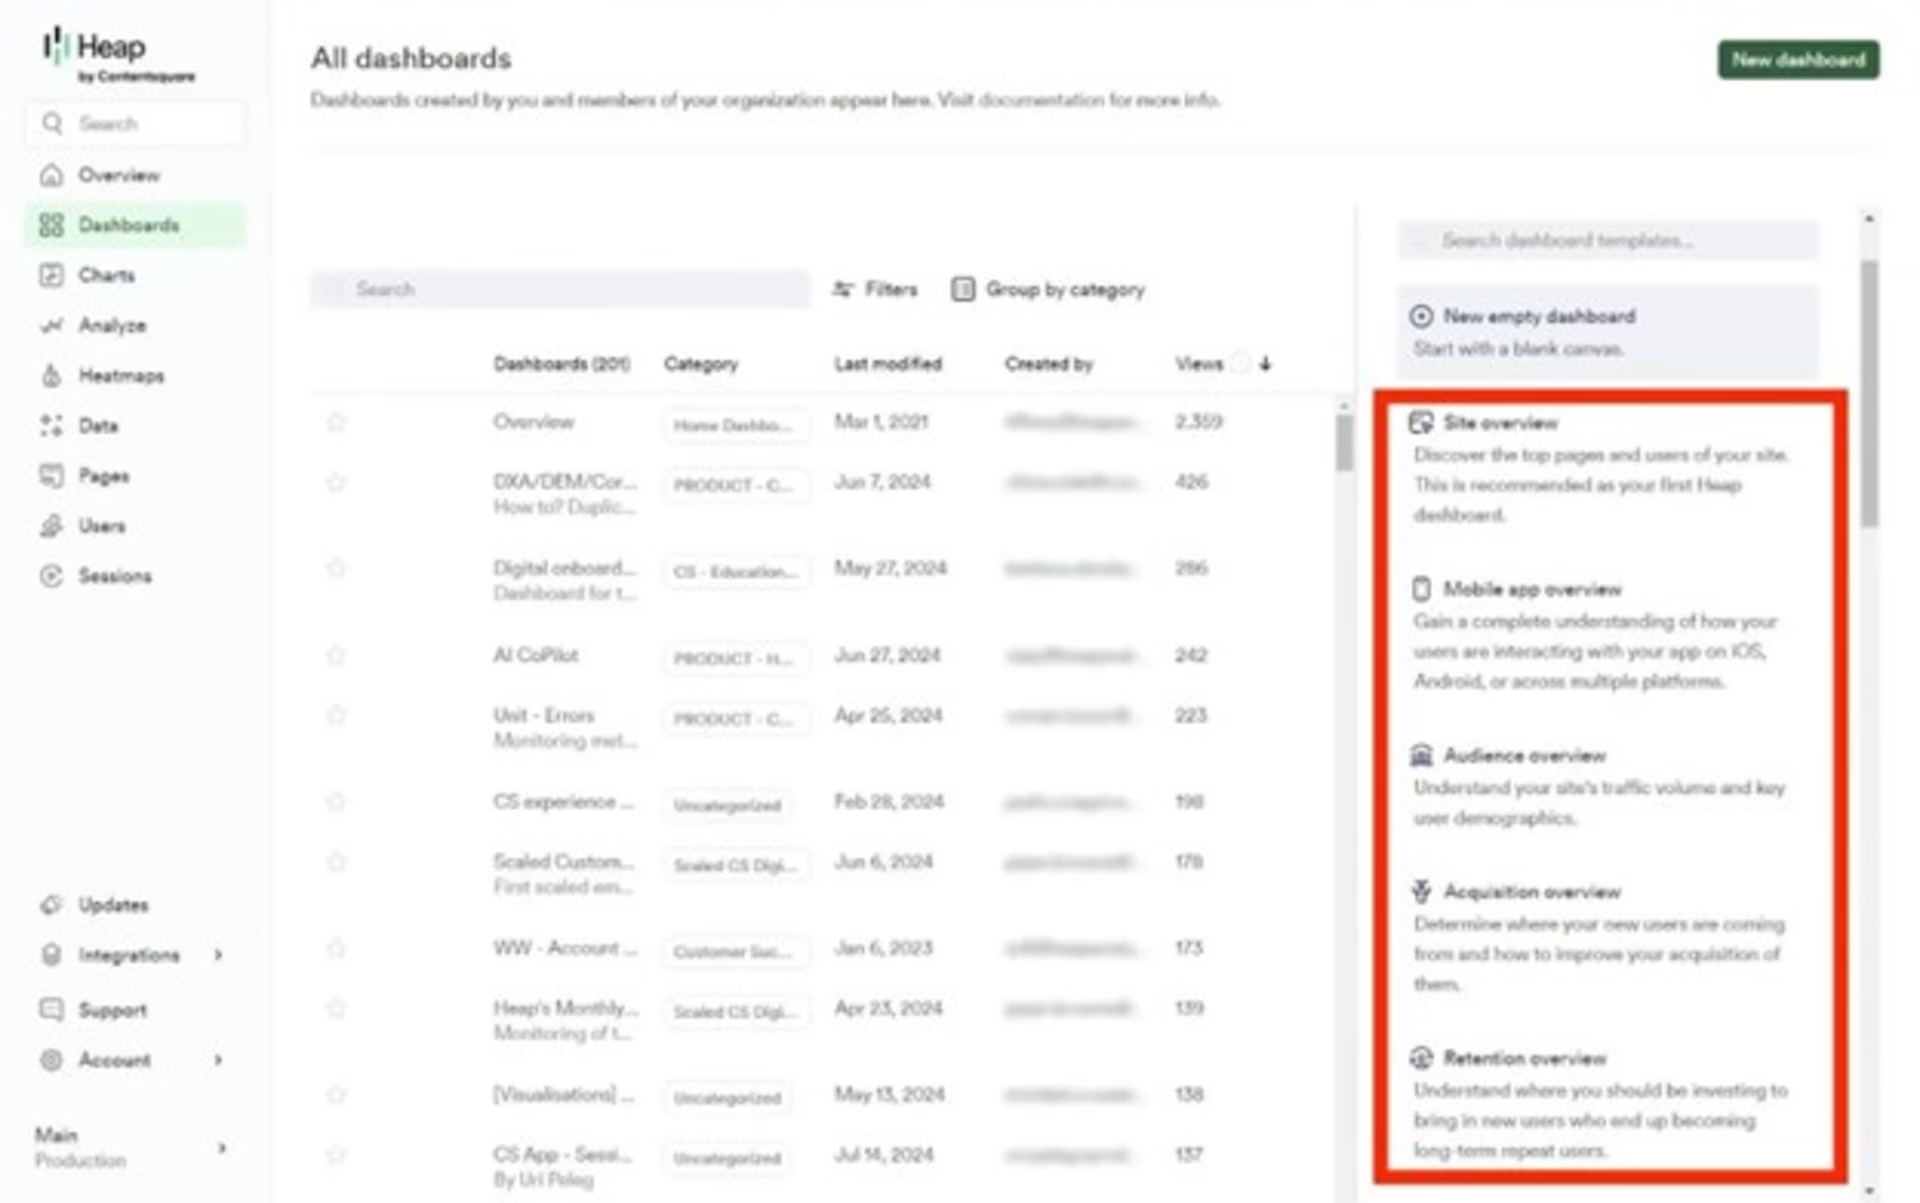
Use Contentsquare’s Product Analytics dashboard templates to quickly create a shared view and track key time-to-value metrics in one place
2. Identify the fastest path to that value
Users experience friction and eventually churn when it takes too long to reach the next value milestone—whether that’s getting set up, completing a core workflow, adopting a key feature, or proving ROI.
To fix this, identify the shortest path to that milestone for each stage and remove friction along the way to improve adoption and customer retention.
Contentsquare’s Journey Analysis tool helps you do this by revealing the paths users take through your site or product from entry to exit, so you can spot where they drop off, hesitate, and successfully move forward. You can also work backward from key goal pages and compare segments to pinpoint the routes that lead to success using the Reverse Journey and Compare modes.

Journey Analysis lets you visualize how users move through key paths, pinpoint the highest-friction moments and prioritize the fixes that’ll improve completion and conversion
3. Find where users struggle or drop off and why
Identifying exactly where users get stuck—and understanding why—helps you remove the specific blockers that extend time to value. For example, you might see that 40% of users drop off during onboarding, but that number alone doesn't tell you whether they're confused by the UI or encountering technical errors.
Journey Analysis helps you see where users drop off at each value milestone—from there, you can dig deeper with Session Replay to understand why it’s happening by watching what users tried to do and what ultimately caused them to get stuck or drop off.
![[Visual] session replay filter](http://images.ctfassets.net/gwbpo1m641r7/4jcMtFiFvl6h7K5pftfM0x/455a9e948d034e567dc532e477fea68f/session_replay_filter.jpg?w=1920&q=100&fit=fill&fm=avif)
Contentsquare Session Replay lets you filter sessions by device and date, watch real user journeys, and use AI summaries to quickly spot where users get stuck or drop off
4. Surface and fix technical issues as they happen
Technical issues often go undetected until multiple users hit the same blocker, increasing churn risk before you even realize there’s a problem. To catch issues early, track error rates on key workflows at every value milestone and set up alerts for spikes in JavaScript errors and API failures that could stop users from progressing.
Did you know? Contentsquare Error Analysis automatically surfaces the most impactful errors affecting the digital experience—across technical and non-technical issues—so teams know exactly what to fix first. And once those friction points are identified, you can create Jira tickets right away, so developers prioritize and resolve bugs faster without back-and-forth clarification.
![[Visual] error analysis](http://images.ctfassets.net/gwbpo1m641r7/2RHGIcGhjdzYE7tMVVWzzg/2bc7b35d22f6b8a0806a09a23f6f7c71/error_analysis.avif?w=3840&q=100&fit=fill&fm=avif)
Use Contentsquare Error Analysis to monitor error rates over time, then prioritize the top errors impacting key journeys, so you know exactly what to fix first
Audi used Error Analysis to catch technical and behavioral friction across its product pages. By setting up alerts for error spikes and frustration signals—like rage clicks and repeated form attempts—the team could prioritize the most impactful problems quickly. Whenever an alert fired, the development team jumped straight into the Session Replay tool to see the issue firsthand, troubleshoot faster, and fix bugs, resulting in a +7% lift in conversions.
When it’s just numbers on a screen, it can be really hard to digest the information. You can feel like the one processing stuff and having to manually get from point A to point B, and that can take a long time. In contrast, because Contentsquare insights are visual, we spend less time analyzing and more time thinking about what we can do about certain issues.
5. Prioritize fixes by impact
Not all friction points deserve prompt attention. Without a clear way to quantify which fixes will actually move the needle, you risk spending weeks on minor pain points while users churn on fixable, high-impact problems.
To identify which ones to prioritize, rank friction points by how many users they affect and how severely they block progress toward your key value milestones. For example, a friction point that causes 50% of users to churn right before reaching value should be your top priority, even if there are 10 other smaller issues earlier in the journey.
Did you know? Contentsquare’s Impact Quantification lets you quickly estimate the business impact of specific friction points or fixes, so you can focus on the changes most likely to shorten time to value.
Apoteket, Sweden's leading pharmacy player, combined Contentsquare’s Impact Quantification, AI (Sense), and Journey Analysis capabilities to understand how customers used its wishlist feature and what they did next. This helped the team quantify which actions mattered most, so they could prioritize important changes.
Now, with the Contentsquare platform and Sense, we’re better at quantifying improvements and attaching key performance indicators (KPIs) to journeys.
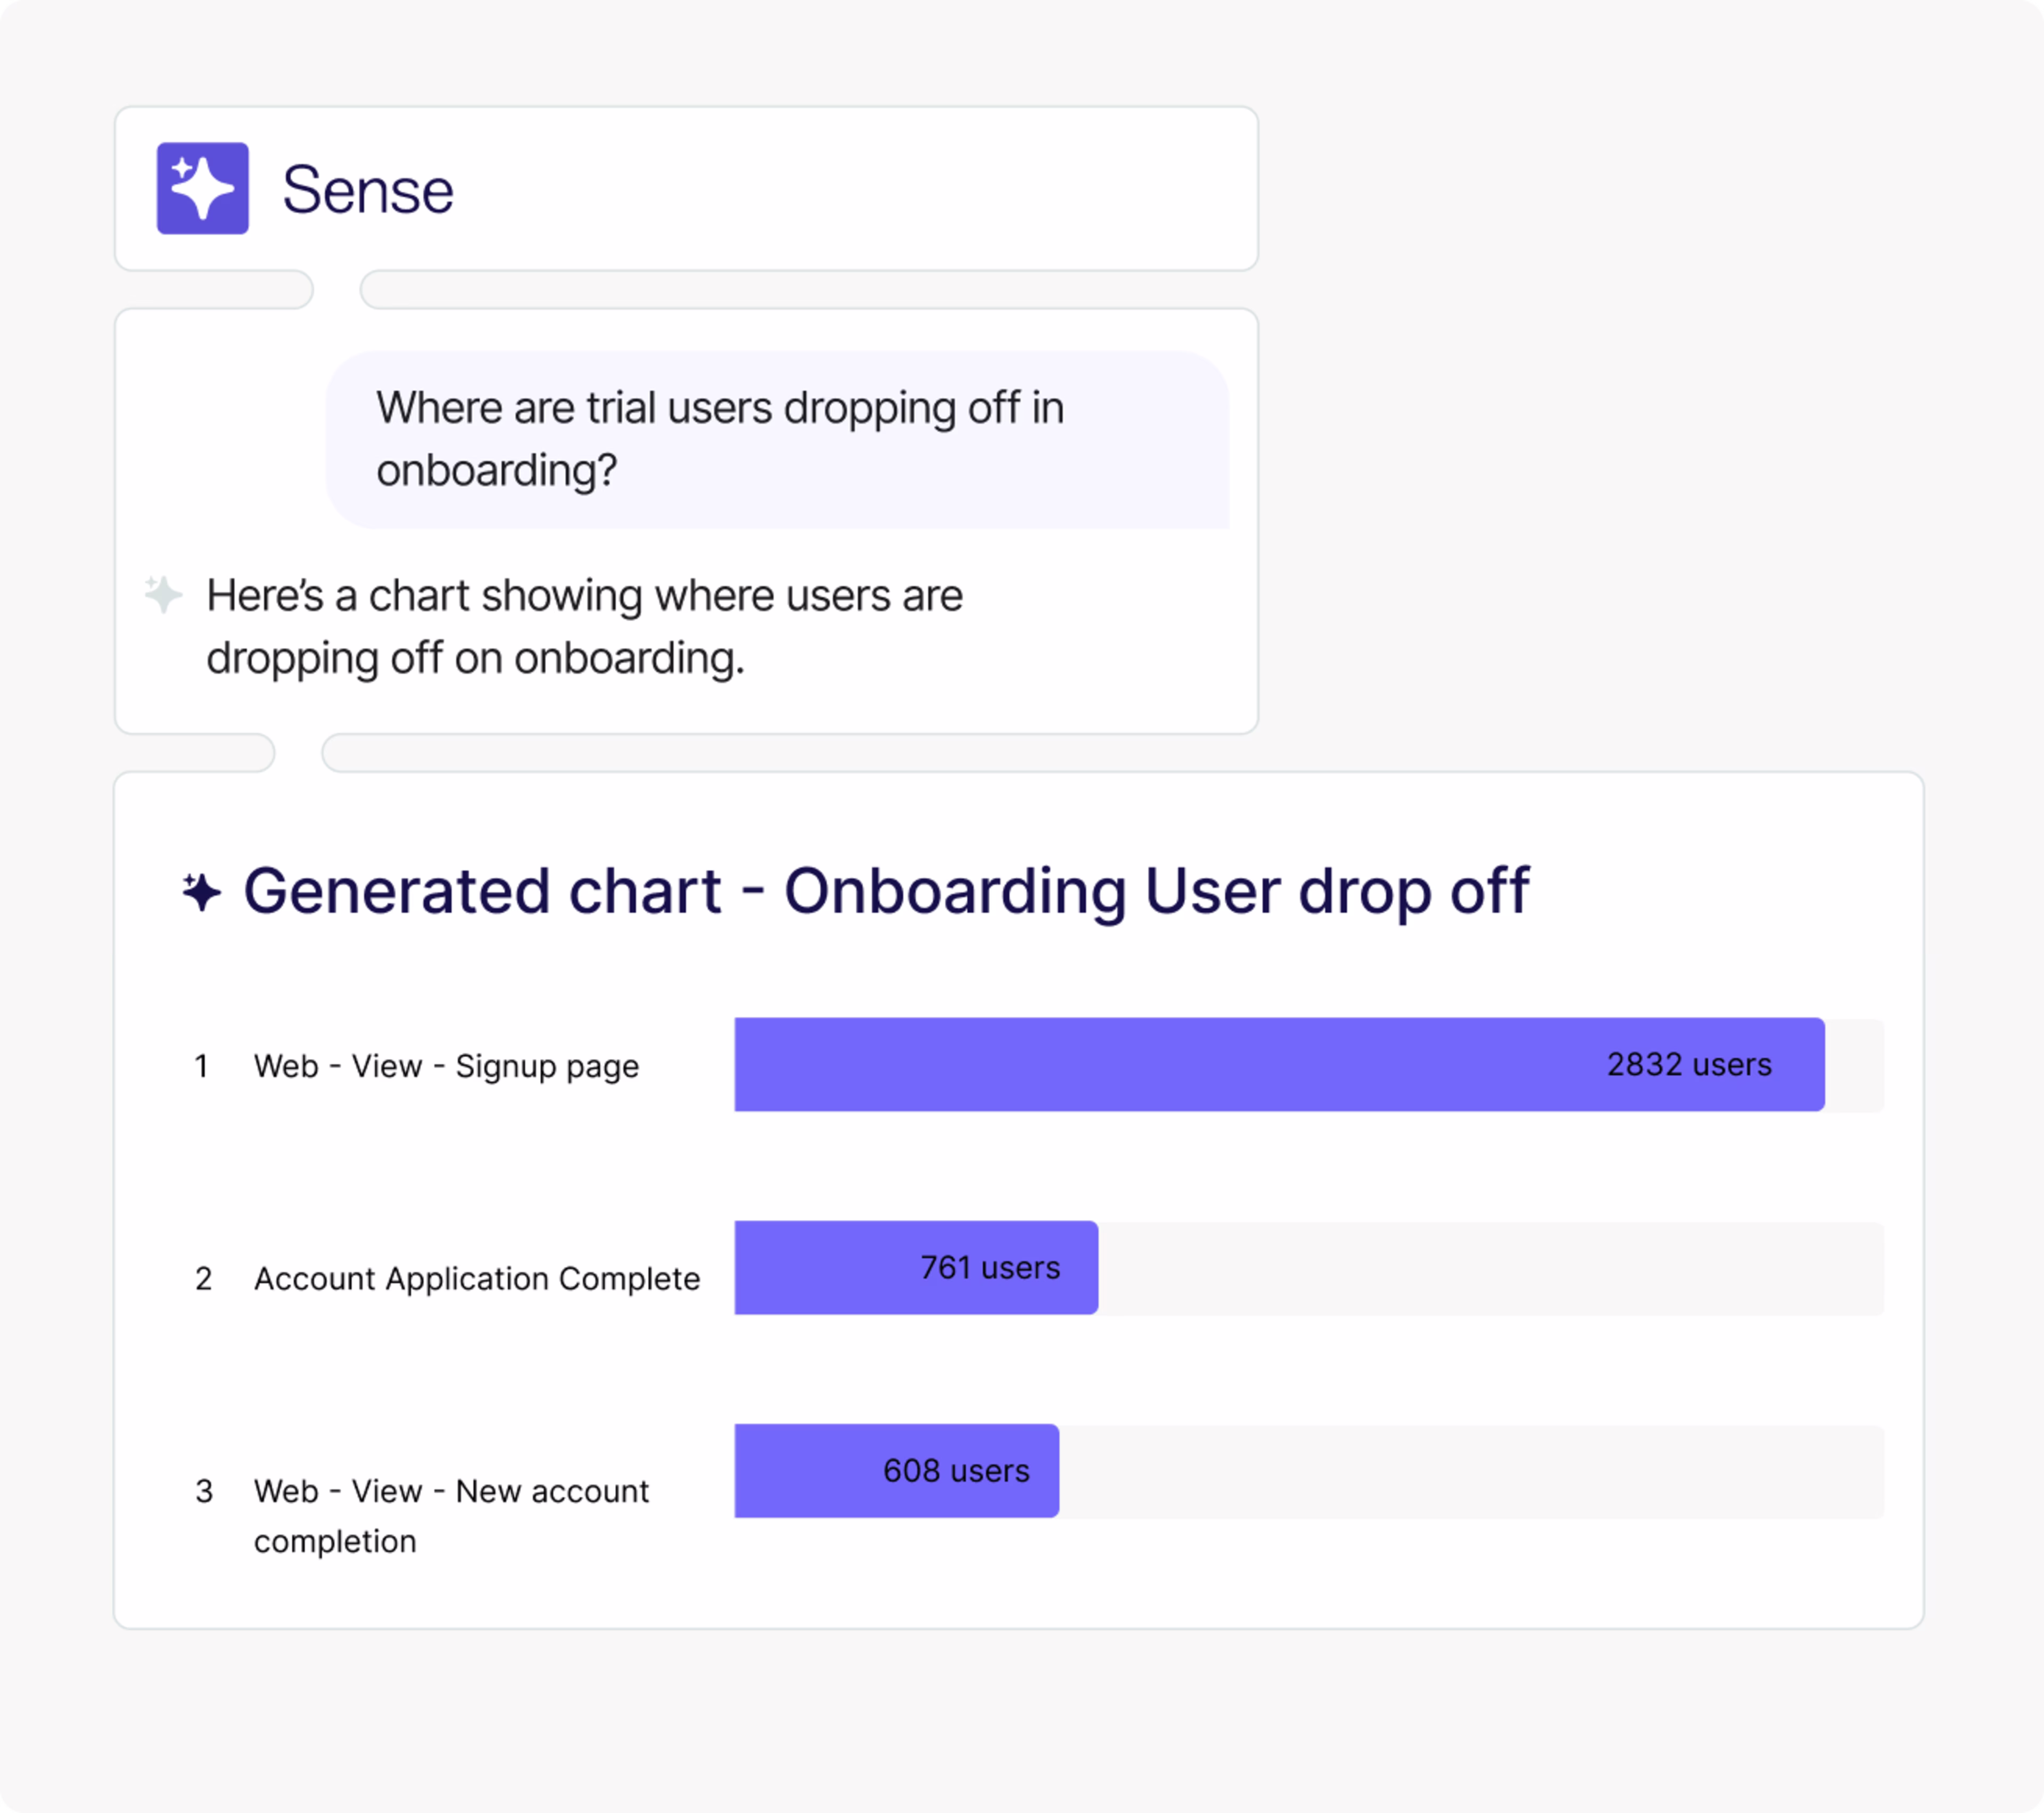
With Contentsquare Sense, you can ask a natural-language question, and it’ll instantly surface the insights you need
6. Validate that TTV actually improved
After implementing changes, compare before-and-after metrics for the specific value milestone you optimized. If you redesigned onboarding to reduce friction, for example, track whether more users reach their aha moment in their first session. Then compare cohorts before and after the change to confirm that the impact of those changes is sustained.
From there, zoom out and validate the ripple effects—did faster time to first value improve 30-day retention, and are users who reach value sooner more likely to adopt additional features or expand usage? If the improvement doesn’t translate to better retention or expansion, you may have optimized the wrong milestone or introduced new friction elsewhere in the journey. In that case, you can repeat steps 2-5 to dig into the root cause.
Pro tip: you can share before-and-after session replay links with customer success, product, UX, or marketing—even if those teams don’t have a Contentsquare account.
This way, everyone can watch the exact journey, see where users got stuck, and compare how the experience changed after the fix. It’s also a simple way to show stakeholders what improved, build buy-in for continued TTV optimization, and align the team on which changes actually have the most impact on the overall customer experience.
![[Visual] Sharing a replay allows teams to share recorded customer sessions with others through a simple URL](http://images.ctfassets.net/gwbpo1m641r7/263G1xx64VTCpx7oAx8ACD/e9d6a66344265d08e70b84cbfbad9269/Sharing_a_replay_allows_teams_to_share_recorded_customer_sessions_with_others_through_a_simple_URL.png?w=3840&q=100&fit=fill&fm=avif)
Share a session replay through a simple URL so teammates can watch the journey, see where the user got stuck, and align on what to fix next
Accelerate time to value with experience intelligence
Shortening time to value is about seeing exactly where users get stuck, prioritizing the friction points that matter most, and validating that your fixes actually work.
Contentsquare gives you the visibility to do this and act quickly. Use Journey Analysis to identify the paths that reliably lead to value and the steps where users drop off. Then use Session Replay and Heatmaps to confirm what users experienced at those moments and why they couldn't move forward.
FAQs about time to value
Time to value shows how quickly users get results after signing up or buying. A shorter TTV improves activation and adoption, reduces churn risk, increases retention, and helps teams prove product value faster.
![[Visual] Contentsquare's Content Team](http://images.ctfassets.net/gwbpo1m641r7/3IVEUbRzFIoC9mf5EJ2qHY/f25ccd2131dfd63f5c63b5b92cc4ba20/Copy_of_Copy_of_BLOG-icp-8117438.jpeg?w=1920&q=100&fit=fill&fm=avif)
We’re an international team of content experts and writers with a passion for all things customer experience (CX). From best practices to the hottest trends in digital, we’ve got it covered. Explore our guides to learn everything you need to know to create experiences that your customers will love. Happy reading!