![[Visual] Frustration Stock image](http://images.ctfassets.net/gwbpo1m641r7/11k60xS0jdvC5YUIGri69k/cb9c99860c58d5459fd2d9d00f5f167a/Defensiveness__one_of_the_greatest_inhibitors_to_true_collaboration.png?w=1920&q=100&fit=fill&fm=avif)
Choosing an analytics platform isn’t about comparing charts and graphs. It’s about finding the most effective way to answer business-critical questions like “What product features are driving retention?”, “Where should we invest our marketing efforts?”, and “How do we get more visitors to convert?”
If you’re weighing the pros and cons of Mixpanel and GA4, keep reading to see where each excels, where they fall short, and an alternative you should consider before picking either.
TL;DR
Mixpanel vs. Google Analytics, at a glance:
Google Analytics’ strengths lie in tracking acquisition-related activity, like traffic and return on ad spend (ROAS)
Mixpanel is better suited to product teams that need to know how users engage with a website, mobile app, or SaaS product
Each has free plans—with significant limitations
Both require some manual set-up and can’t generate retroactive reports
Neither has heatmaps, Voice-of-Customer (VoC) tools, error analysis, or impact quantification capabilities
| Mixpanel | GA4 | Google Analytics 360 |
Price | Free, self-serve, and custom | Free, self-serve | Custom |
Tracking | Manual client-side and server-side SDKs, warehouse connectors, integrations (Ex: Segment) | Partial autocapture—manual tagging required for some events like button clicks and form submissions | Partial autocapture—manual tagging required for some events like button clicks and form submissions |
Use cases | Product, ecommerce, and app analytics | Web and app traffic performance, ROAS analysis | Web and app traffic performance, ROAS analysis |
Lookback analysis | ❌ | ❌ | ❌ |
Real-time data | ✅ | ✅ | ✅ |
Report templates | ✅ | ✅ | ✅ |
Mobile app analytics | ✅ | ✅ | ✅ |
Heatmaps | ❌ | ❌only for websites and apps hosted on Google Cloud Platform | ❌only for websites and apps hosted on Google Cloud Platform |
Session replays | ✅ | ❌ | ❌ |
Customer journey analysis | ✅ | ✅ | ✅ |
Funnel reports | ✅ | ✅ | ✅ |
Error and speed monitoring | ❌ | ❌ | ❌ |
Voice of Customer tools | ❌ | ❌ | ❌ |
AI chat with your data | ✅ | ❌ | ❌ |
Custom real-time alerts | ✅ | ✅ | ✅ |
Support | ✅Slack community, email support, account manager (Enterprise only) | ❌Self-service courses, demo account, help docs | ✅Live chat and email support in English, Portuguese, and Spanish |
Integrations | ✅Integrates with Contentsquare, Google Cloud, Productboard, Figma | ✅ Integrates with Google Ads, Firebase, Google Sheets, BigQuery, Data Studio | ✅Integrates with Display & Video 360, Search Ads 360, Google Cloud Platform, Salesforce Marketing Cloud |
Enterprise privacy & security | ✅ISO 27001, ISO 27701 Certified, SOC 2 Type II compliant | ✅ ISO 27001, ISO 27701 Certified, SOC 2 Type II compliant
| ✅ ISO 27001, ISO 27701 Certified, SOC 2 Type II compliant |
Mixpanel vs. Google Analytics 4 feature comparison
Now you know how Mixpanel and Google Analytics differ at a glance, here’s an in-depth look into their main features and tools, broken down by
Price
Support
Set-up
Dashboards
Data visualizations
Traffic analysis
AI insights
Price
Both Mixpanel and Google Analytics are freemium platforms with some limitations:
You can sign up for Mixpanel for free to monitor up to 20 million events using ‘analytics essentials’
You’ll find most features are only available on the ‘Enterprise’ plan—and you’ll have to contact them for pricing
GA4 is completely free but with reporting, data, and export limits
GA 360 is Google’s premium enterprise-level analytics suite with extended support—you can purchase it directly from Google or use an authorized reseller (for example, Contentsquare’s partner, Merkle | Cardinal Path)
As the saying goes, there’s no such thing as a free lunch. The same lesson applies to ‘free’ analytics software—when calculating costs, don’t overlook the time, effort, and energy you’ll need to put into set-up and administration.
Support and community
As you would expect, support for free Mixpanel and GA4 users is limited. Mixpanel allows free users access to its Slack community and email support (with 48-hour response times). For enterprise users, there’s also onboarding support, a dedicated account manager, and Slack channel support (available as an add-on).
With a free GA4 account, there’s no support at all but there are plenty of courses and third-party tutorials to try out if you get stuck. GA 360 customers who buy directly from Google get live chat and email support in English, Portuguese, and Spanish—if you use a reseller, ask them about the support they can offer.
Event tracking and set-up
The bad news with Google Analytics and Mixpanel is they require manual event-based tracking set-up, meaning
You need to budget many dev hours to get everything up and running
Every team needs to decide in advance what to track—no lookback data or retroactive reports
You need additional engineering time to monitor or rebuild tracking when you make updates or infrastructure changes
It’s an added barrier for non-tech teams, making it harder for them to self-serve analytics reports for data-backed decision making
Mixpanel requires manual set-up for every event 🙈—things like a single button click, form submission, or video play. It takes roughly 30 minutes to set up tracking for each event. When you consider that your website or app will probably generate 30-60 events, that’s an awful lot of set-up time.
GA4 is a slightly better option in terms of tracking because it autocaptures some events (like pageviews, file downloads, and form submissions) if you add some code to your site or Google Tag Manager (GTM).
However, you still have to manually configure GA4’s recommended events (like purchases, log-ins, and searches) and add your own custom events to track behavior that’s specific to your business.
If you’re not okay with that, there’s an alternative—go with an analytics platform like Contentsquare, which has event autocapture so you can automatically collect all user data and generate reports retroactively.
Dashboards and templates
Once you’re all set up, both Mixpanel and GA4 have out-of-the-box templates or default reports to generate common analytics views for different use cases:
In GA4, you get default reports for traffic acquisition, retention, and engagement
In Mixpanel, you get 5 templates for customizable dashboards—called ‘Boards’—for company KPIs, feature launches, lifecycle cohort analysis, marketing KPIs, and ecommerce
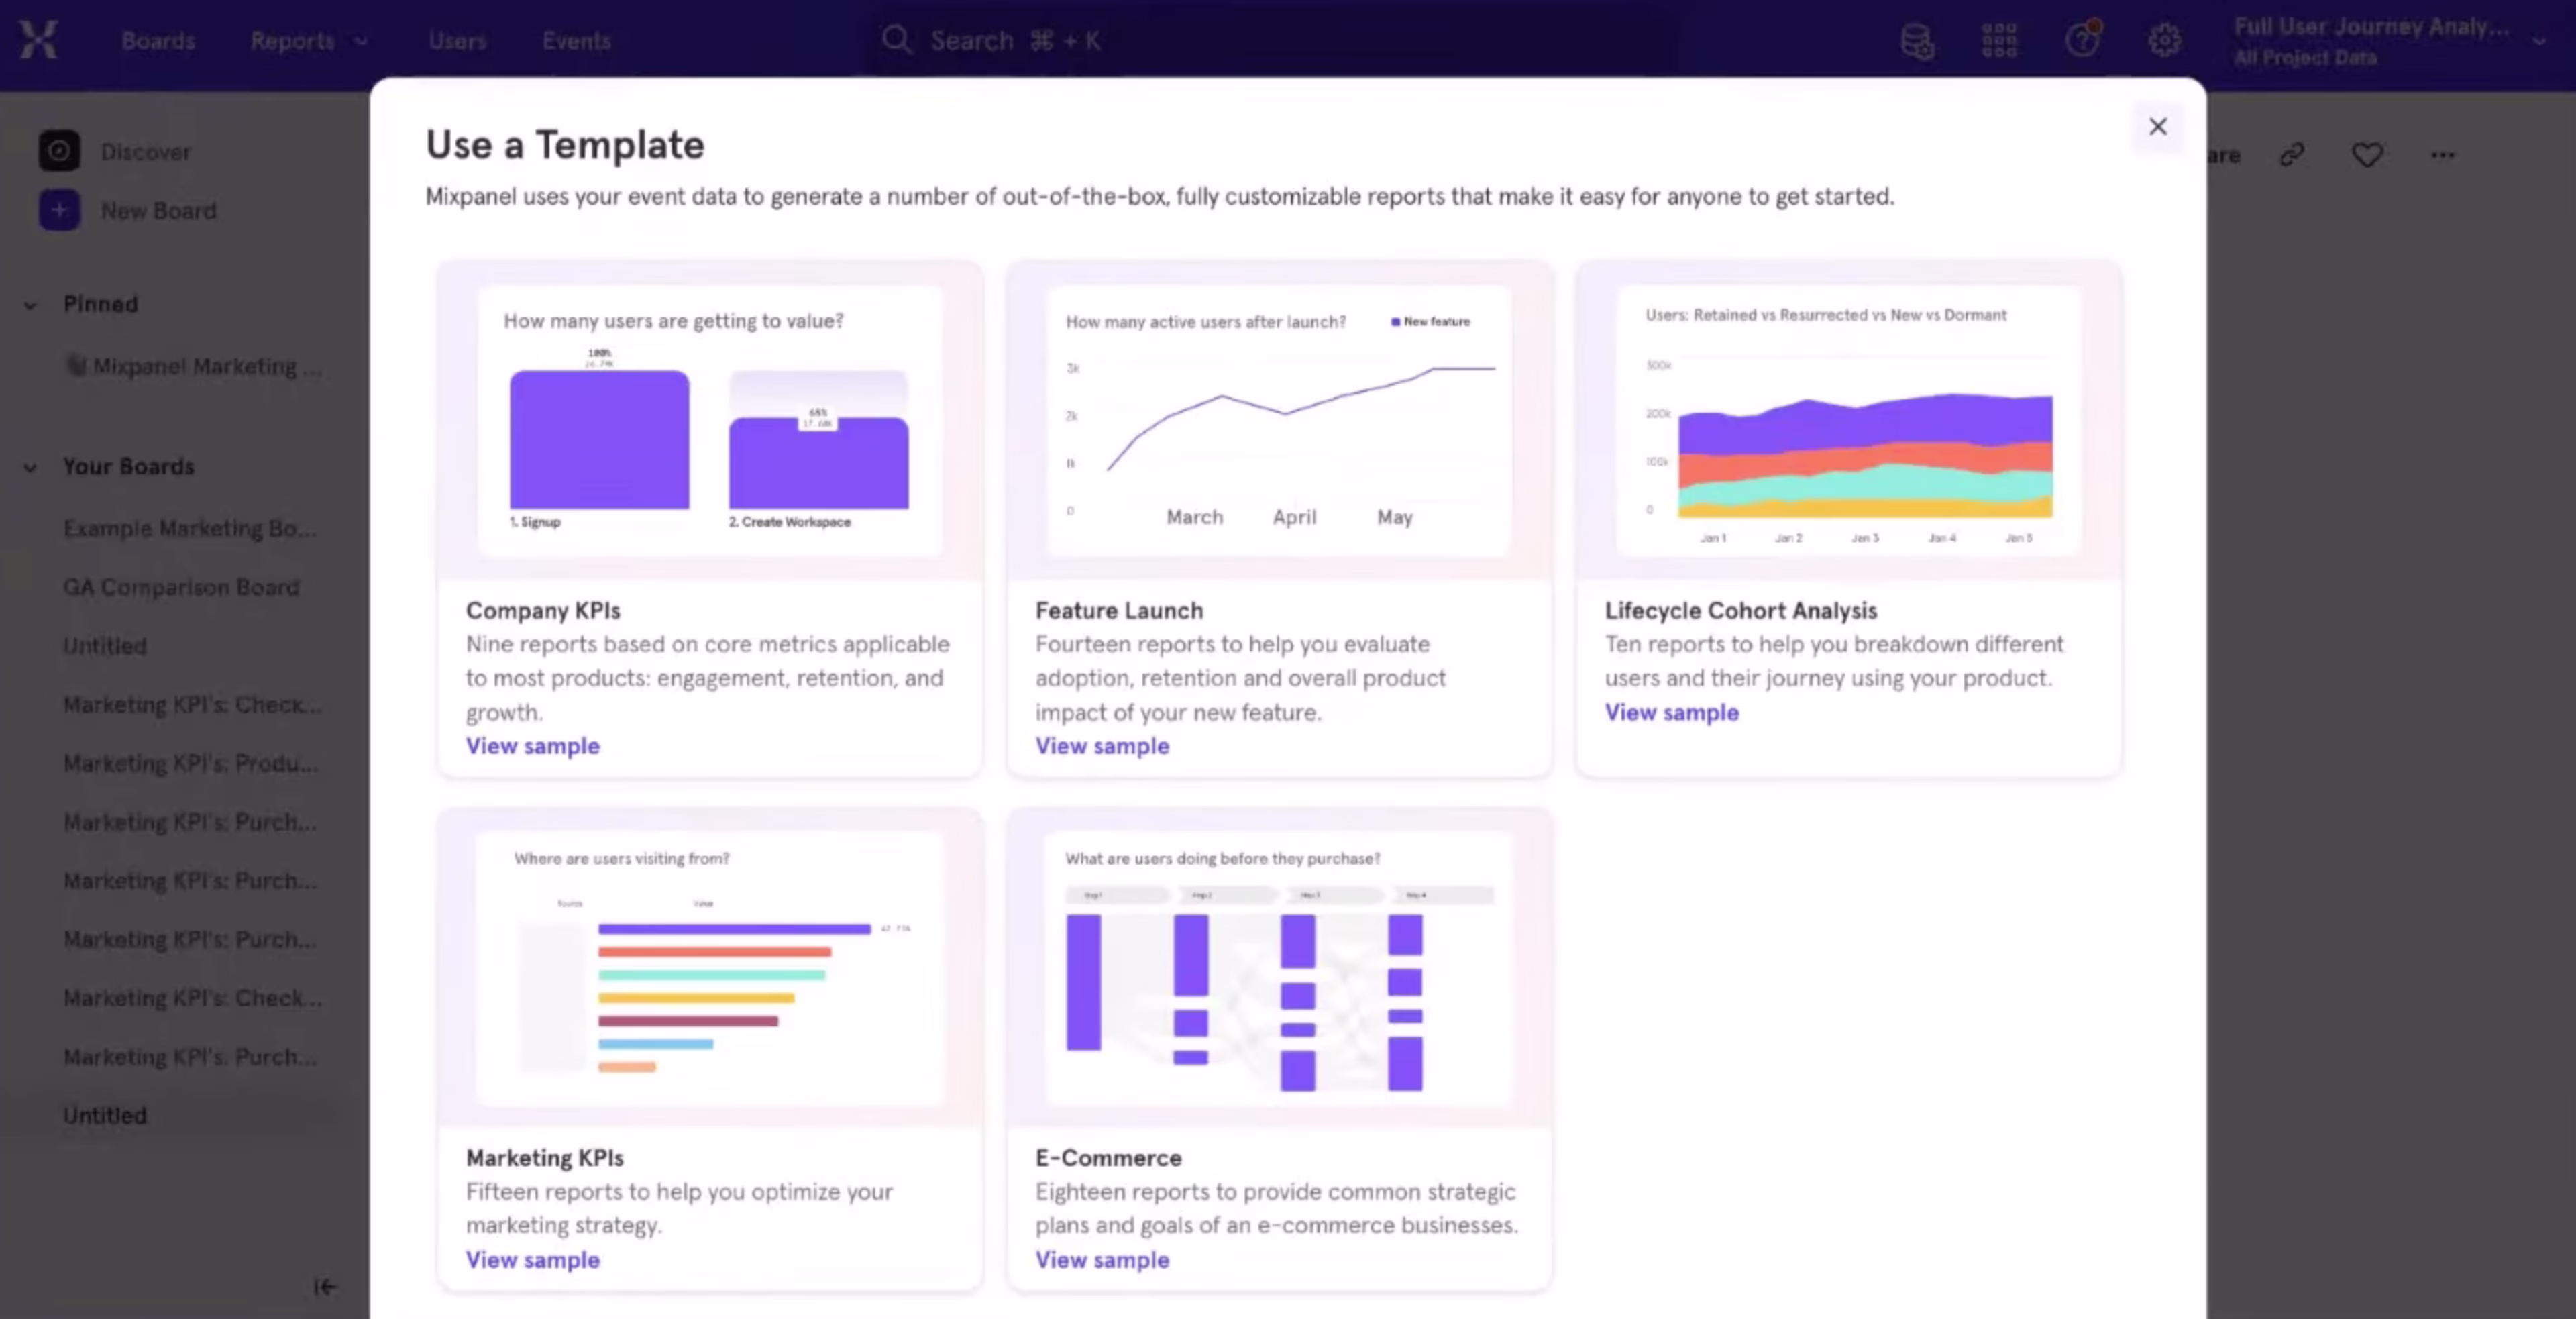
Mixpanel’s dashboard templates
Unlike Mixpanel, Google Analytics doesn’t have a product analytics dashboard feature, which can make it tricky for different team members to find the reports they need to check. If you want more user-friendly dashboards from GA4 data, you’ll need to integrate with a data visualization tool like Google’s own Looker Studio.
If you need a tool to use across teams and projects, Mixpanel’s dashboards give it the edge over GA4. Plus, you can create public boards in Mixpanel, which is useful if you need to share data with a client or investor.
💡Pro tip: if you love templates and dashboards, Contentsquare has plenty to choose from, including site overview (for traffic-related metrics), acquisition overview, retention overview, feature adoption, mobile app overview, and audience overview.
![[Visual] acquisition channel filters](http://images.ctfassets.net/gwbpo1m641r7/7b0XfiH8FJN4ymYJ53swjz/c6ad545c5530677de2b9d46962a7d832/acquisition_channel_filters.png?w=3840&q=100&fit=fill&fm=avif)
Creating a new analytics dashboard in Contentsquare
Visualizations
Even if you love scrolling through rows and rows of data, at some point you’ll need to share insights with teams and stakeholders who don’t. Your chosen analytics platform should have a range of options to display the most impactful insights in a way that even the most data-phobic people can enjoy.
Both Mixpanel and GA4 have several data visualizations in common, including
Charts (including line, stacked line, bar, pie, and table charts)
Funnels
Cohort analysis
User journeys (called ‘Flows’ in Mixpanel and ‘Paths’ in GA4)
User explorations
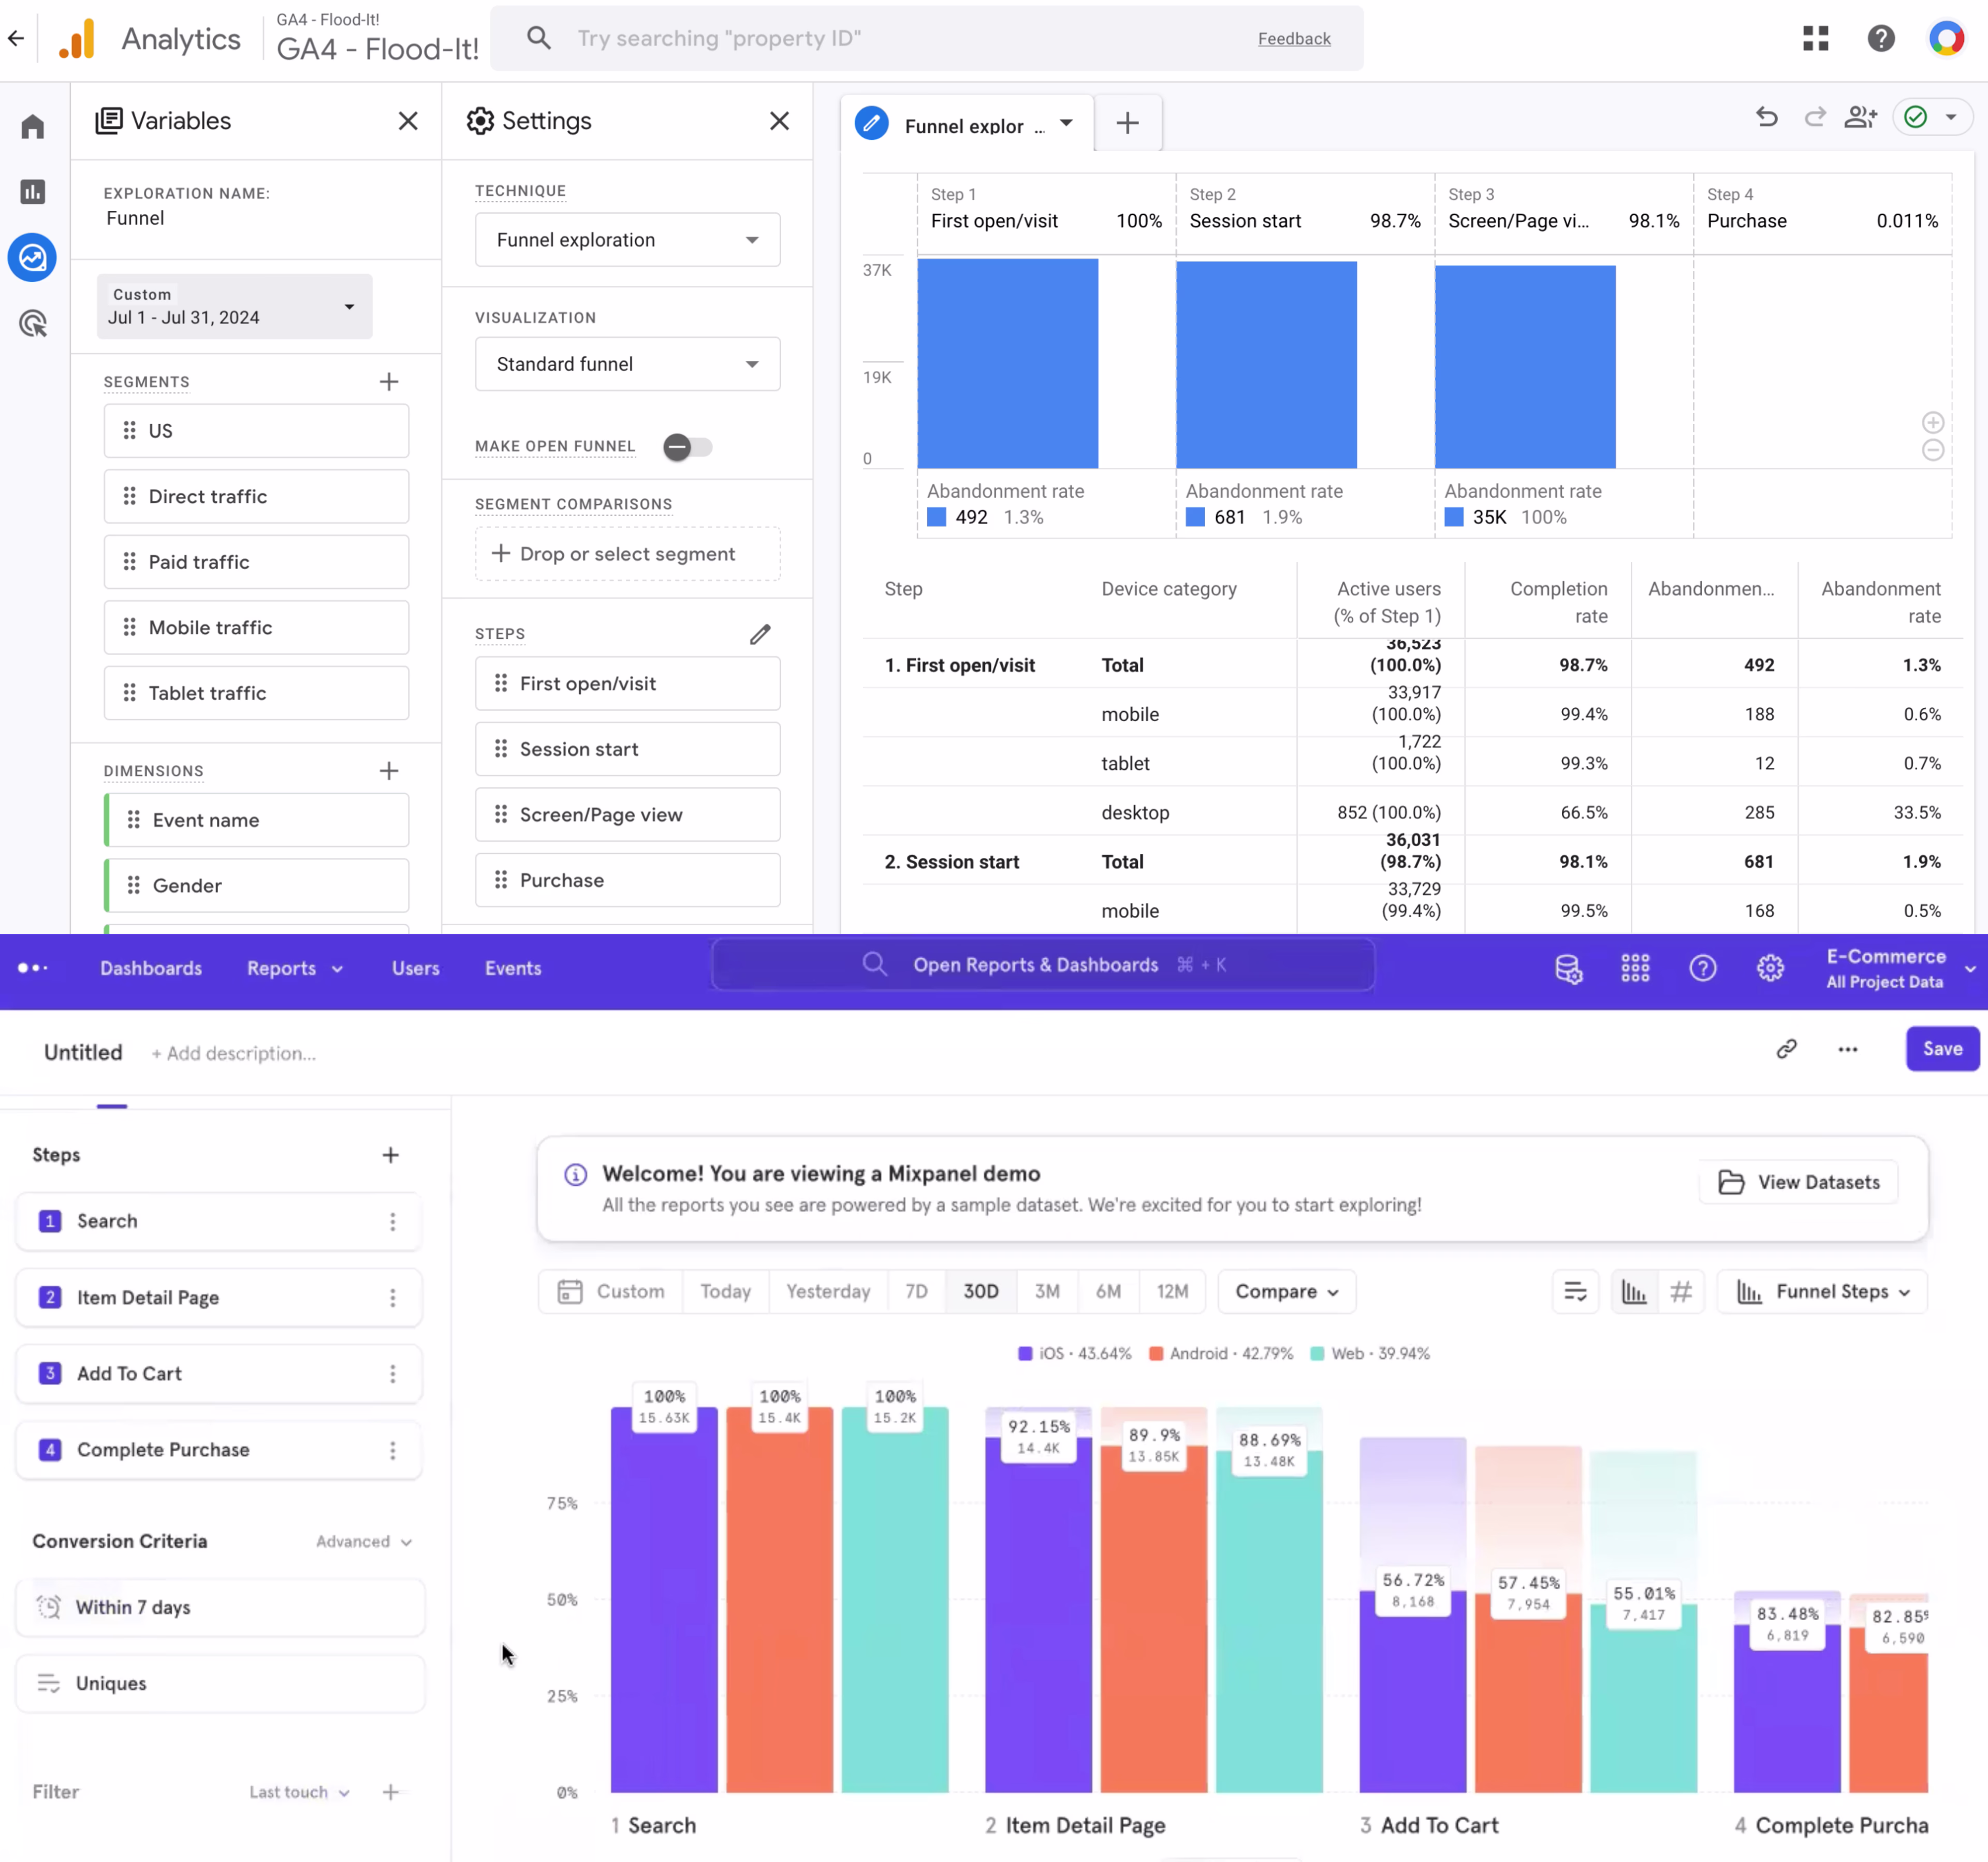
Funnel analysis in GA4 (top) vs. Mixpanel (bottom)
Overall, Mixpanel’s data visualizations are cleaner (and more colorful) than GA’s, but there’s little difference in functionality.
As mentioned above, you can extend the visualization capabilities of GA4 if you use it with something like Looker Studio, but this will add yet another tool to your tech stack.
💡 Pro tip: if you’re looking for better data visualizations than just charts and graphs, try an analytics platform that offers heatmaps. Overlaying user engagement metrics like clicks, conversion rate, and revenue right onto your website helps you quickly identify areas of improvement and opportunity.
![[Visual] File — two-columns-feature-placeholder-1 - Zoning experience and revenue attribution](http://images.ctfassets.net/gwbpo1m641r7/5ELMCzDenXvDdRmgYUkfyO/019e4a34ebb968bbf30f10165416decb/Experience_and_revenue_attribution.png?w=3840&q=100&fit=fill&fm=avif)
Use Contentsquare to visualize click, revenue, and conversion metrics on your live website
Traffic analysis
GA4 is more suitable than Mixpanel if you primarily need an analytics platform to monitor website traffic (like tracking pageviews, referral sources, and demographics).
With GA4, you get extra traffic-tracking features, like a real-time traffic overview, acquisition insights, and advanced audience segmentation.
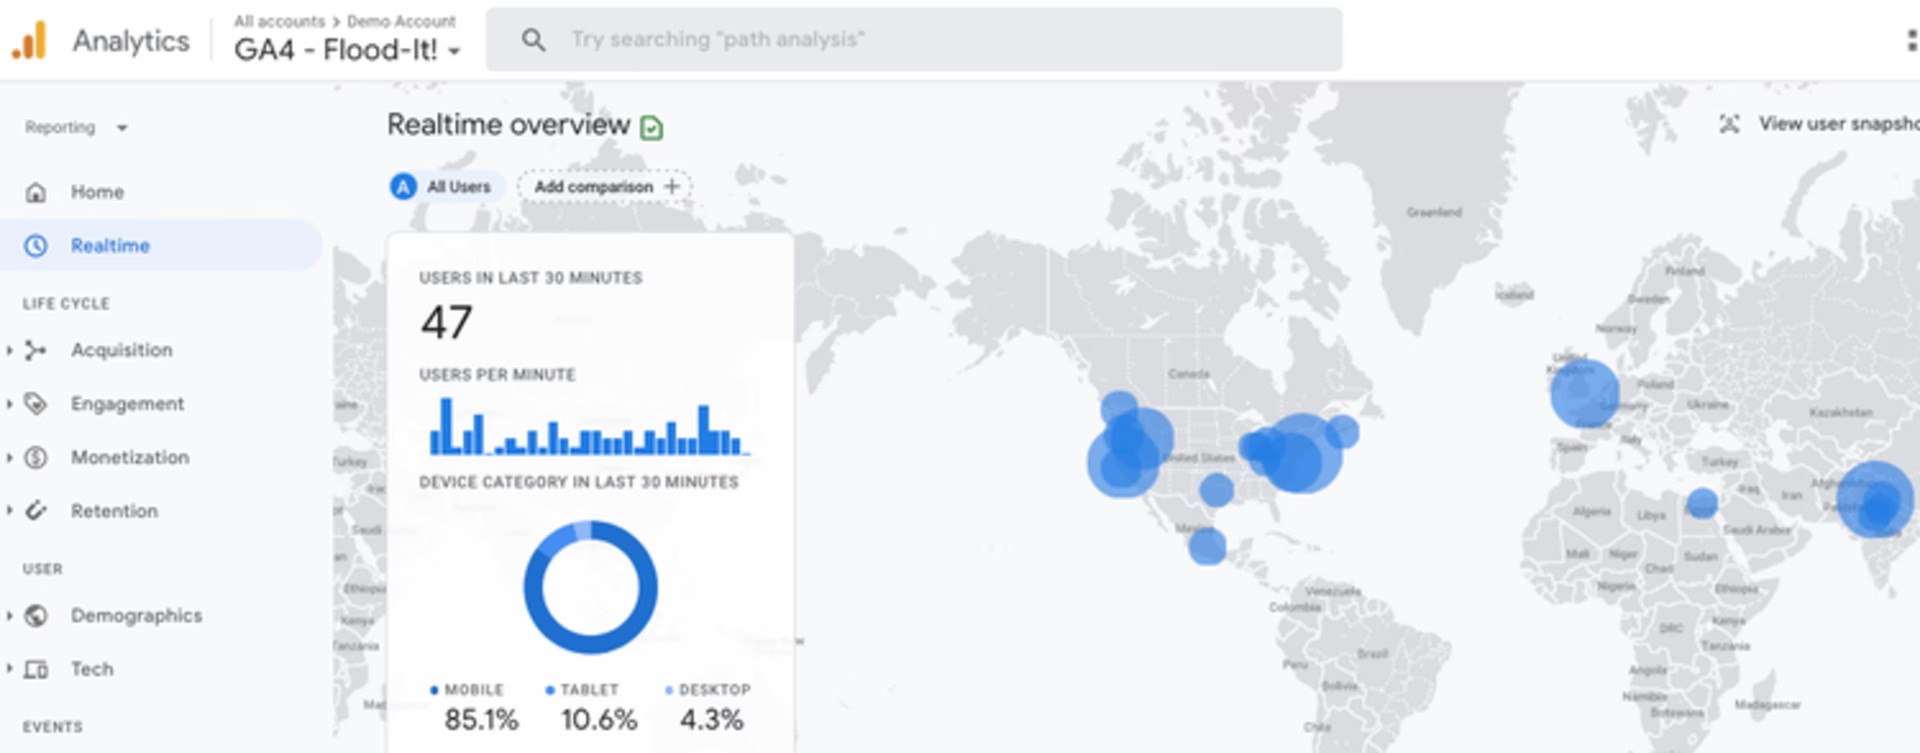
Tracking real-time traffic in GA4
While Mixpanel can measure the same events as GA (like pageviews, UTM parameters, and operating system), you have to build traffic dashboards manually and won’t be able to integrate with Search Console like GA can.
That said, if you need to track conversion attribution (or ‘key event’ attribution, as Google refers to it), Mixpanel is more flexible, allowing you to set up a custom multi-touch attribution model.
In GA4, attribution is calculated automatically using one of 3 available models—data-driven attribution (using machine learning algorithms), paid and organic last click, and Google paid channels last click.
AI and automated insights
Data is only as valuable as the actionable insights you can extract from it. Mixpanel and GA4 have some advanced features to help you surface actionable data quickly.
You can create alerts in Mixpanel and Google Analytics to monitor anomalies or get notified of significant changes in key metrics:
GA4 lets you create up to 50 custom insights and receive email alerts when conditions are met
Mixpanel lets you create custom alerts or use their anomaly detection feature to get up to 50 anomaly alerts (powered by Prophet)
Mixpanel offers a ‘Root Cause Analysis’ feature so you can investigate the underlying data behind alerts
Both GA4 and Mixpanel also use AI to help you create actionable data reports.
Mixpanel has a natural language report creation tool called Spark AI, powered by OpenAI. Use it to
Ask your data questions like “What are users doing before checkout?” and “What’s the conversion rate on our activation funnel?”
Ask follow-up questions (write your own or select from suggestions)
See the methodology behind results
However, you’ll quickly hit a wall as each plan has a limited number of Spark requests each month (from 30 for free users to 300 for enterprise customers).
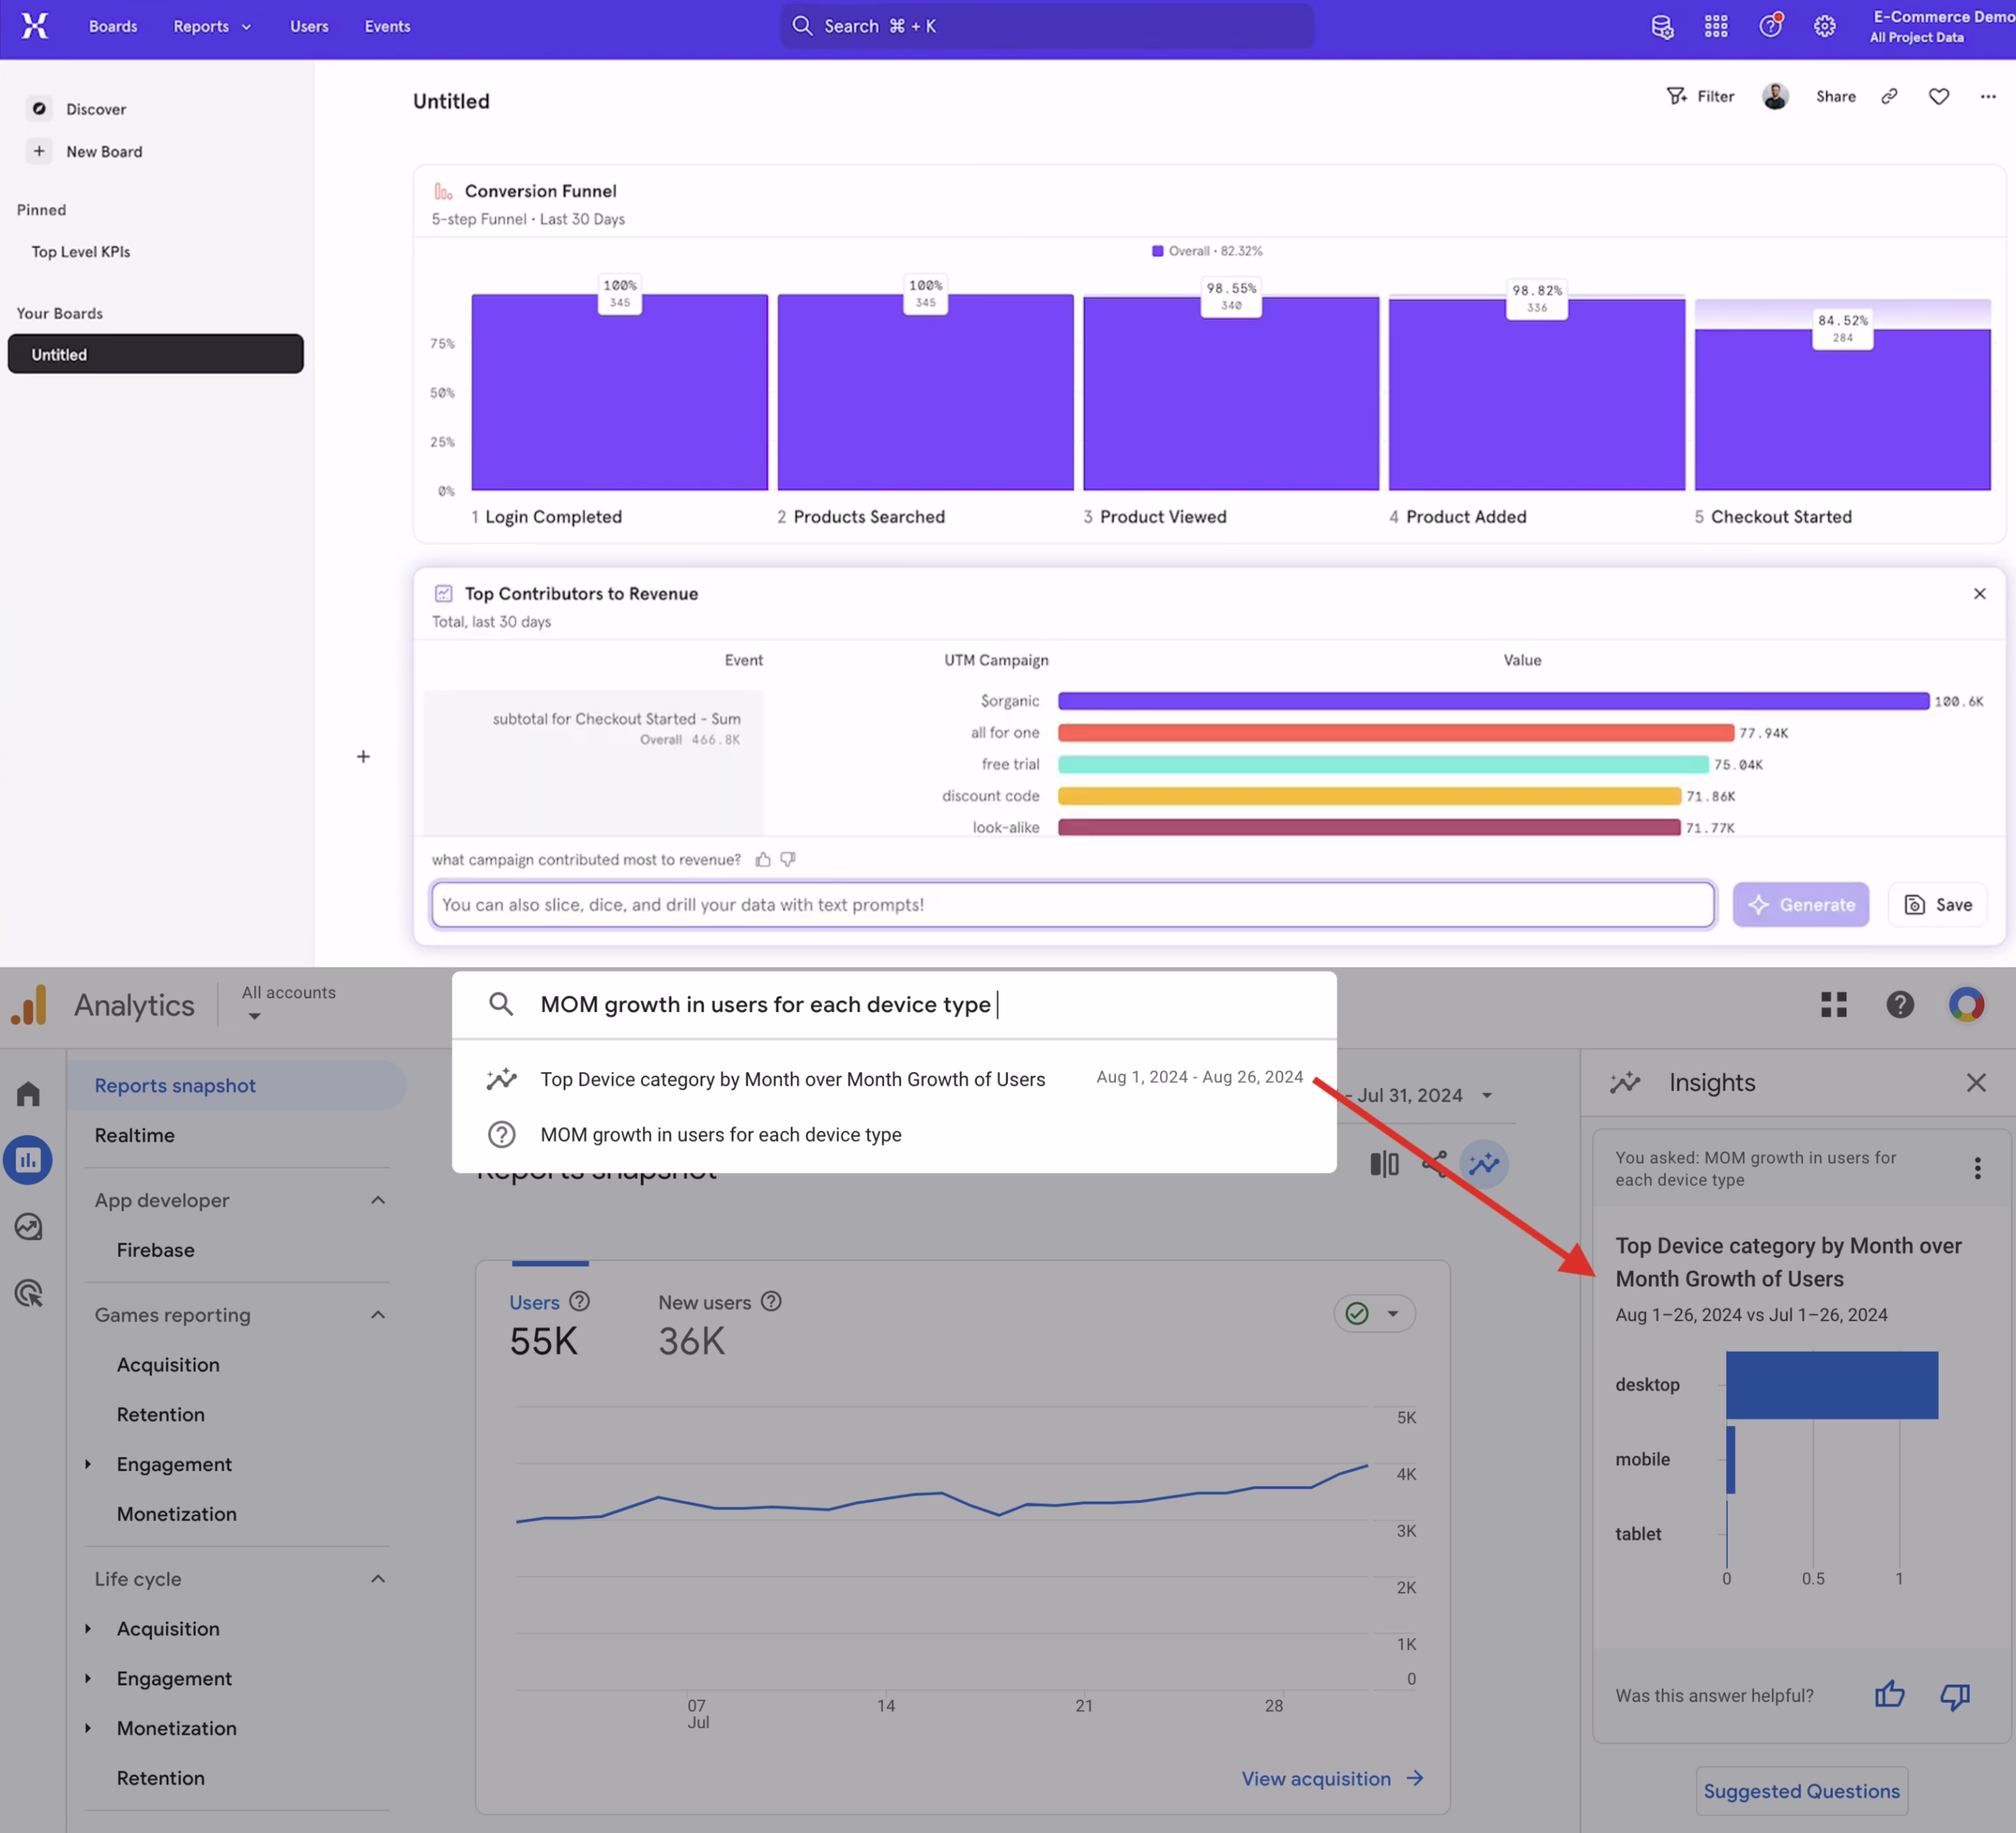
Generating charts using AI in Mixpanel (top) vs. Google Analytics (bottom)
GA4, on the other hand, offers unlimited free requests within its ‘Insights’ feature. You can access it in 2 way
By typing a question into the main search bar
By clicking the Insights icon and selecting a pre-written question
However, Google’s automated insights are only useful for basic questions that happen to be in the suggested questions list. There’s no way to ask follow-ups or understand how charts were built.
Similarly, only certain data-specific queries generate results—for example, ‘MOM growth in users for each device type’ works, but ‘What are users doing before checkout?’ doesn’t.
💡 Pro tip: if you want an analytics platform that can generate any chart from your data, without query limits, try Contentsquare’s AI, Sense, which gives everyone on your team the ability to get actionable insights from your data, fast.
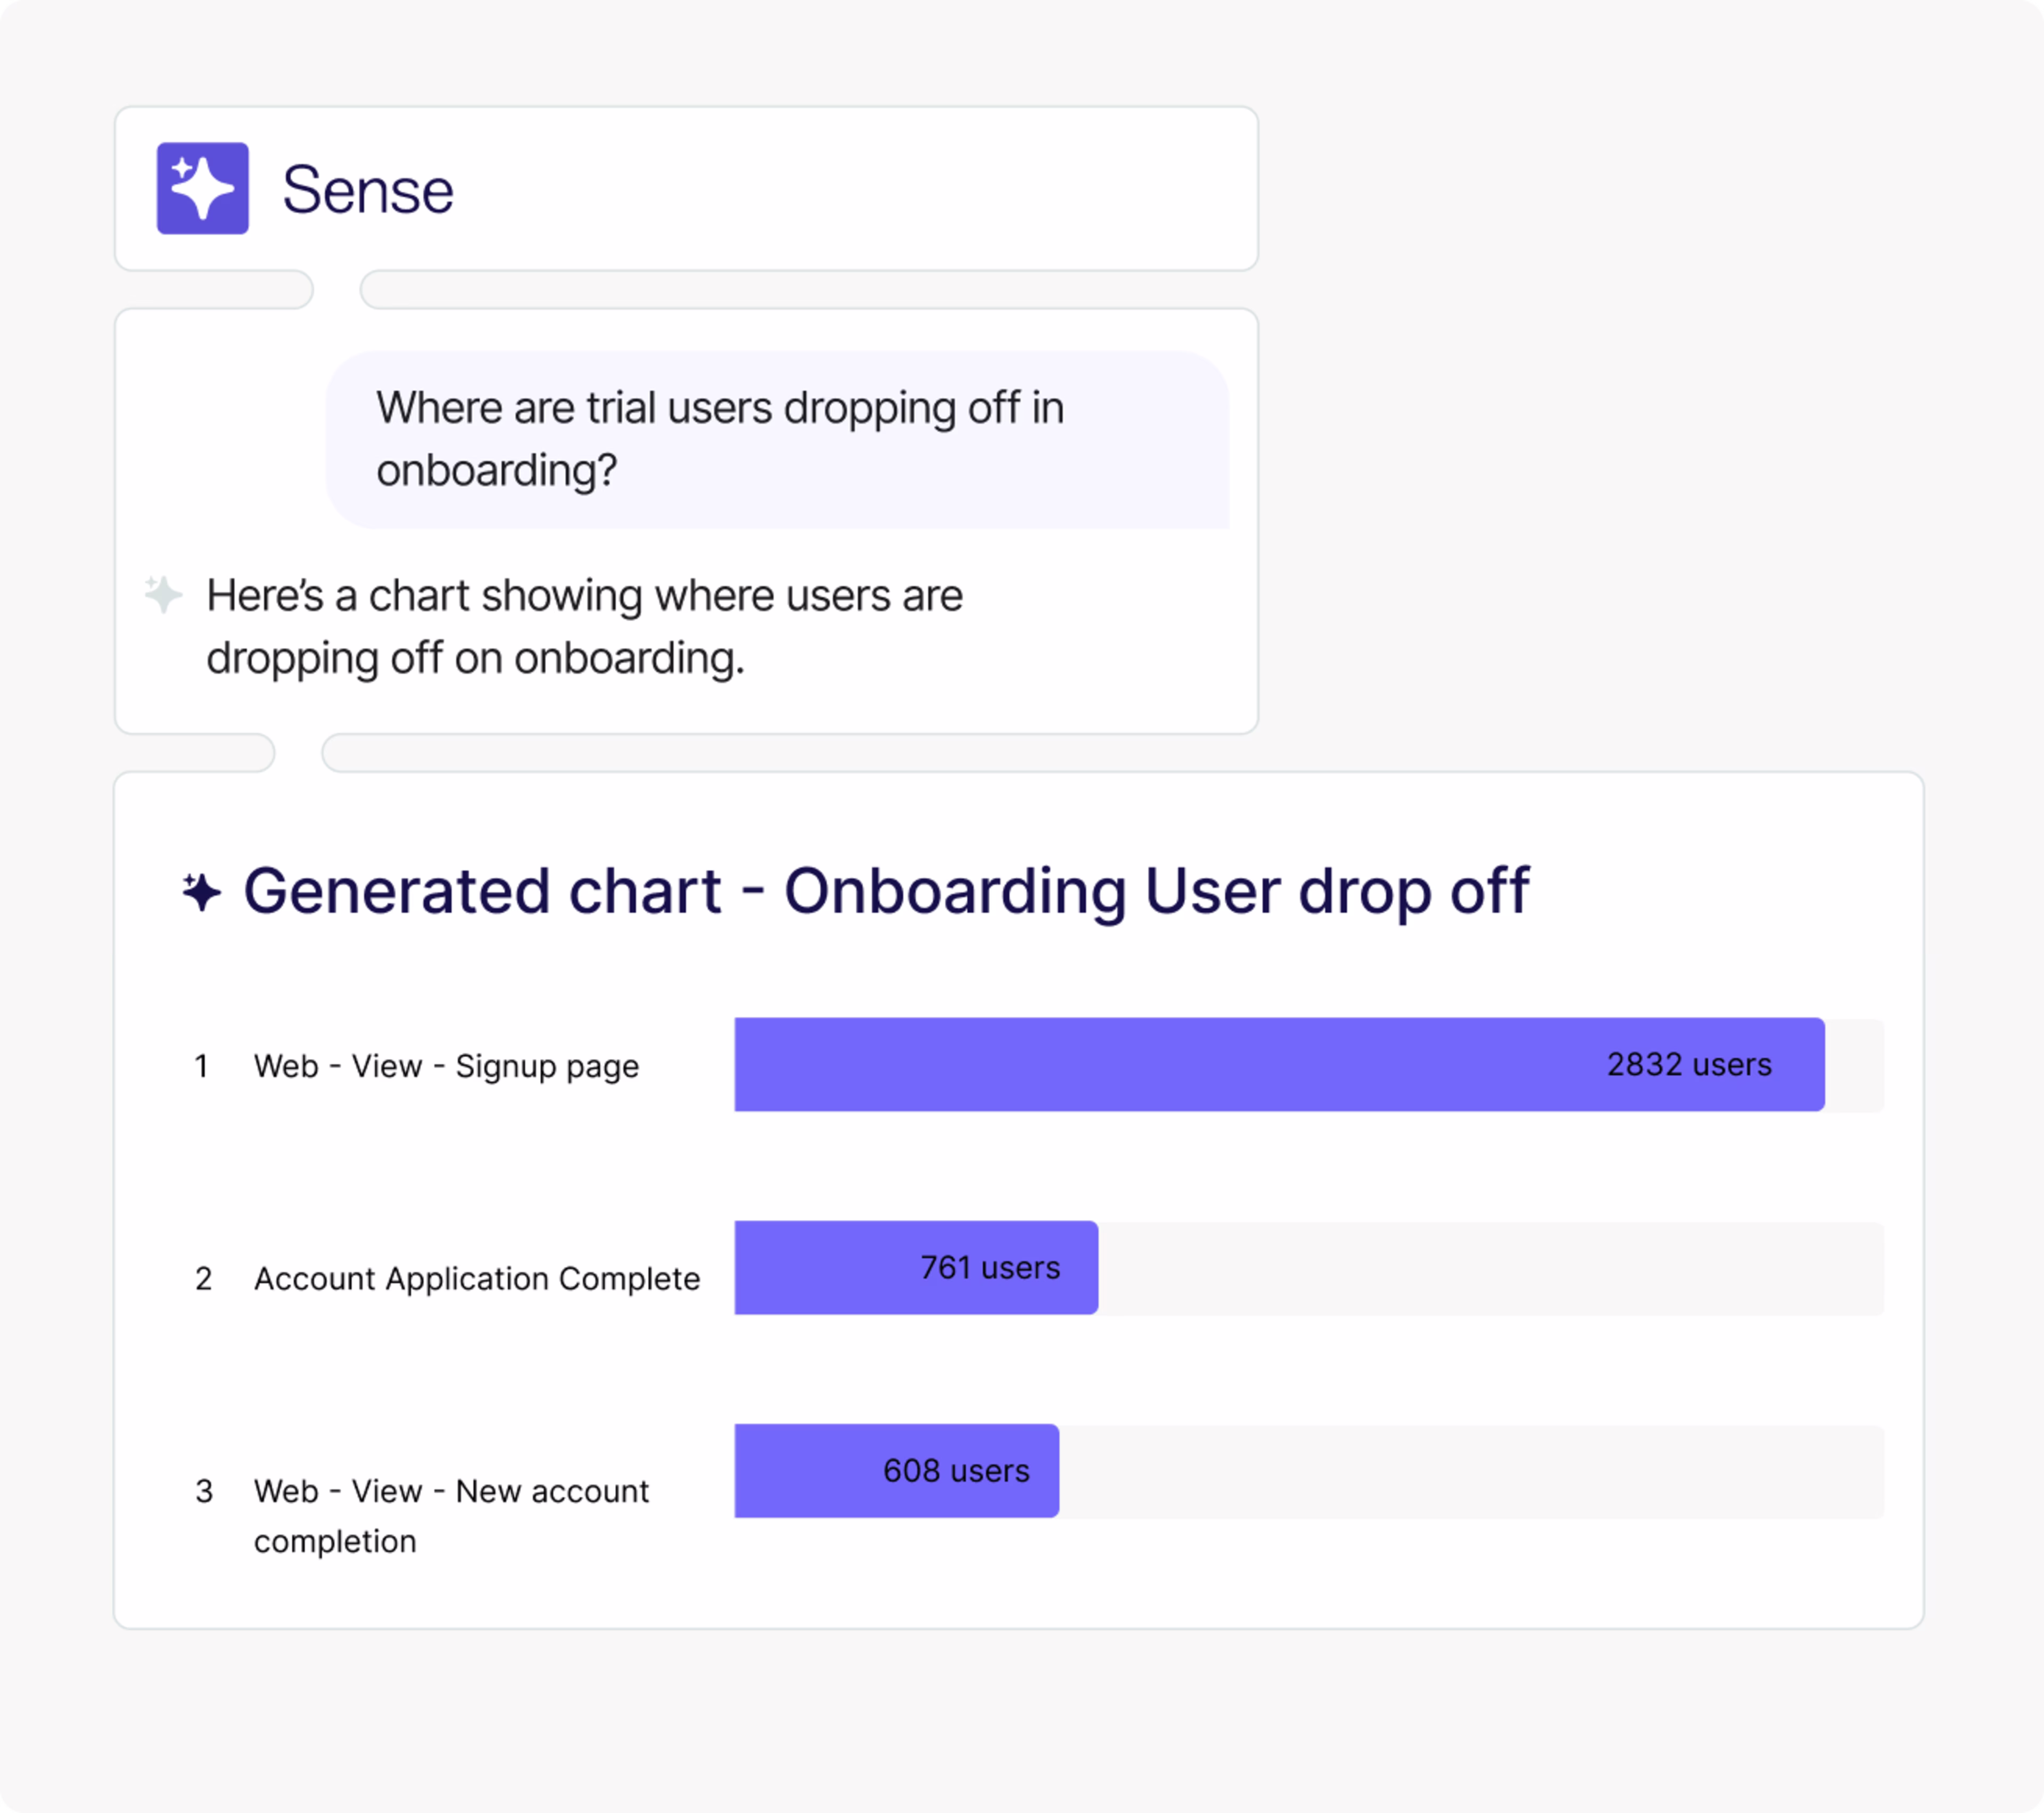
Chat with your analytics data using Contentsquare’s Sense
3 things you can’t do in Mixpanel or Google Analytics (and why it matters)
If you’ve read this far, you’ve probably noticed some issues and downsides that Mixpanel and Google Analytics have in common—namely manual tracking set-up. Before choosing either as your analytics ally, here are 3 things you can’t do in Mixpanel or GA, and why they might hold you back.
1. Visualize user behavior
Data insights are only useful to your business if they’re being seen and shared. Both Mixpanel and GA4 have limited data visualizations that make it harder to spot critical insights and share compelling data stories with stakeholders.
In contrast, a platform with visual tools like Contentsquare transforms your data into intuitive visualizations, making it easier to spot trends, anomalies, and opportunities. Use it to
Overlay metrics onto your site using the CS Live browser extension
Generate heatmaps to visualize and compare user interactions (and their impact) across your site and app
Interact with user-friendly customer journey maps through unique sunburst charts
![[Visual] ab test heatmaps](http://images.ctfassets.net/gwbpo1m641r7/71Feljv3nwR0ng3PEiPGEG/c5c4f991ef679e660e08970edb2a894a/ab_test_heatmaps.png?w=3840&q=100&fit=fill&fm=avif)
Comparing the impact of A/B test variants in Contentsquare—it’s pretty and impactful.
2. Investigate the ‘why’ behind the numbers
Both Mixpanel and Google Analytics take an end-results approach to analytics. They focus on the numbers—sign-ups, onboarding competition, clicks, and churn—while offering limited or no insight into the real humans behind every user action.
If you want to grow your KPIs, you also need to know why people sign up, purchase, bounce, or churn.
Mixpanel has a session replay feature (available as a custom add-on on enterprise plans), so it has a slight edge over GA4’s lack of qualitative insights. But it only works for web-based applications, and replays are stored for just 30 days.
In contrast, an all-in-one platform like Contentsquare shows you the ‘what’ and the ‘why’ in one place, with
Complete product analytics, powered by Heap
Prioritized session replays—cut straight to the most impactful individual user sessions on web or mobile (data can be stored beyond one month by request)
Voice-of-Customer (VoC) tools—launch surveys to monitor feedback and ask your users anything, and get AI-powered next steps
3. Find and quantify the impact of errors
If you choose a platform that just reports on what’s working, you won’t know much about what you could be doing to improve.
User frustration affects 40% of sessions, mostly caused by issues like JavaScript errors and slow page load times, but neither Mixpanel or Google Analytics make it easy to find these high-priority, high-impact fixes.
In comparison, Contentsquare’s comprehensive Error Analysis and Speed Analysis capabilities let you quickly identify technical issues, while its AI-powered frustration scoring automatically shortcuts you to the worst points of friction.
Contentsquare also lets you calculate the revenue impact of anything—an API error, a traffic source, an A/B test variant. That way, you know exactly which updates to prioritize and have no trouble getting buy-in from stakeholders.
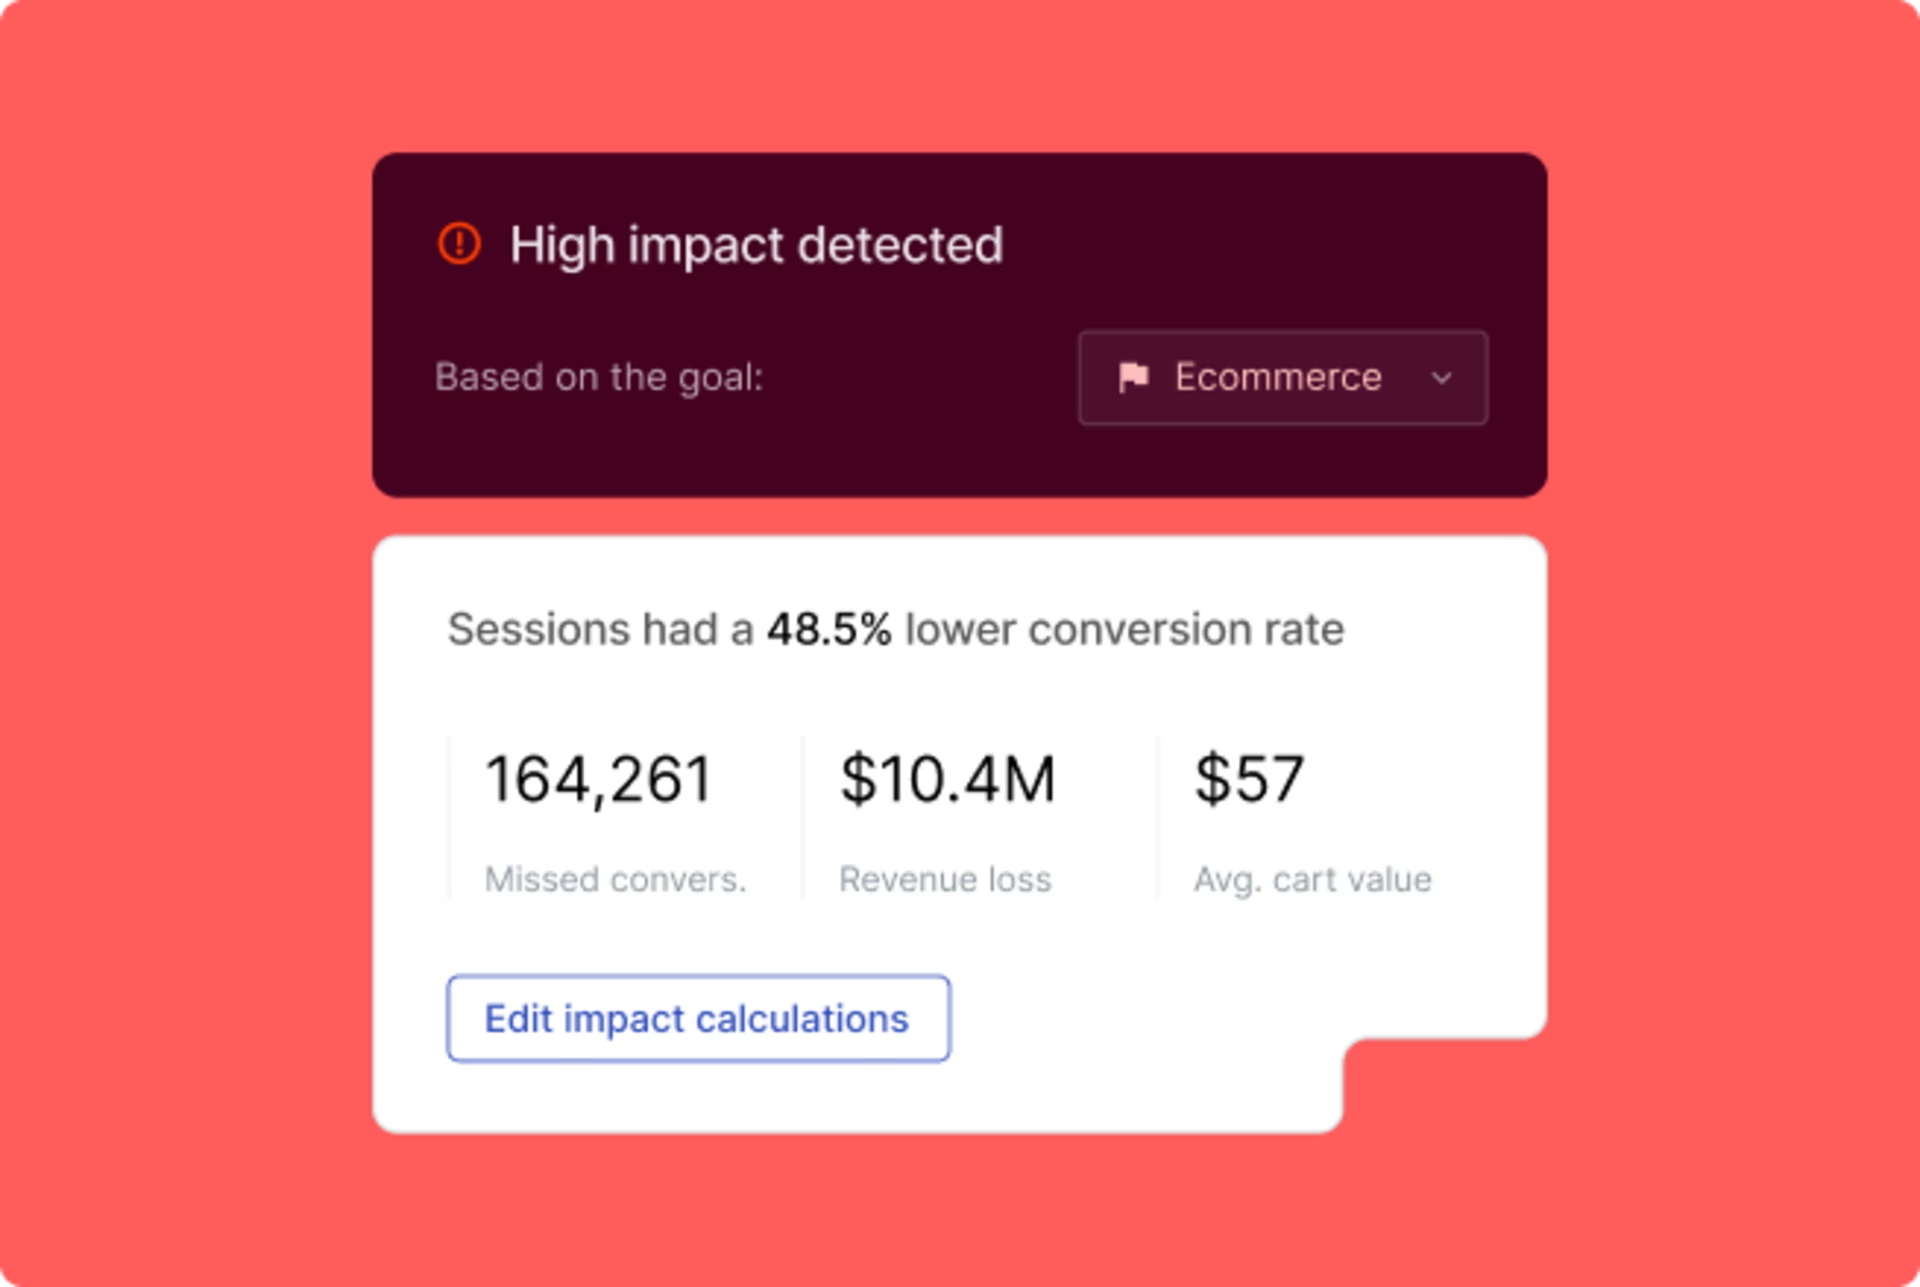
Prioritize what you work on by revenue impact in Contentsquare
Mixpanel vs Google Analytics: which is better for your team?
Mixpanel and GA4 are powerful analytics platforms that offer insight into how people find and use your product or ecommerce store. But they’re not without problems—significant set-up times, limited insight into the user behavior behind the numbers, and no easy way to find and prioritize the site errors leading to poor user experience.
That said, product-focused teams are still likely to get a lot of value from Mixpanel, and GA4 is a cheap and relatively simple tool for beginners and traffic-focused teams to get started with.
But with Contentsquare, you don’t have to choose where to focus. It combines advanced product and web analytics with behavior and feedback data while monitoring for priority issues before they affect your metrics.
FAQs about Mixpanel vs. Google Analytics
Google Analytics (GA) is a web analytics tool launched by Google in 2005. There are currently 2 versions: the free version, GA4, launched in 2020 (replacing Universal Analytics), and the enterprise version, Google Analytics 360, launched in 2016. Google Analytics is currently used on over 30 million live websites.
![[Visual] Jack Law](http://images.ctfassets.net/gwbpo1m641r7/6K99ulcVqLqKGyNZUaPiF8/145af0b27131005d862c790ddcafb3c5/Jack_Law.jpg?w=3840&q=100&fit=fill&fm=avif)
Jack has been creating and copywriting content on both agency and client-side for seven years and he’s ‘just getting warmed up’. When he’s not creating content, Jack enjoys climbing walls, reading books, playing video games, obsessing over music and drinking Guinness.