The information on this page is correct as at 11/12/2025 to the best of Contentsquare's understanding. Both Quantum Metric and Contentsquare are great products. However, they were created for different primary purposes.
Technical teams most often use Quantum Metric for delivering friction-free experiences:
Most users are in technical roles
The most frequent use case is spotting and resolving errors
Technical teams love the Contentsquare platform for these use cases as well. But what about all the other teams that need to understand:
What makes their customers click?
What gets them to convert?
What gets them to come back again and again?
That’s where Contentsquare’s platform goes beyond Quantum Metric. Contentsquare enables users in all roles to get closer to their customers, manage their sites and apps based on their North Star KPIs, understand behaviors and top-down friction points, collect customer feedback, and prioritize investments most likely to move the needle for the business.
In this guide, we compare Quantum Metric and Contentsquare across real use cases so you can decide when to stay reactive with error monitoring and when to move to Contentsquare for proactive, full-funnel experience intelligence.
TL;DR
Contentsquare is the market leader, trusted by +1.3 million websites and apps, with a team of +1,800 across 16 offices worldwide, and +$1.4 billion in funding
Both Quantum Metric and Contentsquare autocapture events, surface errors, monitor performance, and quantify revenue impact so you can prioritize fixes that matter
Quantum Metric is designed for technical teams that need to connect backend and frontend performance
Contentsquare is an all-in-one experience intelligence platform, combining heatmaps, journey maps, product analytics, session replay, error and performance monitoring, and native VoC
Contentsquare is best for digital teams that need a single source of truth to connect every interaction to business impact, generate insights with plain language prompts, and give every team self-serve visibility into journeys, content, and product performance without relying on engineers
What are the main differences between Contentsquare and Quantum Metric?
The best way to choose is by starting from your business goals. What are your biggest challenges in the business? Focus on the use cases that will actually let you solve those challenges.
Typical business goals and use cases | Contentsquare | Quantum Metric |
|---|---|---|
How do we surface obstacles on our sites and apps and prioritize what to fix based on revenue impact? | Very Strong | Very Strong |
How do we improve marketing acquisition, besides eliminating friction? | Very Strong | Medium |
How do we create better products, experiences, and A/B tests, besides fixing errors? | Very Strong | Medium |
How do we listen better by collecting feedback more automatically? | Medium | - |
How do we empower and align all teams, not just technical ones, to create better experiences? | Very Strong | Light |
How do we choose a partner that has the most local offices worldwide so they can support us locally? | Strong | Light |
Contentsquare vs. Quantum Metric use case and tools comparison
Quantum Metric and Contentsquare capabilities are best compared in the context of the use cases that they help solve. Let’s go through them one by one.
How do we surface obstacles on our sites and apps and prioritize what to fix based on revenue impact?
Both Contentsquare and Quantum Metric excel at Experience Monitoring use cases, supported by key capabilities such as Session Replay, Error Analysis, and Speed Analysis.
Session replay
Quantum Metric and Contentsquare both provide state-of-the-art session replay, which recreates individual user journeys across your website or app.
Both provide session replay capture for 100% of traffic
Both platforms let you recreate sessions on desktop, mobile, tablet, and apps
Both platforms enable advanced support teams to resolve escalated issues by replaying the exact sessions related to customer service tickets, understanding root causes of issues down to errors, granular network details, request/response headers, and bodies
Both platforms ensure security by enabling only authorized personnel to decrypt data needed for handling customer service issues
Both platforms let you click to see how common an error is and quantify the revenue impact of any error, so you can prioritize fixes
Both platforms let you share specific replays and events with your team to resolve issues quickly via integrations with Jira, Slack, or Microsoft Teams
Both platforms use AI to generate session summaries to help you quickly decide which replays to watch
![[Asset] Session replay summaries](http://images.ctfassets.net/gwbpo1m641r7/37Slb23dAdFsAgNItuUNPc/5ad533ecdc801e082aeef8bfaca324ce/sessionreplaysummary.webp?w=3840&q=100&fit=fill&fm=avif)
Focus on the most important replays with Contentsquare session summaries
The main differences for session replay come from advanced features and platform interconnectivity:
Only Contentsquare automatically ranks sessions to watch with a Frustration Score so you can save time by focusing on your most insightful session to watch
When clicking through from funnel reports, replays start at the exact step in the user journey so that teams don’t waste time watching entire sessions
Error analysis
Both Quantum Metric and Contentsquare are extremely strong for website and mobile app error analysis.
Both platforms have customizable real-time alerts for critical issues
Both platforms provide error reporting that surfaces any type of technical issue blocking users from completing their goals. For example, API errors, apps crashes, JavaScript errors, console messages, and functional errors.
Both can calculate the potential revenue impact of any error, so you can see how much a fix is worth—in Contentsquare, it’s called Impact Quantification, in Quantum Metric, it’s ‘one touch quantification.’
Both platforms make it easy to file tickets via Jira or rally teams to action via Slack and Microsoft Teams
![[Visual] error analysis](http://images.ctfassets.net/gwbpo1m641r7/2RHGIcGhjdzYE7tMVVWzzg/2bc7b35d22f6b8a0806a09a23f6f7c71/error_analysis.avif?w=3840&q=100&fit=fill&fm=avif)
Error tracking in Contentsquare
But you’ll get some extra features if you choose Contentsquare, for example:
Only Contentsquare provides retroactive text search, which enables teams to
Surface and quantify all occurrences where site users encountered unexpected error messages of any kind. For example, “Oops, something went wrong.”
Visualize how users experience these messages
Learn things that technical teams didn’t already know from their APM tools such as Dynatrace and Datadog
Only Contentsquare generates error summaries to help you quickly understand what each error is about and the impact it’s having
Speed analysis
Contentsquare and Quantum both help identify where your site is too slow, potentially causing users to bounce or affecting search engine rankings.
Both Contentsquare and Quantum Metric provide speed analysis based on real user monitoring (RUM) to identify performance issues affecting conversion
But you’ll get additional features if you choose Contentsquare:
Only Contentsquare provides additional Speed analysis tools based on synthetic monitoring, i.e. lab testing. Teams use these to
Speed test new product releases before launching them to avoid costly blunders
Automatically speed test production experiences to get alerted if performance degrades
Get automated tips about what’s hurting performance and how to speed it up
Contentsquare Experience Monitoring is the perfect solution if you’re searching for Quantum Metric alternatives because Quantum lacks synthetic monitoring.
💡 Pro tip: we’re not just here to sell you on the benefits of Contentsquare—we use it ourselves! Read our ebook on how Contentsquare uses Contentsquare to see how we put our own Speed Analysis tools to work to improve our Core Web Vitals scores.
What Contentsquare does better than Quantum Metric (and why it matters)
Experience optimization is a team sport that goes beyond technical roles to include product, design, marketing, digital, ecommerce, and data teams.
While session replay is great for technical teams that are troubleshooting issues, everyone else’s use cases require more scalable ways to get to insights beyond just looking at experiences one session at a time.
That’s where Contentsquare goes beyond Quantum Metric with unique macro-level visualizations and metrics. We turn millions of interactions into optimization-focused insights so every digital team knows exactly what to fix or improve first.
“Contentsquare offers a more comprehensive suite of analytics, as well as a user-friendly interface and a level of customer support that’s been amazing." – Adam Cheal, CRO Specialist at Easyjet
How do we improve marketing acquisition, besides eliminating friction?
Typical bounce rates in the 40-60% range mean most visitors leave before they ever hit a bug. To hit their customer acquisition targets, marketers need to be aware that sometimes, bounces have nothing to do with errors or struggle. One of the fastest, easiest, and most visual ways to do that is with heatmaps.
Heatmaps
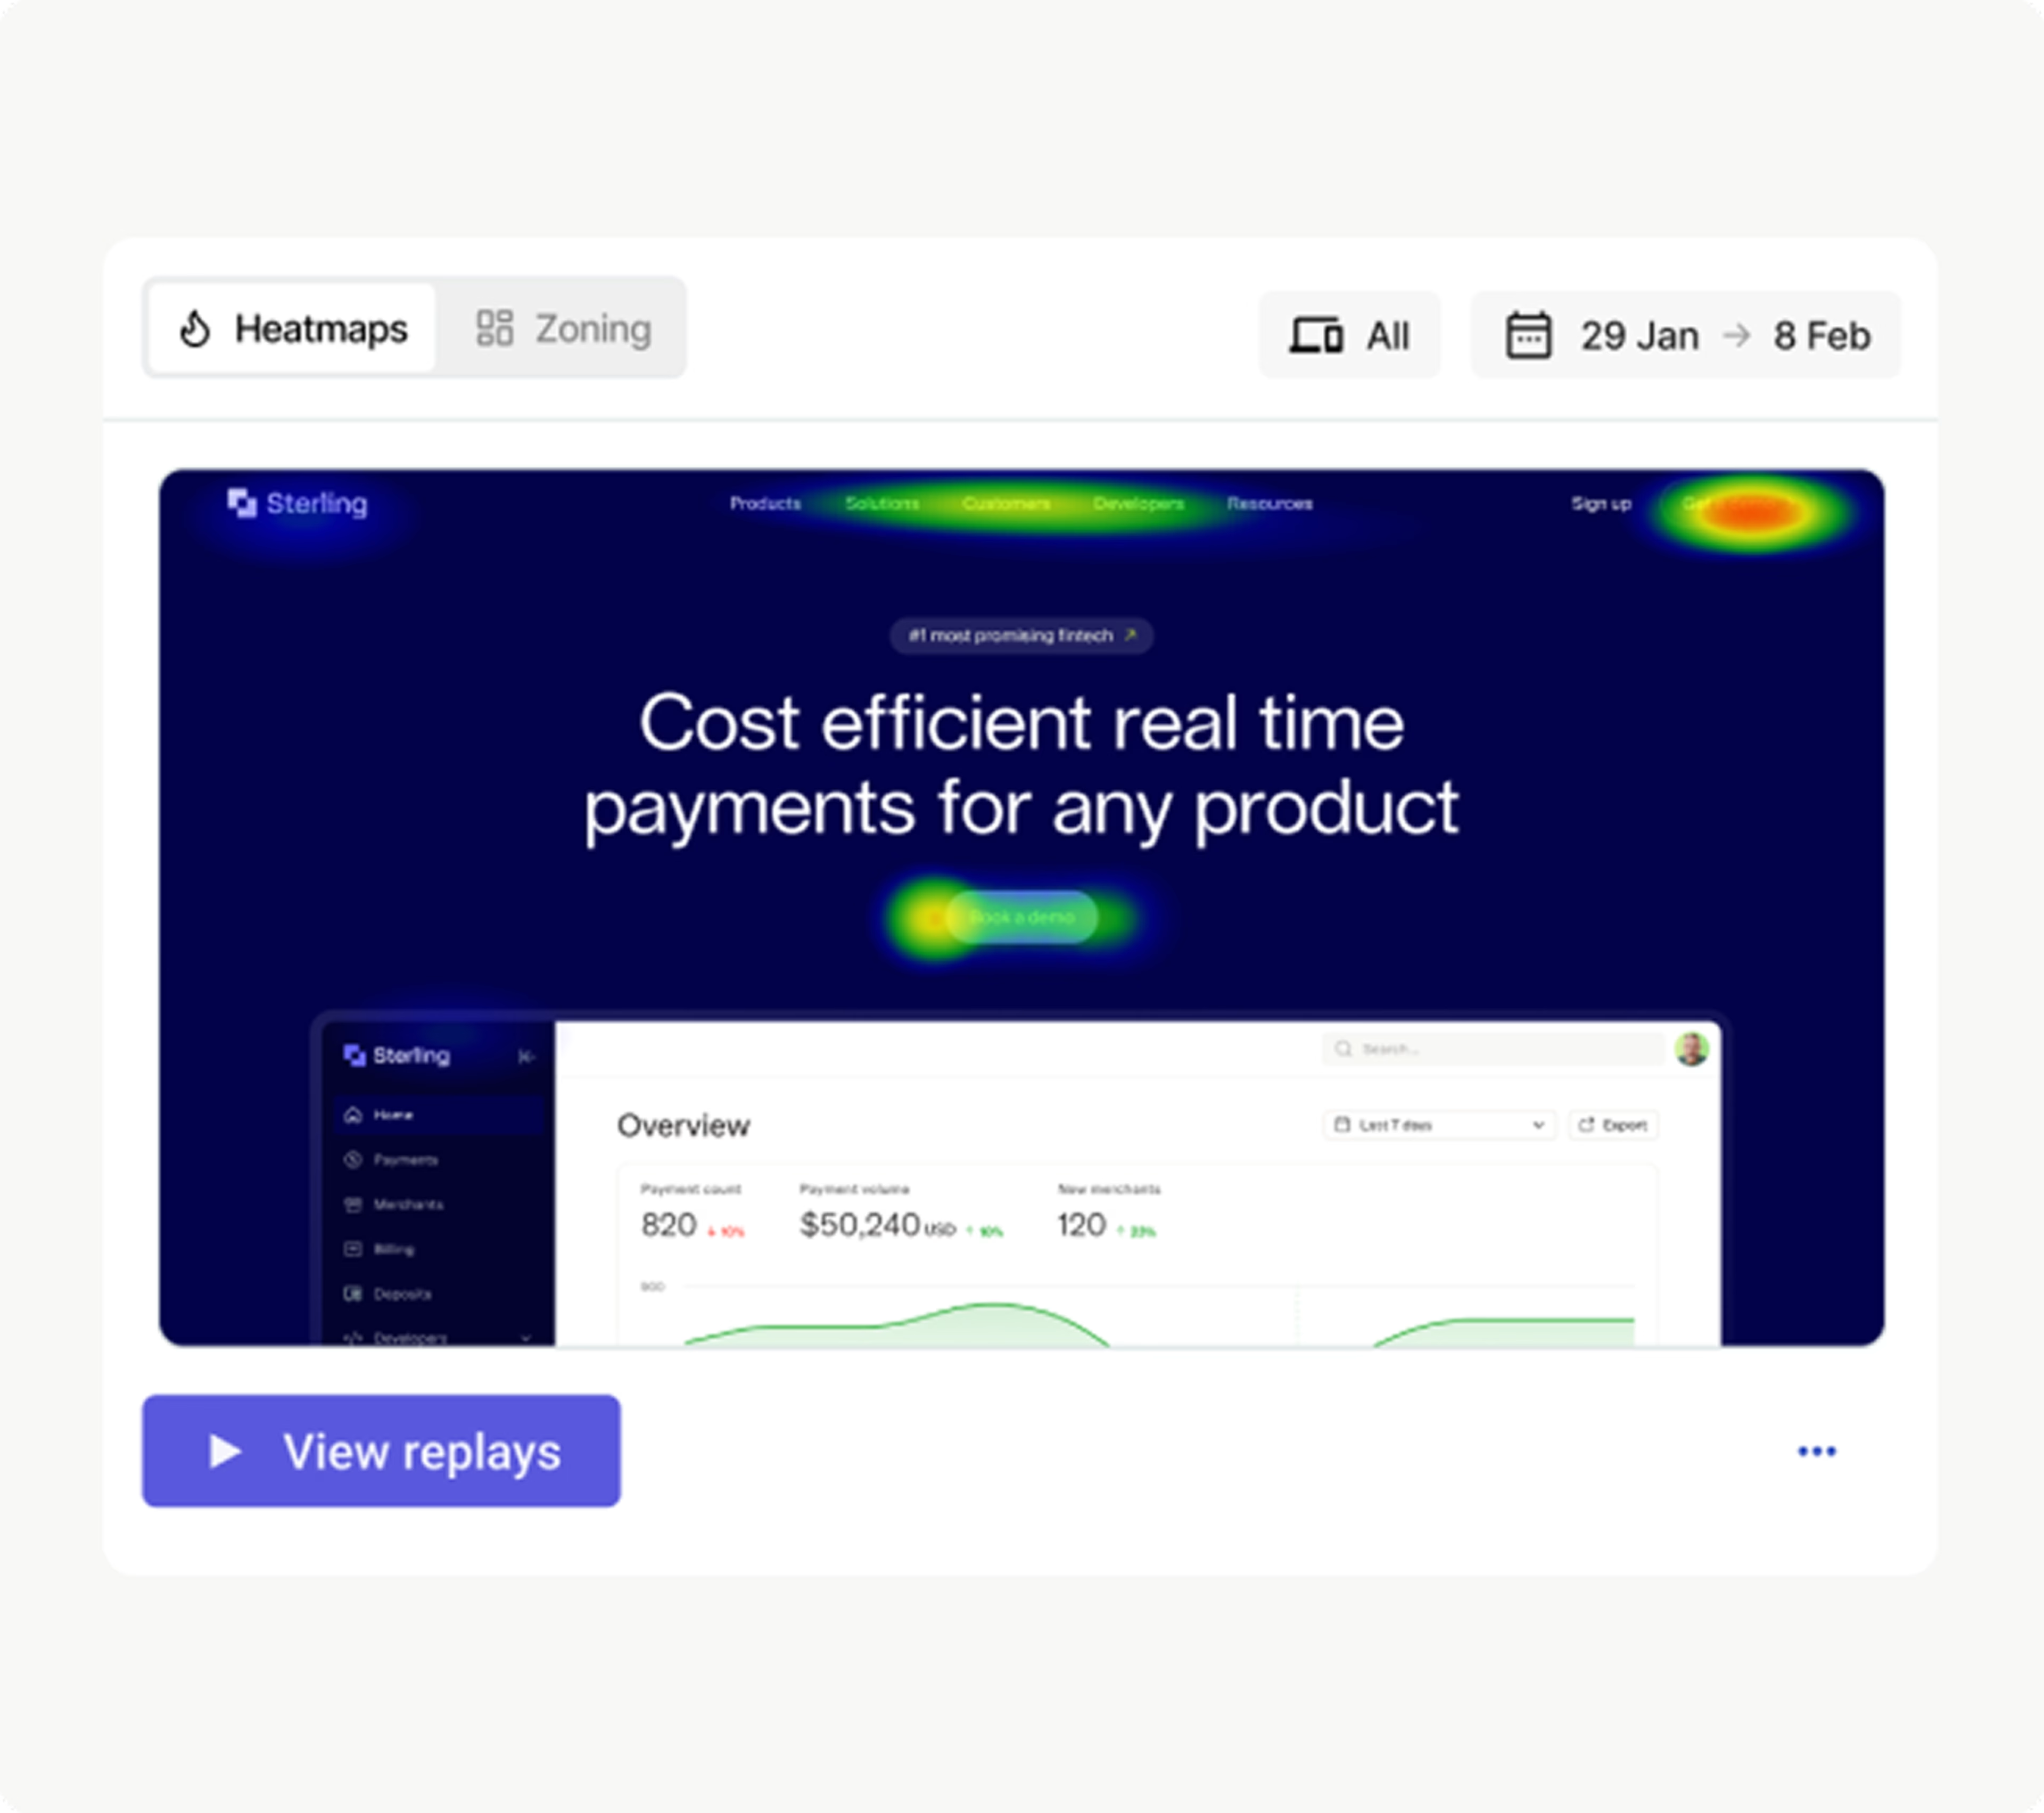
Heatmaps show you how users interact with your site at a glance.
In a typical sales demo, both Contentsquare and Quantum Metric heatmaps may look similar:
Both platforms provide live heatmaps—use the Contentsquare CS Live Chrome extension or Quantum Metric Visible to browse your site and overlay metrics with a click
Both Contentsquare’s Heatmaps and Quantum Metric’s interaction maps can show activity zones instead of single points on interaction
Both overlay business metrics like conversion rate and revenue, so you can see the link between page-level engagement and business outcomes (we call that Impact Quantification in Contentsquare)
Both offer side-by-side heatmap views for analyzing visitor behavior across segments, like A/B test variants or different traffic sources
See which elements drive revenue for any segment in Contentsquare
With Contentsquare heatmaps, teams can answer questions like
Which content blocks actually drive conversions (using metrics like hesitation time and conversion rate per hover)
Where forms lose people (drop-off rate, refill rate, and field-level engagement)
Which products and placements pay off (for example, exposure vs. add to cart vs. sales for each zone)
How behavior links to long-term value (multi-session purchase and retention metrics)
And since our heatmaps are fully integrated into the rest of the platform, you can jump straight into impact quantification, segmentation, or session replay from any zone.
That’s why enterprise brands use Contentsquare not only to fix issues, but also to improve journeys and marketing performance across channels.
For example, Audi used the Contentsquare Heatmaps tool to identify friction on product pages, leading to a +7% lift in leads.
“Without Contentsquare, we’d probably still be putting content on-site that we thought was good, without really knowing its impact or what we were optimizing for. I think now, in recent years, we’ve been led way more by insight and therefore acting on knowledge, not just assumptions.” - Jonny Evans, CRO Manager at Audi
How do we create better products, experiences, and A/B tests, besides fixing errors?
Fixing errors keeps your product running, but doesn’t tell you which features are popular, which flows confuse people, or what’s worth testing next. Product teams need to see how users move through journeys, what drives adoption and repeat use, and where they drop off between web and app.
Here’s how Contentsquare and Quantum Metric approach user journeys and product analytics differently.
Customer journey mapping
Customer journey maps illustrate all the pathways users take when browsing your site. Both Contentsquare and Quantum Metric have comprehensive journey-mapping tools:
Both platforms let you filter journeys and click through to relevant session replays for more context
Both platforms have exit/drop-off analysis analytics to surface the most common reasons people leave
Both platforms use sunburst journey maps: inner rings represent start pages, outer rings are exits, and colors represent page types (like product detail pages or category pages.)
Both platforms let you segment journeys and tie outcomes to revenue and conversions
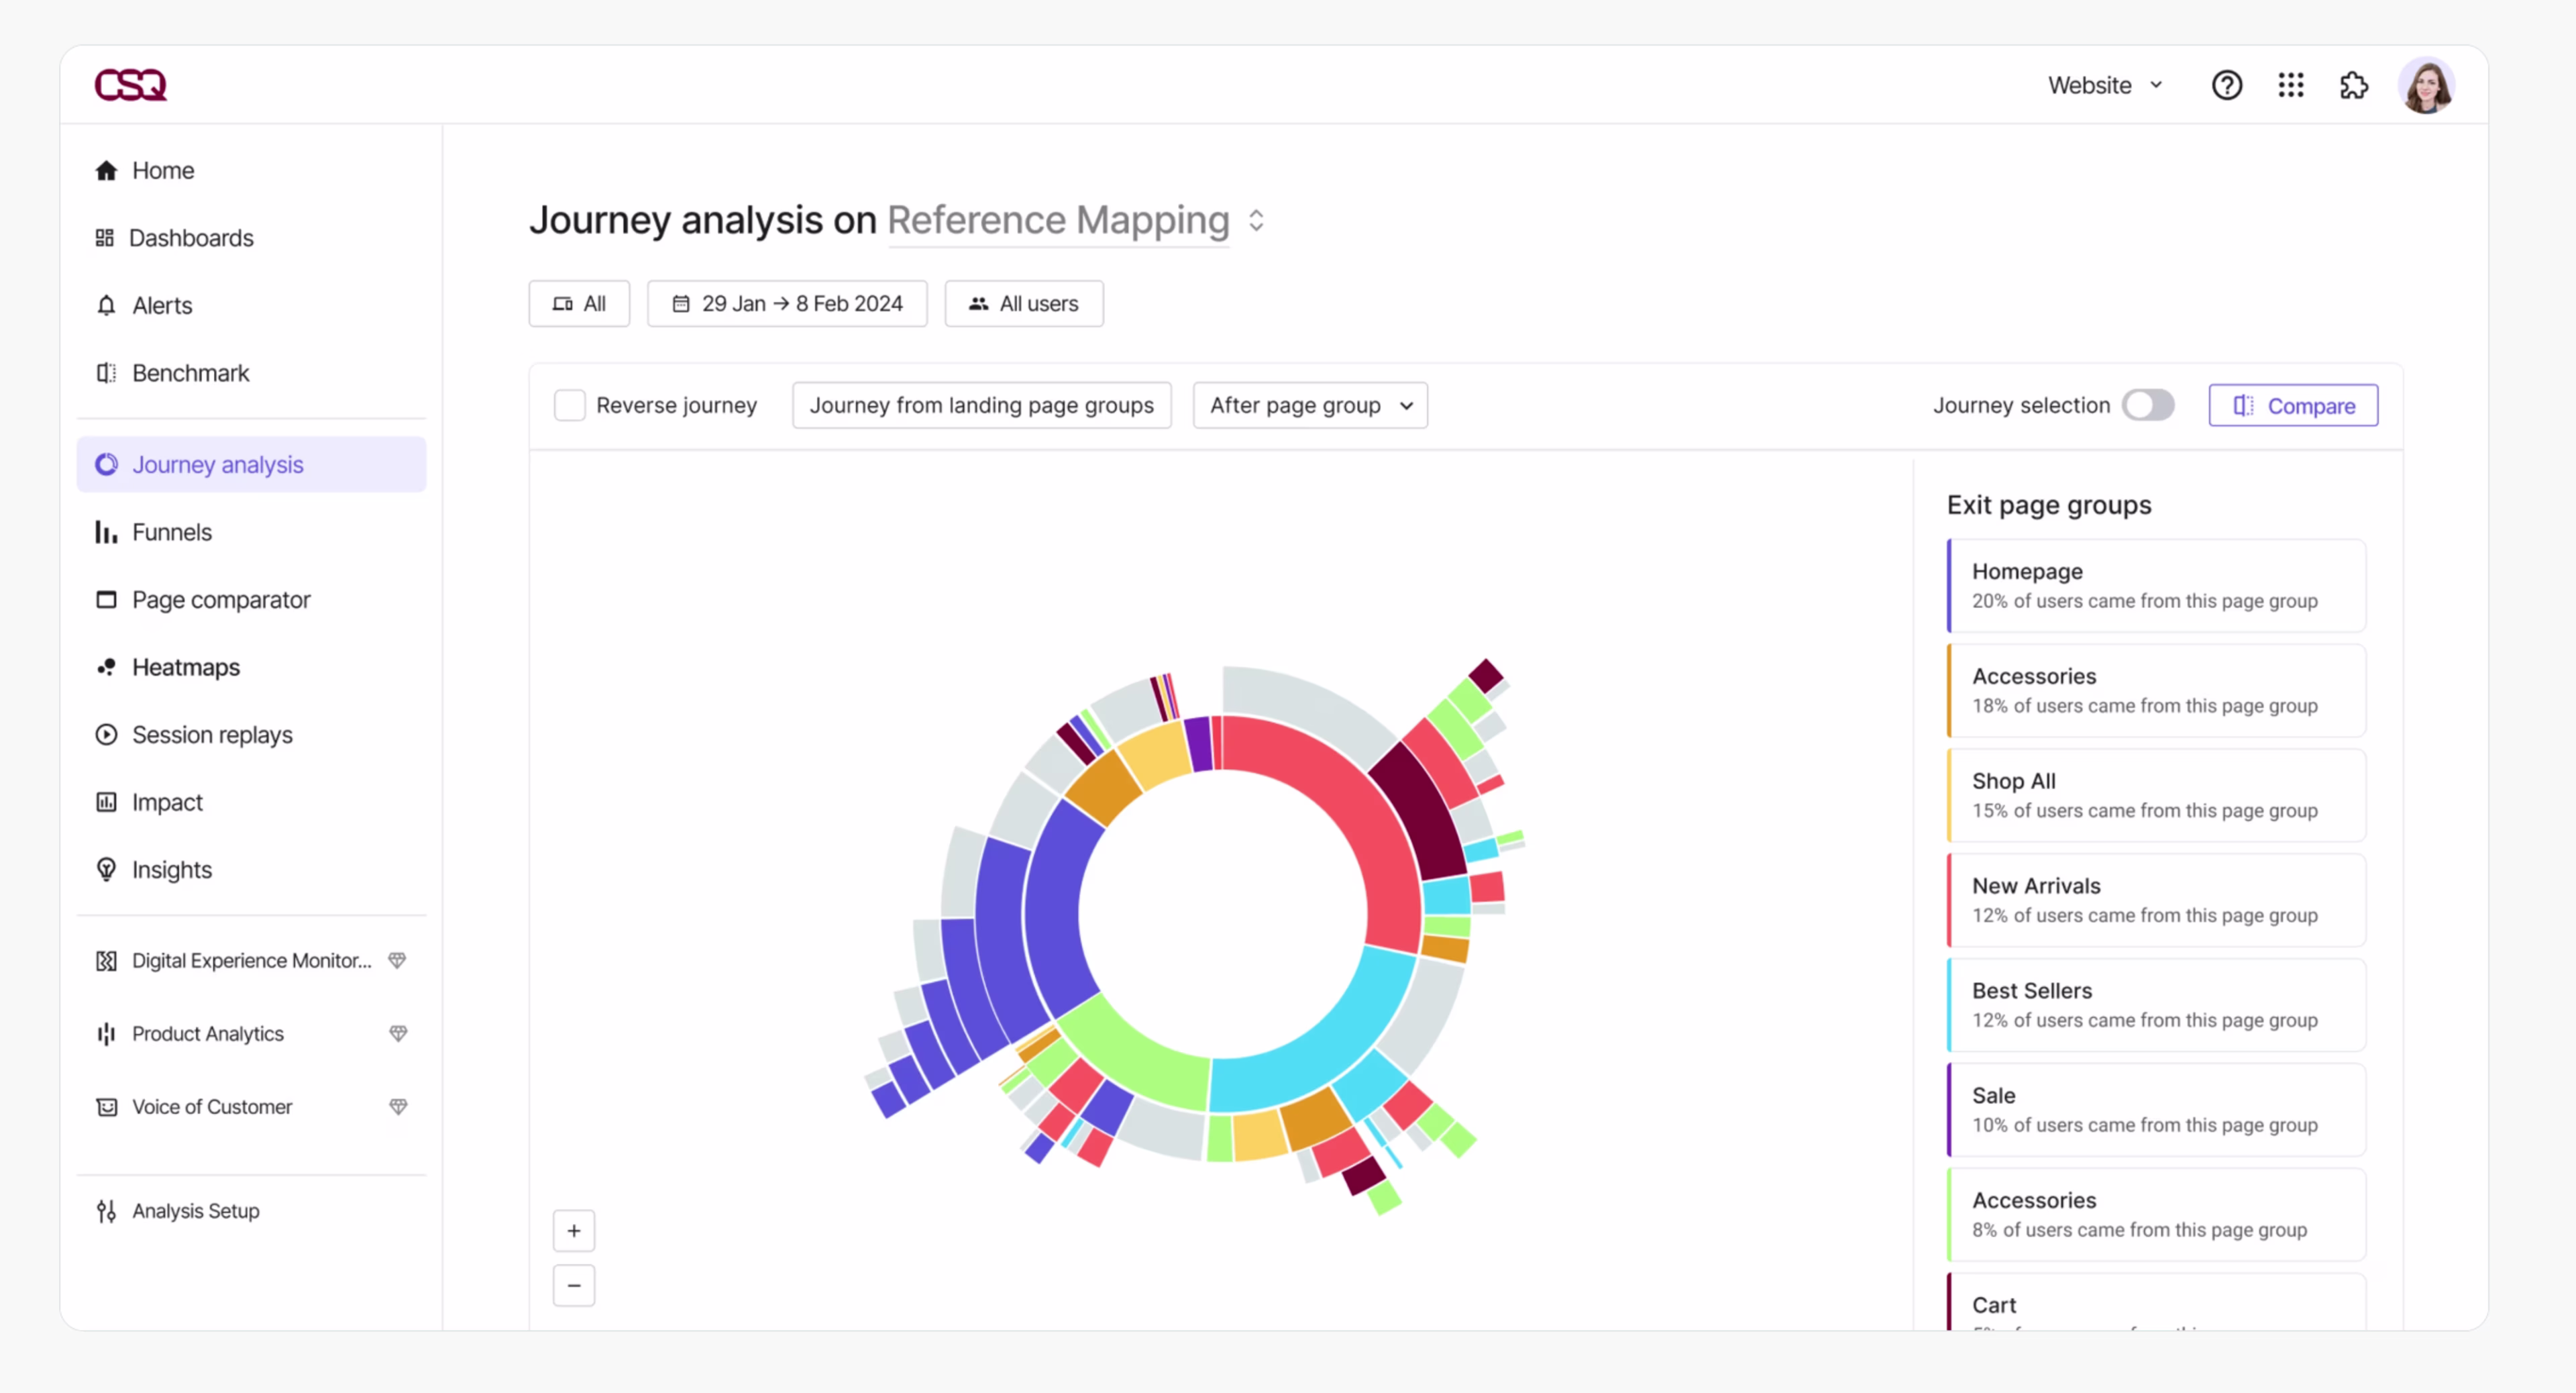
Customer journey maps in Contentsquare
But Contentsquare offers more advanced journey analysis features that make it easier to discover unexpected customer journeys:
Only Contentsquare provides side-by-side journey comparisons—use this to compare journeys at a glance, like conversions vs. bounces at a glance
Only Contentsquare has an AI mapping assistant to automatically group pages together for smarter analysis
Only Contentsquare has Sense Chat—use it to ask questions about customer journeys (like “Where do new users from paid search drop off before checkout?”), and generate the right journey map in seconds
![[Customer story] Schneider Electric - Journey Analysis image](http://images.ctfassets.net/gwbpo1m641r7/5ngnz4XhEoYAoqLxjL73G2/6cdbac46a78d3ab19930740635ac4011/ai-powered_journey_analysis.png?w=3840&q=100&fit=fill&fm=avif)
Generate journey maps in seconds with Sense AI
If you’re on the fence, let Sense AI be the deciding factor: Quantum Metric needs you to build reports, Contentsquare lets you type a question and instantly see the journeys, segments, and revenue impact that actually matter.
Product analytics
Product analytics reveal your product, website, or app performance through easy-to-understand charts and metrics. Both Contentsquare vs. Quantum Metric offer product analytics that integrate with their behavior analytics tools:
Both platforms let you create multiple, customizable product analytics dashboards for different teams and use cases, like an acquisition dashboard for marketers or a feature adoption dashboard for the product team
Both come with dashboard templates to access critical data immediately without setup delays
Both let you monitor mobile analytics for Android and iOS apps
Both platforms have retention analysis tools to focus on reducing churn
Both platforms autocapture events without tagging (in Contentsquare, we call it Smart Capture, and it’s best-in-class 🏆)
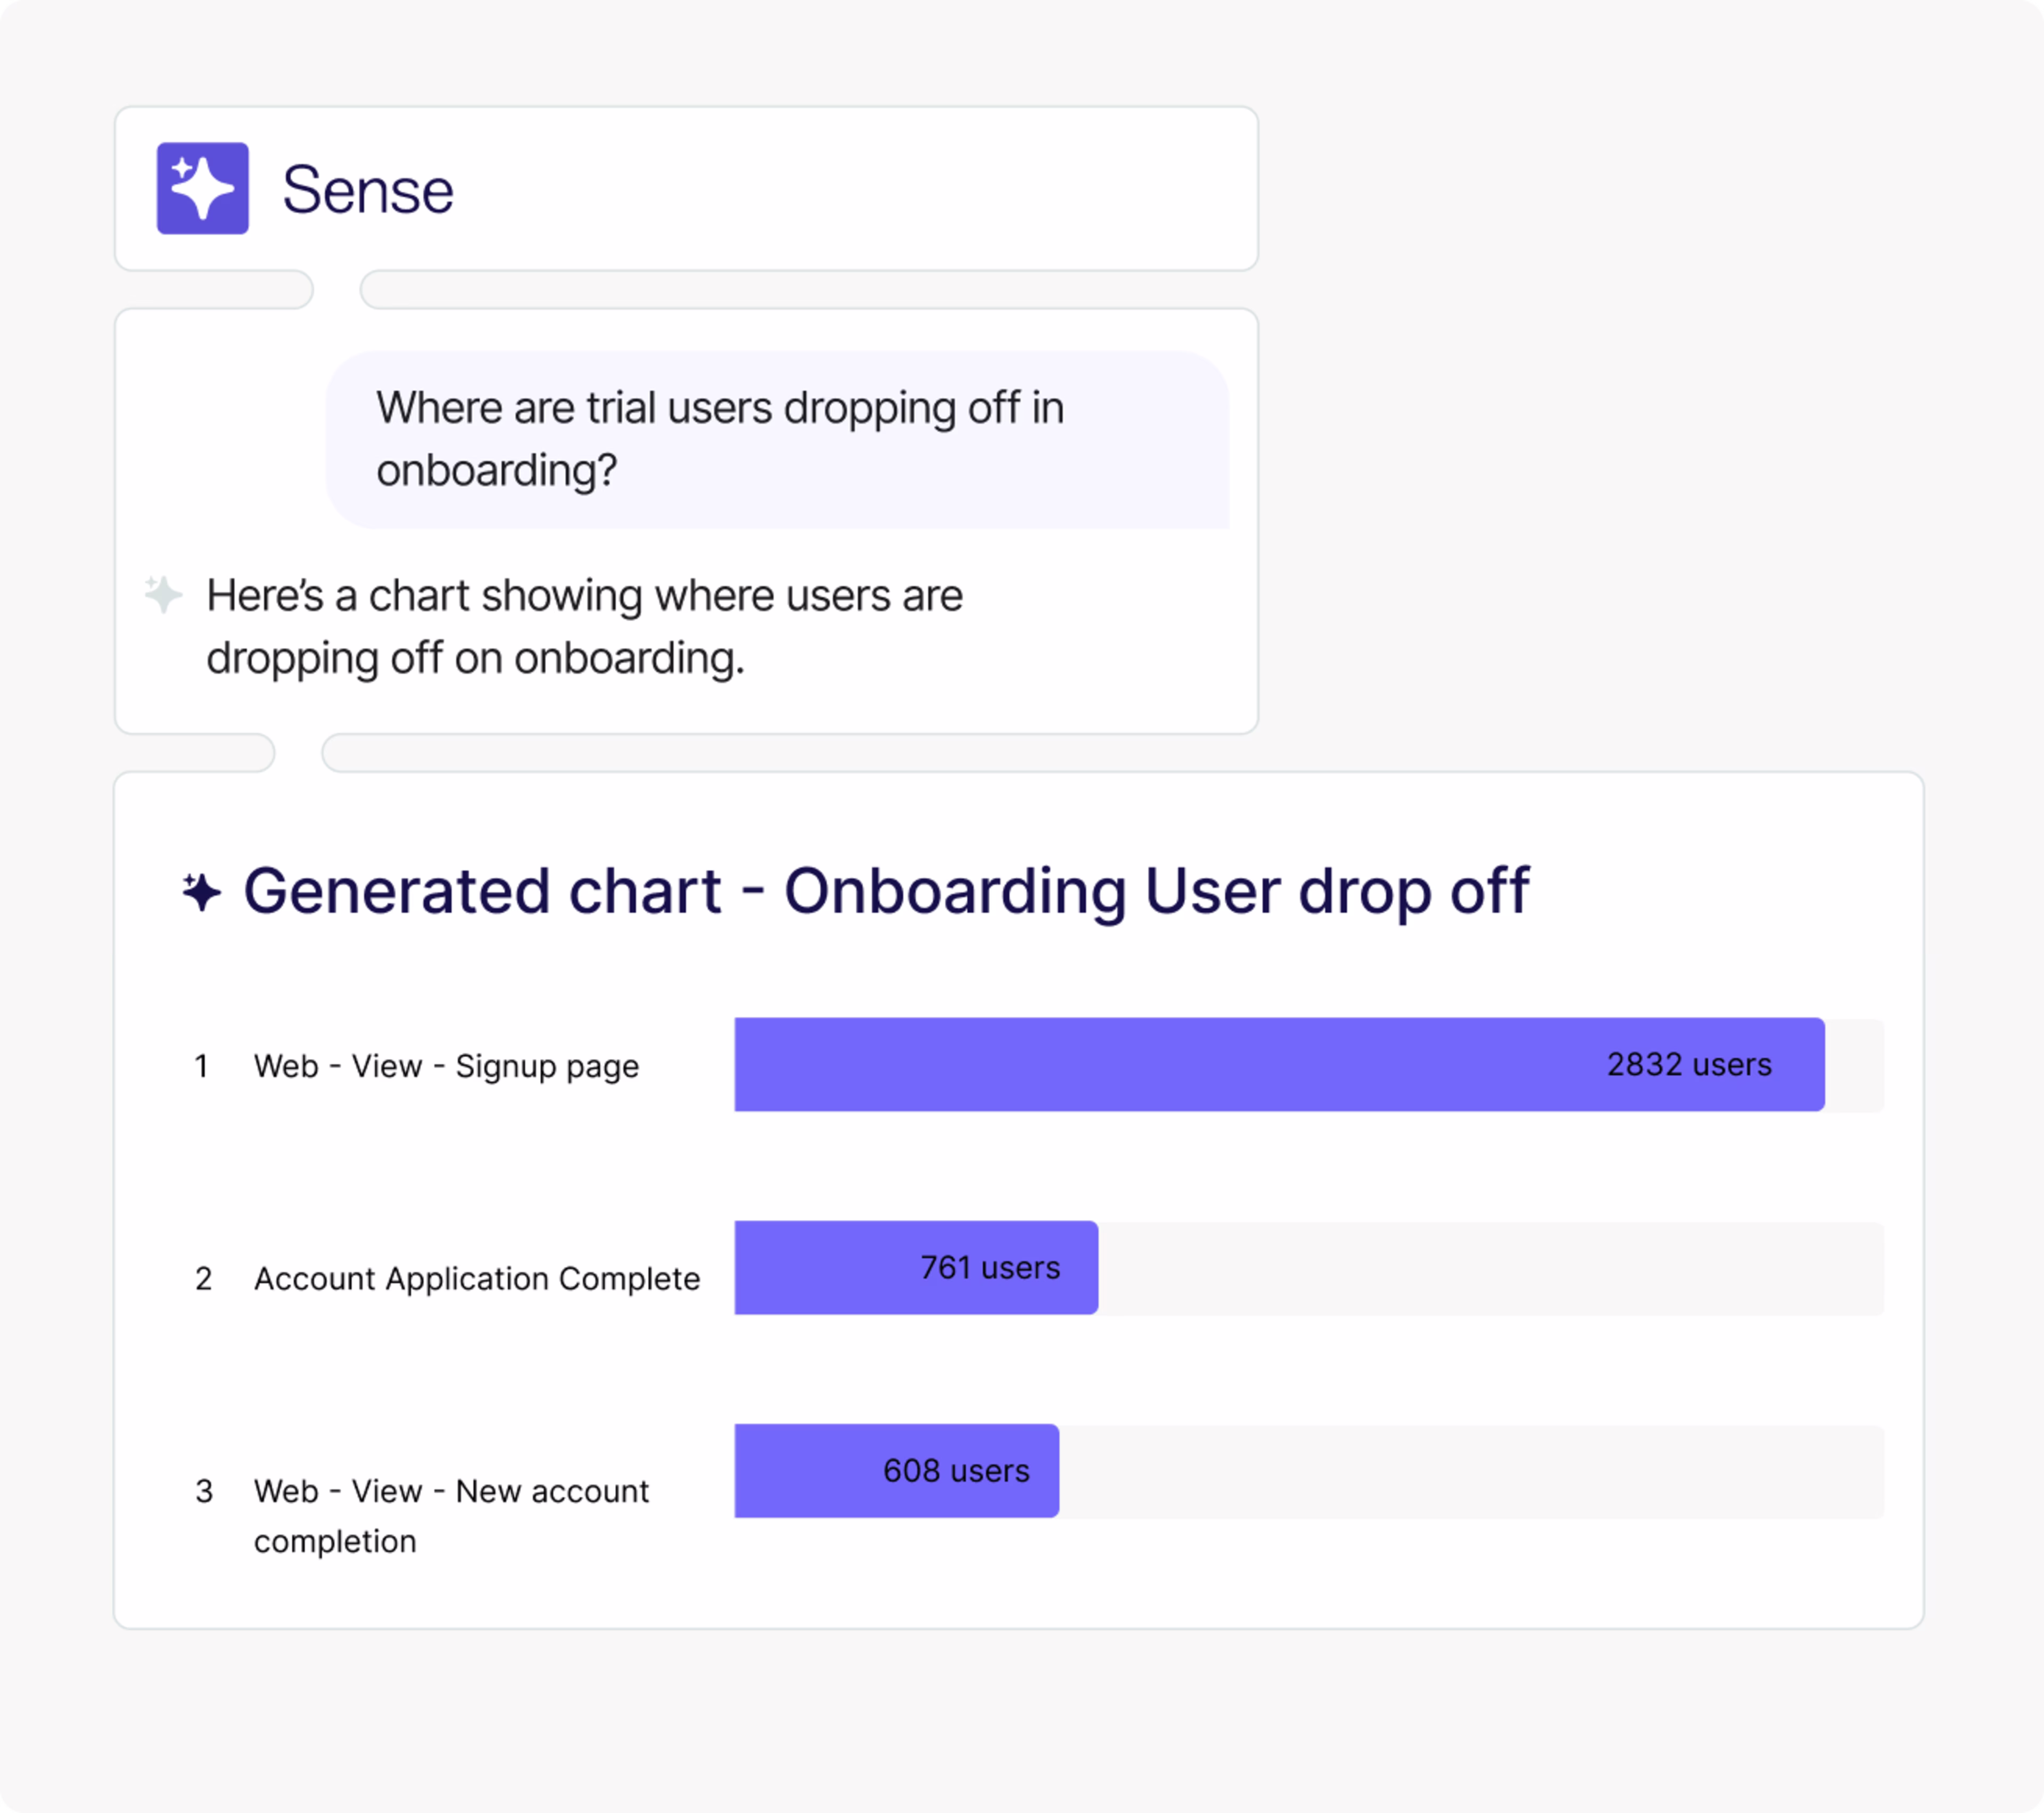
Use Sense to generate any analytics chart with simple prompts
There are, however, a couple of crucial differences:
Only Contentsquare lets you generate insights and charts by chatting with an AI Copilot in plain language (using Sense Chat)
While Quantum Metric lacks a true product analytics tool, Contentsquare Product Analytics (formerly Heap) is the market leader because we unlock insights for every digital team with autocaptured, AI-powered, self-serve insights.
How do we listen better by collecting feedback more automatically?
To truly optimize experiences, you need to take a holistic approach to quantitative and qualitative data.
While both Quantum Metric and Contentsquare help make sense of voice of customer data via integrations with third-party VoC solutions, only Contentsquare enables collecting feedback natively.
Voice of the customer tools
Voice of customer (VoC) feedback uncovers people’s thoughts as they browse. It helps you resolve issues faster by connecting with tools like session replays and error monitoring.
Quantum Metric integrates with third-party VoC tools but doesn’t provide a native VoC tool—you’ll need to integrate with other paid tools like Qualtrics or InMoment to collect and investigate feedback responses.
With Contentsquare’s all-in-one platform, you have the option to integrate or use built-in VoC tools, including
Surveys—AI-powered for any use case, like exit-intent surveys and Net Promoter Score® (NPS®) surveys
Feedback buttons—collect effortless feedback anytime with contextual screenshot capture
AI analysis—transform qualitative data into actionable metrics with AI survey reports and sentiment analysis
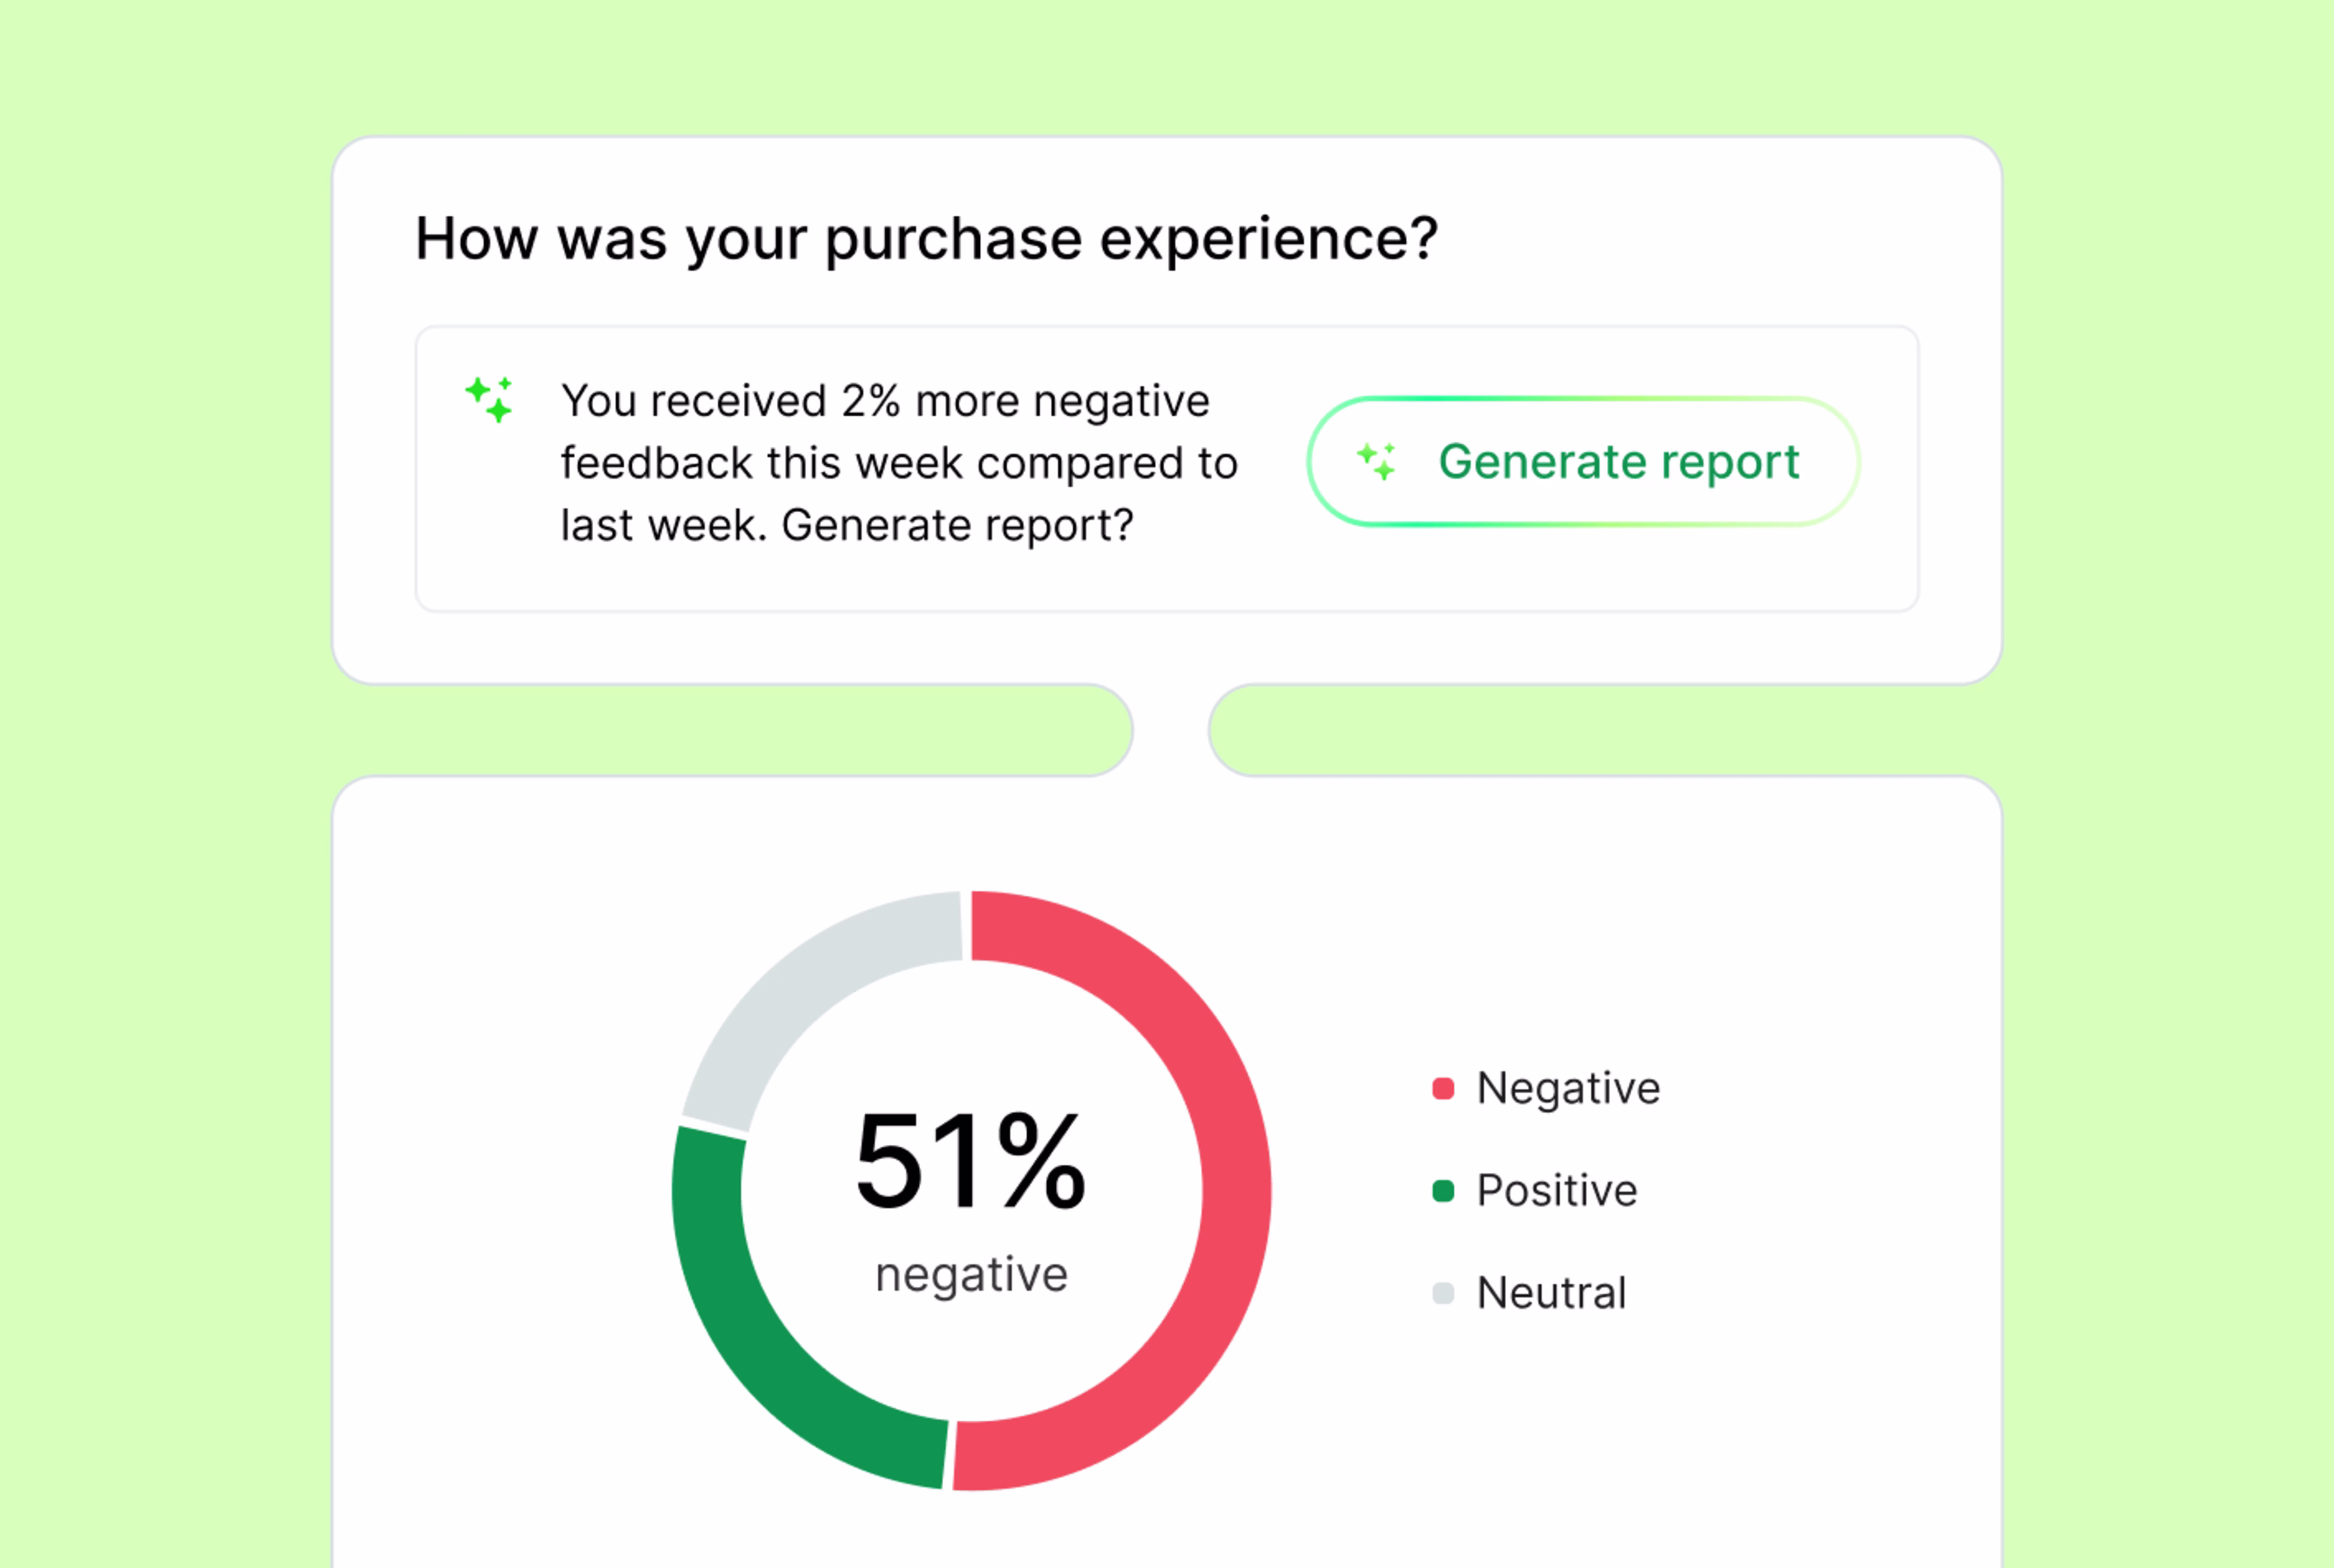

Contentsquare gives you more ways to collect and analyze VoC feedback
Plus, our feedback data doesn’t live in a silo; in one click, you can jump from any feedback response to the user’s session replay to see what happened before and after the comment was left. You can even quantify how many other users were affected and how much revenue was lost to the issue(s) they reported, even if most users didn’t fill in your survey.
How do we choose a partner that can support us locally where we are located?
Whether you’re a solopreneur or running a Fortune 100 company (foreshadowing), you need an analytics platform you can trust to meet you where you’re at.
If you’re just getting started, Contentsquare has a free forever plan and growth plans starting at €40/month.
Quantum Metric is an enterprise-only tool with custom pricing, yet Contentsquare is still the top choice for enterprise companies at scale:
We’re trusted by +30% of the Fortune Global 100, +3,700 enterprise brands, and +1.3 million websites and apps
We support all our customers worldwide from +16 global offices
We’re backed by +$1.4 billion in funding (yes, with a b) that we pour into experience analytics, AI, and product innovation so our tools (and our customers 😉) keep getting smarter every quarter
The verdict: is Contentsquare or Quantum Metric better for your team?
While they might look similar on the surface, Quantum Metric and Contentsquare serve very different use cases.
Quantum Metric might be a good fit if you’re an engineering-led team looking to connect backend and frontend performance. But you’ll lose out on Contentsquare’s unique benefits, like the best autocapture on the market and AI Sense Chat that lets everyone self-serve user and product insights.
For companies smart enough to understand that data silos cost time and revenue, Contentsquare is the best all-in-one experience intelligence platform to unify behavior, feedback, and performance data in one place and turn it into prioritized actions across teams.
Choose Contentsquare over Quantum Metric for:
Cross-functional collaboration: break down silos and empower teams across your organization to self-serve insights
Tech and non-tech users: work with intuitive visualizations and deep granular insights for technical users. Generate analytics reports with natural language interfaces.
ROI-driven strategies across the whole funnel: understand journeys at the top of the funnel and across web and apps, while also finding and fixing areas of friction at the bottom of the funnel
Ecommerce teams: leverage automated insights to boost sales
Product managers: answer questions retroactively without having to pre-plan events by benefiting from autocapture combined with the strongest data governance feature in the industry
CX, UX, and tech teams: streamline bug detection, gather customer feedback, and accelerate reporting with AI-powered alerts, summaries, and actionable recommendations
Startups: use the free forever plan to get started and scale as you grow from €40/month
Enterprise organizations: scale whole funnel insights across multiple brands, websites, and apps with robust governance and cutting-edge features (100+ patents)
Multiregional teams: get support spread over 16 countries in English, French, Spanish, Italian, German, and Japanese
In summary, Contentsquare offers a more comprehensive, technologically advanced, and user-friendly solution with superior AI capabilities, extensive integrations, comprehensive support, and a larger global presence.
Ready to see which solution fits your team best? Take the 7-minute Contentsquare product tour and discover how we turn your data into growth-driving insights.
Contentsquare vs Quantum Metric FAQs
Quantum Metric is a digital analytics platform founded in 2015 in Colorado by Mario Ciabarra and David Wang. The company has since raised over $250 million in funding and employs a team of 500+ remotely and in offices in the US, UK, Germany, and Spain.
Net Promoter®, NPS®, NPS Prism®, and the NPS-related emoticons are registered trademarks of Bain & Company, Inc., NICE Systems, Inc., and Fred Reichheld. Net Promoter ScoreSM and Net Promoter SystemSM are service marks of Bain & Company, Inc., NICE Systems, Inc., and Fred Reichheld.
![[Visual] Contentsquare's Content Team](http://images.ctfassets.net/gwbpo1m641r7/3IVEUbRzFIoC9mf5EJ2qHY/f25ccd2131dfd63f5c63b5b92cc4ba20/Copy_of_Copy_of_BLOG-icp-8117438.jpeg?w=1920&q=100&fit=fill&fm=avif)
We’re an international team of content experts and writers with a passion for all things customer experience (CX). From best practices to the hottest trends in digital, we’ve got it covered. Explore our guides to learn everything you need to know to create experiences that your customers will love. Happy reading!