The information on this page is correct as at 08/12/2025 to the best of Contentsquare's understanding.
For many teams, Google Analytics—and its latest iteration, GA4—is the default solution for seeing how people get to your site. But it’s terrible for showing you what happens when they get there. 😕
In this guide, we use real customer feedback to break down how Contentsquare stacks up against GA4. You’ll learn what they have in common as analytics solutions and how Contentsquare's AI insights, impact quantification, and behavior analytics tools fill the ‘why’ gap Google Analytics leaves in your data.
TL;DR
GA4 is the default platform for tracking traffic, channels, and high level performance, but it only shows what happened, not why users behaved that way
Contentsquare sits alongside GA4 as your experience intelligence layer, autocapturing every interaction across websites and apps, and turning it into visual insights like heatmaps, session replays, and journey analysis tied to KPIs
Contentsquare’s Product Analytics suite and User Lifecycle Extension go beyond sessions to show feature adoption, retention, and cohorts over time
Contentsquare’s built in Voice of Customer and Experience Monitoring suites let you connect feedback, frustration, errors, and speed to real journeys, while AI-powered insights and 1-click impact quantification show how much each issue or opportunity is worth in conversion and revenue
Most top brands keep GA4 for acquisition and reporting, and integrate Contentsquare to reveal the real experiences behind the numbers and visualize exactly what to optimize to drive measurable growth
What people don’t like about Google Analytics (and GA4)
Google Analytics 4 brought major changes to the GA experience—an event-based model, new engagement metrics, codeless tracking—but it’s still lacking in many ways.
And we’re not the only ones that think so.
![[visual] Popular opinions on GA4](http://images.ctfassets.net/gwbpo1m641r7/4hpzTzssTcdPyxyXzb32Uu/76c62512a26f115265bf894097fe8a0d/Google-Analytics-sentiment.png?w=1920&q=100&fit=fill&fm=avif)
Popular opinions on GA4
In theory, GA4 is a super-powerful analytics platform, but many users—especially those who loved Universal Analytics—have issues with
Manual setup: manual tagging for most event capture means you’ll have to keep looping in analysts to build relevant reports
No retroactive data: you’ll need to plan exactly what to track in advance, if you change your mind it will take months to get the data you need
Complex data interpretation: the interface can be overwhelming for non-technical users, especially now that complementary tools like Google Optimize have gone
No user behavior or feedback insights: you’ll get rows of data about what happens on your site, but no insight into why customers are behaving that way
Lack of error and frustration detection: there’s no way to monitor UX and page errors, so you’ll need to use other tools for that anyway
Sampling issues with large datasets: unless you pay for Google Analytics 360, many reports will be sampled
Luckily, there are plenty of Google Analytics alternatives that solve these challenges.
What are the main differences between Contentsquare and GA4?
Instead of jumping into a tool comparison, start from your business goals. What are your biggest business challenges? Choose the platform that’s designed to help you achieve your goals.
Here’s an overview of the main use case differences between Contentsquare and GA4 from our perspective:
Typical business goals and use cases | Contentsquare | GA4 |
|---|---|---|
How do we improve marketing acquisition? | Very Strong | Very Strong |
How do we create better products and drive user adoption and growth? | Very Strong | Strong, but limited due to typical data gaps |
How do we improve experiences, content engagement, and conversion? | Very Strong | Very light |
How do we surface obstacles and prioritize what to fix based on revenue impact? | Very Strong | - |
How do we create happier customers by collecting their feedback and making sense of it? | Medium | - |
Part of a larger platform | 115+ integrations with best of breed providers | Very Strong, e.g. Google Marketing Platform, Big Query, Gemini, Firebase |
Use cases that both Contentsquare and GA4 do well
While most teams use GA4 alongside Contentsquare (more on that later), there’s still plenty of overlap in what they do well, especially around core analytics basics like traffic, funnels, and journeys.
Here’s what you can achieve with either platform:
Improve marketing acquisition
For marketers working on acquisition challenges, both GA4 and Contentsquare cover the basics. You can
Track traffic, sessions, and conversions by channel and campaign (so you see which acquisition efforts perform best)
Build funnels and journeys to understand where users drop off across key steps
Create segments and cohorts to compare behavior for different user groups over time
Monitor core KPIs like conversion rate, revenue, and engagement in dashboards
The difference is what happens next. GA4 stays focused on reporting what happened. Contentsquare adds the experience layer that shows why it happened and what you need to optimize to see growth.
![[visual] Acquisition analysis in Contentsquare](http://images.ctfassets.net/gwbpo1m641r7/1C7LrEYFHRYGLw1DDaGLz5/532437b6f638add945f13243dcaa542f/Acquisition-analysis-in-Contentsquare-vs-GA4.png?w=3840&q=100&fit=fill&fm=avif)
Acquisition analysis in Contentsquare
Because we autocapture every event, our web analytics capabilities give you deep insight into your marketing acquisition channels, so you can easily see which campaigns drive meaningful revenue.
Unlike GA4 (and other alternatives, like Matomo), we give you better ways to visualize and make sense of your traffic data, no technical knowledge required.
For example, you can use Sense AI, our AI analyst, to ask a question, like “How do my marketing channels perform in terms of engagement?” and get the data you need in seconds.
![[Blog] AI In Banking - Chat with Sense shot](http://images.ctfassets.net/gwbpo1m641r7/6vkcLRGf7UEsf6QS0WzbjI/9fda4ac515008dd532c23c85184767e1/Journey_analysis_-_Exitanalysis.png?w=3840&q=100&fit=fill&fm=avif)
Chat with your data using Sense AI
And because Contentsquare is more than just traffic-focused like GA4, you’re already in the right place to visualize user journeys, optimize content, and increase conversions.
Contentsquare A/B testing integrations
While both Contentsquare and GA4 integrate with leading A/B testing platforms (like AB Tasty, Optimizely, and VWO), only Contentsquare lets you visualize why a variant won.
Use Contentsquare alongside your favorite A/B testing tool to
Identify high-impact test ideas based on real behavior and friction patterns
Visualize how each variant changes clicks, engagement, and revenue with side-by-side zoning heatmaps and journeys
Understand exactly why variants won or lost, then roll those learnings into your next campaigns and landing page designs
![[Visual] ab test heatmaps](http://images.ctfassets.net/gwbpo1m641r7/71Feljv3nwR0ng3PEiPGEG/c5c4f991ef679e660e08970edb2a894a/ab_test_heatmaps.png?w=3840&q=100&fit=fill&fm=avif)
Visualize the outcome of A/B test variants with side-by-side heatmaps in Contentsquare
How leading brands use Contentsquare alongside GA4
Most top brands don’t use Contentsquare as a Google Analytics alternative. They keep GA4 for traffic and attribution, and layer Contentsquare on top as their experience intelligence platform that explains why users behave the way they do, where journeys break, and what to fix first to drive more revenue.
For example, marketing automation platform Klaviyo kept Google Analytics for top-level performance metrics, but added Contentsquare Product Analytics to analyze every in-product event retroactively and tie it to source, campaign, and lead quality.
By enriching behavioral data with Salesforce and A/B testing integrations inside Contentsquare, Klaviyo’s marketing team could see which channels and experiments produced the most engaged, highest-value customers, leading to 3x more conversions on key pages.
Using GA4 Audiences and Events in Contentsquare
If you rely on Google’s ad products to drive traffic, importing GA4 Audiences into Contentsquare connects your acquisition efforts with real customer behavior.
By integrating GA4 Audiences in Contentsquare, you can
Filter heatmaps, journeys, and session replays by any GA4 Audience (like cart abandoners or high-value customers)
See how each segment behaves after the click, which content they engage with, and where they drop off
Spot experience issues and patterns that are specific to certain campaigns or audience groups
Feed those insights back into Google Ads and the wider Google Marketing Platform to refine targeting and creatives
![[visual] Import and selecting a GA4 Audience to filter any report in Contentsquare](http://images.ctfassets.net/gwbpo1m641r7/27U2VjkdvTEBFqIMMQz5b7/54601b2b06620fd3ad1138ba4ae9a114/Import_and_selecting_a_GA4_Audience_to_filter_any_report_in_Contentsquare_.png?w=1080&q=100&fit=fill&fm=avif)
Import and selecting a GA4 Audience to filter any report in Contentsquare
💡 Pro tip: you can also bring GA4 events into Contentsquare via our integration, making it easy to add our experience layer to your existing GA data.
What Contentsquare does better than GA4 (and why it matters)
There are plenty of use cases where Contentsquare provides advantages and additional tools above and beyond GA4.
Here are some examples, based on the use cases we covered in the comparison table earlier:
How do we create better products and drive user adoption and growth?
Both Contentsquare Product Analytics and GA4 are market leaders for web, app, and product analytics capabilities. You can use either one to
Track sign-ups and product usage
Measure onboarding and feature engagement
Stitch user behaviors across sessions and devices
Track retention and run cohort analysis
Create custom product analytics dashboards for different teams with templates for common use cases
Measure the success of SaaS products and ecommerce stores
The biggest difference between Contentsquare Product Analytics and GA4 is the set-up, i.e. data capture.
Contentsquare has refined its autocapture capabilities for websites and mobile apps with over 10 years of R&D investment. Today, it is the most widely used autocapture solution for web and app analytics in the industry.
Our autocapture (we call it Smart Capture) is market-proven to provide cost and time savings for gathering a more complete picture of in-page interactions so that teams can answer everyday questions at lower cost and effort:
No need to plan what click events to track in advance: we automatically capture all in-page clicks, taps, and field interactions
No need to loop engineering in every time there’s a change: unburden engineering to focus on their own scope
Flexibility to ask new questions of historical data: retroactive data means anyone can go back and troubleshoot or analyze any data point at any time
Reduced risk of missing critical data needed for answering questions: never worry about forgetting to track a specific event. A more complete data set means better and faster answers to questions.
Lower total cost of ownership: save on the tremendous amount of effort and cost that you spend on traditional analytics for manual tagging
Save on the extra fees: some analytics tools increase their prices when you increase the number of events you tag
![[visual] ga4 Manual tracking in G4 vs. smart capture in Contentsquare](http://images.ctfassets.net/gwbpo1m641r7/78PiDmkF2kN2cdu8IdBbXU/dd507f4868603a9fa5620630c84e36f9/GA4-alternative-with-autocapture.png?w=1920&q=100&fit=fill&fm=avif)
Manual tracking vs. autocapture
In a nutshell, autocapture saves time, money, reduces technical debt, and ensures you always have the data you need to make informed decisions. And it works right out of the box.
“Google Analytics was just excruciating. I couldn’t think of all the questions I needed to answer up front. [With Heap, now Contentsquare Product Analytics], immediately after implementation, we found answers to questions we thought would take a month to answer with Google Analytics.” – Alan Winters, VP of Product at Grow.c
How do we improve experiences, content engagement, and conversion?
GA4 can tell you which pages get traffic and where users drop off, but it can’t show what people actually did on those pages or which elements drove conversions.
That’s why marketers and content teams add Contentsquare Experience Analytics to GA4, for its unique set of immersive visual insights:
The Zone-Based Heatmaps tool shows you exactly which elements are driving conversions and revenue, for example, on the home page or product pages—use them to make a case for changes, demonstrate the success of an experiment, and compare side-by-side segment behavior
Live browsing heatmaps enable you to overlay metrics directly over your website with just a click—use the CS Live Chrome extension to visualize how people interact within your website pages in real time
Sunburst journey maps visualize customer journeys in a way that’s more helpful to discover unexpected behaviors. They display a top-down view of your user flow through the entire website or app at a glance. Similar pages are grouped into page types to reduce the noise. They even let you compare journeys side by side, for example, to surface the differences in journeys for users who complete their journeys vs. those who don’t
By combining visual analytics and traditional charts, Contentsquare gives you ways to understand why users abandon their journeys and and which A/B test changes are most likely to improve results.
![[Customer story]](http://images.ctfassets.net/gwbpo1m641r7/1EBVc3VNWgha5ZRmeTHz1n/fb310c67dc08d024572322b469277415/segmentation.webp?w=1920&q=100&fit=fill&fm=avif)
Visualize customer journeys better with Contentsquare’s sunburst journey maps
How do we surface obstacles and prioritize what to fix based on revenue impact?
GA4 can show you when performance metrics drop, but it can’t tell you which experience issues caused the change or how much revenue is lost to specific errors and friction in the journey.
Contentsquare automatically detects journey friction (and opportunities) and quantifies impact on conversion and revenue so teams always know what to fix first.
Here’s how we do it:
Technical error analytics and resolution
With Contentsquare, all teams can identify and resolve technical issues in the context of real user journeys.
You can:
Replay sessions to see exactly what users experienced on your site or app when an issue occurred
Combine error monitoring + session replays on web and mobile to automatically detect errors, then jump straight into the most relevant sessions to see what users did before, during, and after the issue
![[Visual] API Error](http://images.ctfassets.net/gwbpo1m641r7/4fpTzbSPxtQvud8Fy3lRVR/8671529d1e6dcbddfe68f779b8dffbc2/Screenshot_2024-11-04_at_22.18.53.png?w=3840&q=100&fit=fill&fm=avif)
Example of a session replay with Error Analysis and Impact Quantification in Contentsquare
Save time with AI features like automatic Frustration Scoring and replay summaries to find sessions that are most likely to be insightful
Let support teams replay sessions linked to tickets so they can see exactly what happened from the customer’s perspective
Enable engineers to see the full waterfall of network details behind every replay so they can understand what led to bugs and fix them quickly
Use retroactive text search to instantly find every session where a specific error message or UI text appeared and jump straight into those journeys to see how often it happens and what users experienced
Get customizable real-time error alerts and dashboards that rally your team around critical issues
Make it easy to file tickets via Jira or rally teams to action via Slack and Microsoft Teams
Reduce friction with AI-powered insights: Sense automatically finds friction points (and ranks by impact) in real time, so you can fix issues before frustration sets in
Quantify the impact of any error or behavior pattern to see how many users were affected and how much conversion and revenue were lost
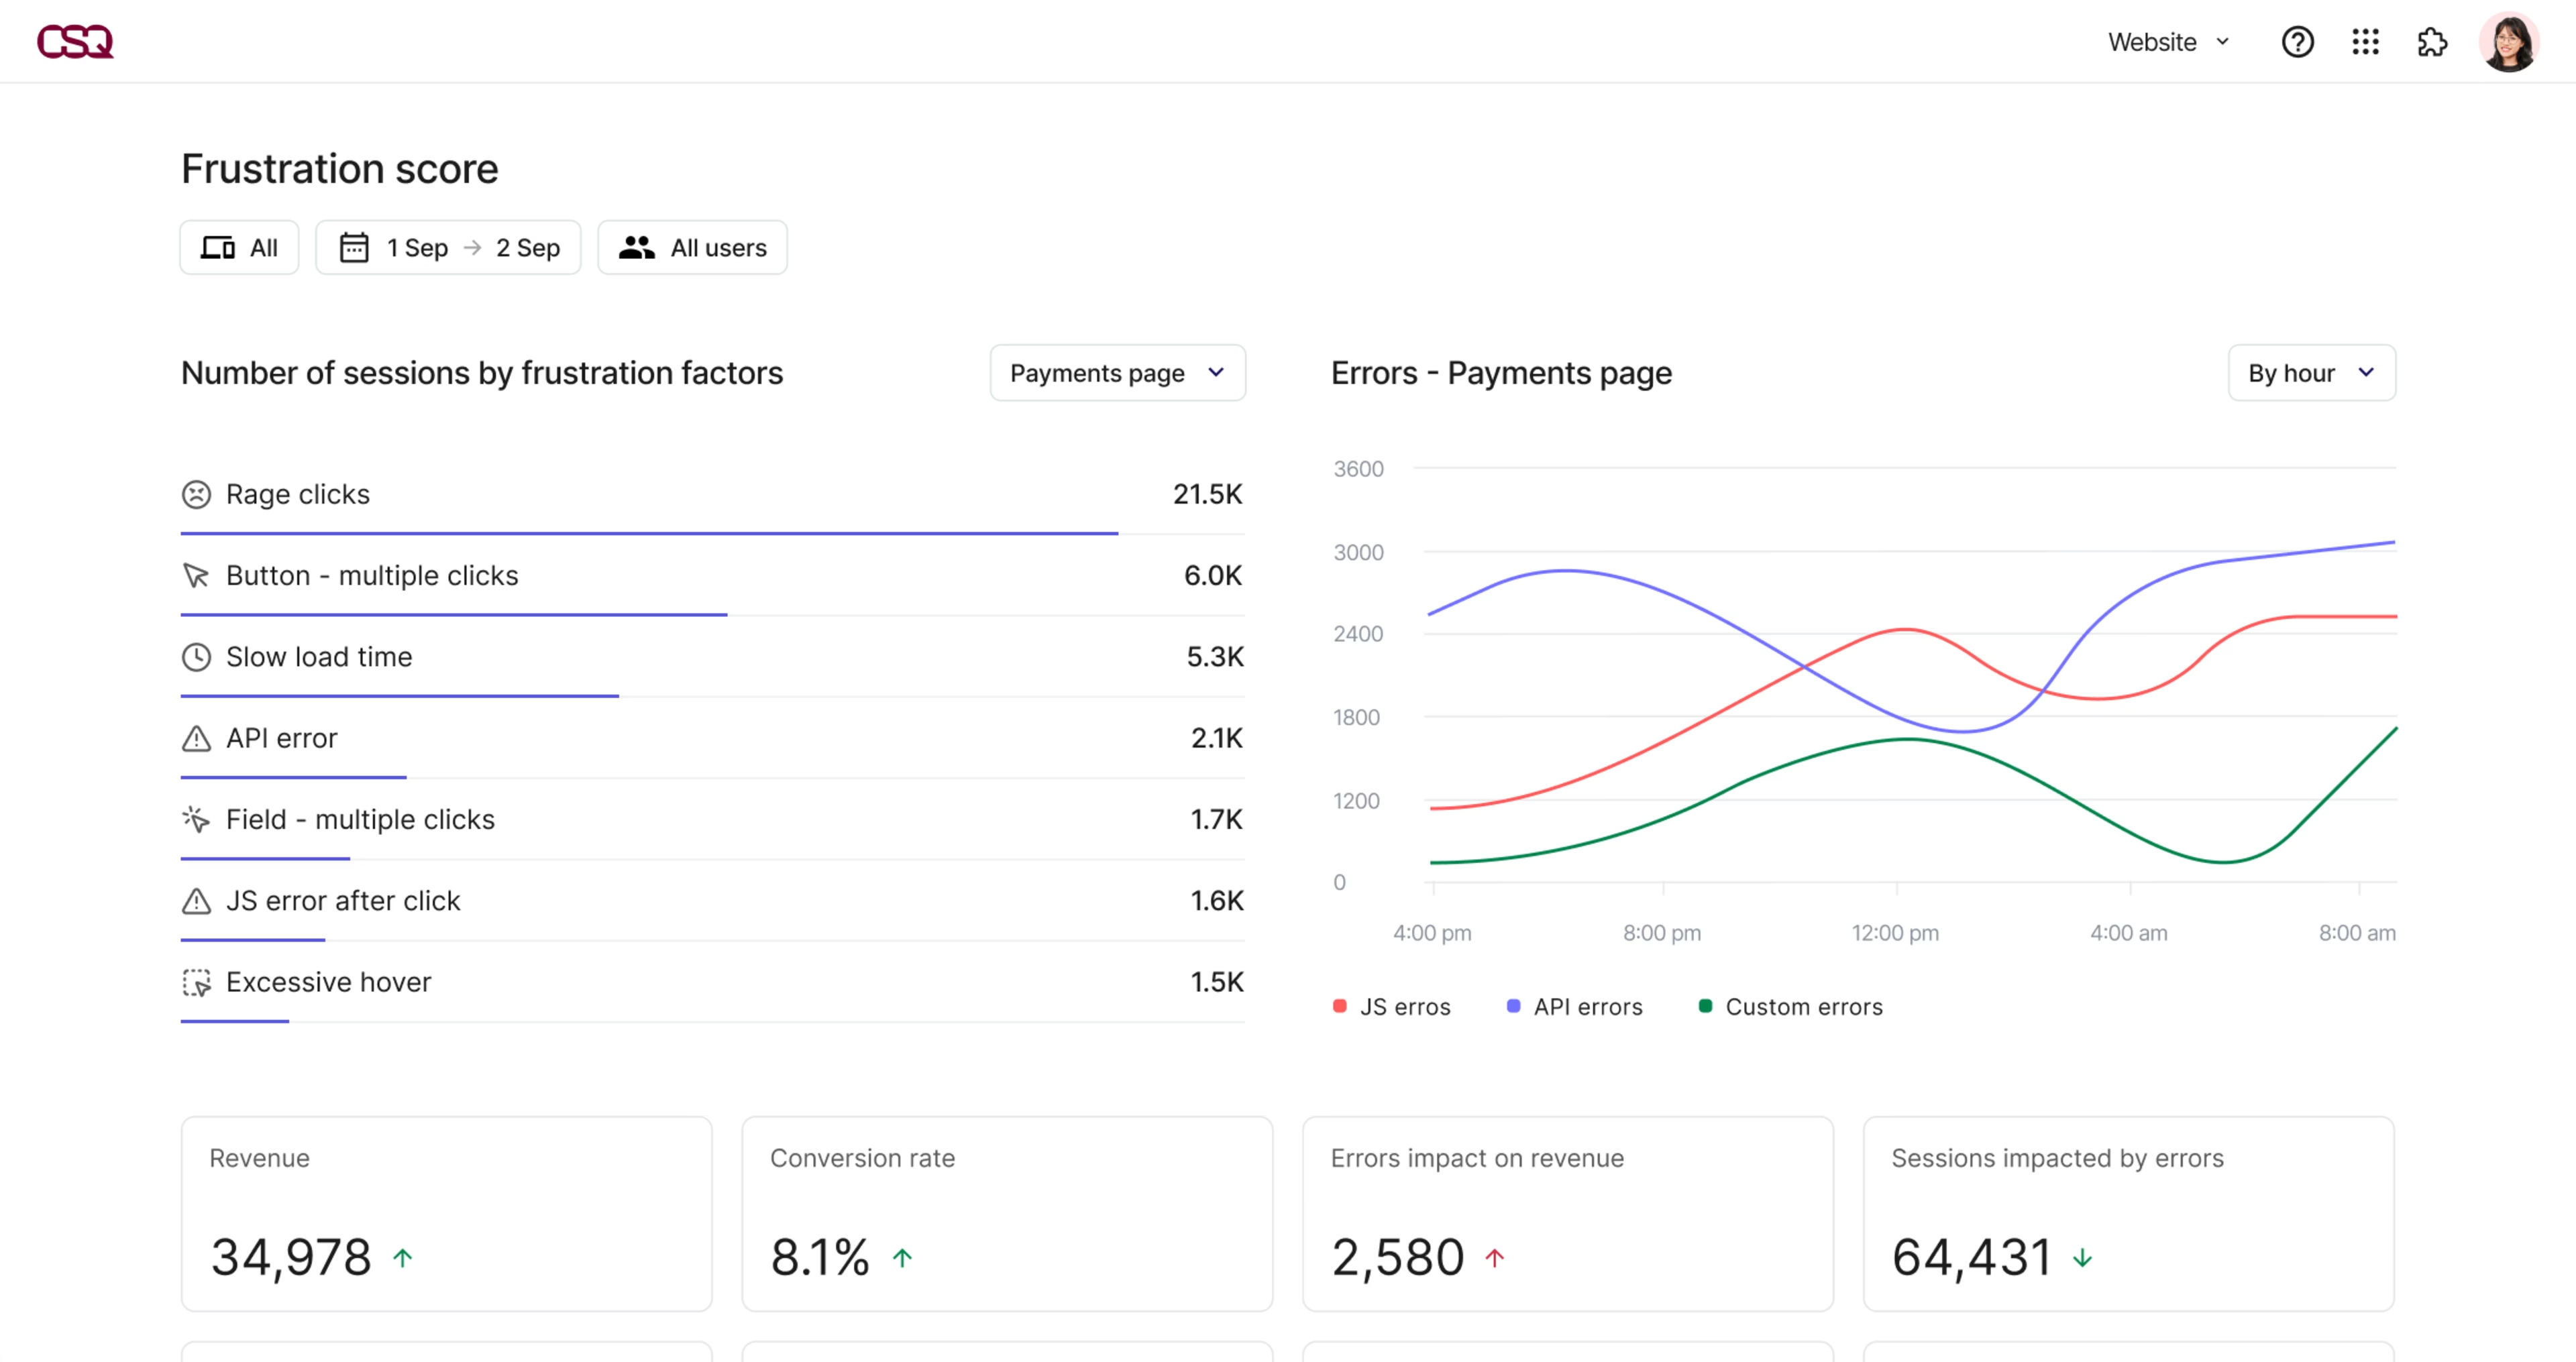
Save time focusing on high-impact optimizations with Contentsquare’s AI-powered insights from features like Frustration Score
While GA4 only shows that performance dropped, Contentsquare shows which specific errors and frustration patterns caused the biggest issues in terms of revenue and conversion impact.
![[Visual] error analysis](http://images.ctfassets.net/gwbpo1m641r7/2RHGIcGhjdzYE7tMVVWzzg/2bc7b35d22f6b8a0806a09a23f6f7c71/error_analysis.avif?w=3840&q=100&fit=fill&fm=avif)
Error Analysis in Contentsquare issues ranked by missed revenue
Speed analysis
Google tools like Lighthouse and PageSpeed Insights show synthetic speed scores, but they don’t reveal how real users are affected or what it means for conversion.
Contentsquare uses real user monitoring (RUM) to show how fast or slow experiences are for actual visitors across devices, locations, and connection types
You can then quantify how slower experiences affect conversion and revenue, so you can decide whether heavy content or extra scripts are worth the trade off or need to be removed or reworked
Contentsquare also includes synthetic monitoring (Speed Analysis) tools. Teams use these alongside Google tools to
Test experiences from different fixed geographic locations
Test experiences at regular intervals
Test critical journeys, like checkout completion
![[Visual] csq funnel travel](http://images.ctfassets.net/gwbpo1m641r7/1ClUfxpJZfUVc7OZNo3JR0/2b9e130b6b598f11d0dbf6604da3e5ed/csq.svg?w=3840&q=100&fit=fill)
Synthetic speed monitoring in Contentsquare
UX problems
Journeys still break even when everything is technically working perfectly (annoying, we know!). You need behavioral signals that go beyond simple click data.
In Contentsquare, you can visualize UX friction patterns such as
Clicks on non-clickable content where users expect something to work
Recurring or rage clicks that signal confusion or frustration
Clicks leading to errors
Repeated form field interactions that show users struggling to complete a step
Automated form analysis with metrics such as drop rates, refill rates, and blank rates
Voice of customer data linked to replay, so you can watch sessions from users who rated their experience poorly and see what led to the feedback
Side-by-side journey analysis to compare paths for happy users versus frustrated ones
Combined with Impact Quantification, these UX signals show which issues are just minor annoyances and which ones quietly cost significant conversion and revenue—something GA4 alone can never reveal.
How do we create happier customers by collecting feedback and listening better?
Voice of customer (VoC) feedback gives you direct access to what’s going on in the minds of your most important business asset—your customers.
VoC tools empower teams across the organization to make data-driven decisions:
Marketers can refine campaigns based on customer sentiment
Product teams can prioritize features that resonate with users
Customer support can address common pain points
Executives can gauge overall satisfaction and loyalty
All this leads to improved customer experiences and increased business growth.
Google doesn’t provide a native VoC tool—you’ll need to integrate with other paid tools like Survicate or Sprig to collect feedback responses and connect them to your quantitative data.
With Contentsquare, you have the option to integrate or use our built-in VoC tools, including
Surveys: AI-powered for any use case like exit-intent surveys and Net Promoter Score® (NPS®) surveys
Feedback buttons: collect effortless feedback anytime with contextual screenshot capture
Intelligent analysis: transform qualitative data into actionable metrics with AI survey results and sentiment analysis
For Contentsquare customers, the focus is on the ability to make sense of feedback at scale with the help of
Session replay: replay experiences leading up to feedback
Segmentation: compare the behaviors of users that rated experiences highly vs. poorly
Root cause analysis: combine voice of customer feedback with experience analytics to reveal why users are running into frustrations. For example, whether it’s due to slow speeds, technical errors, UX confusion, or all of the above
Impact quantification from feedback: zoom out from any single piece of feedback to quantify how many other users ran into the same frustrations (even if they didn’t leave feedback), and what was the impact on conversion and revenue
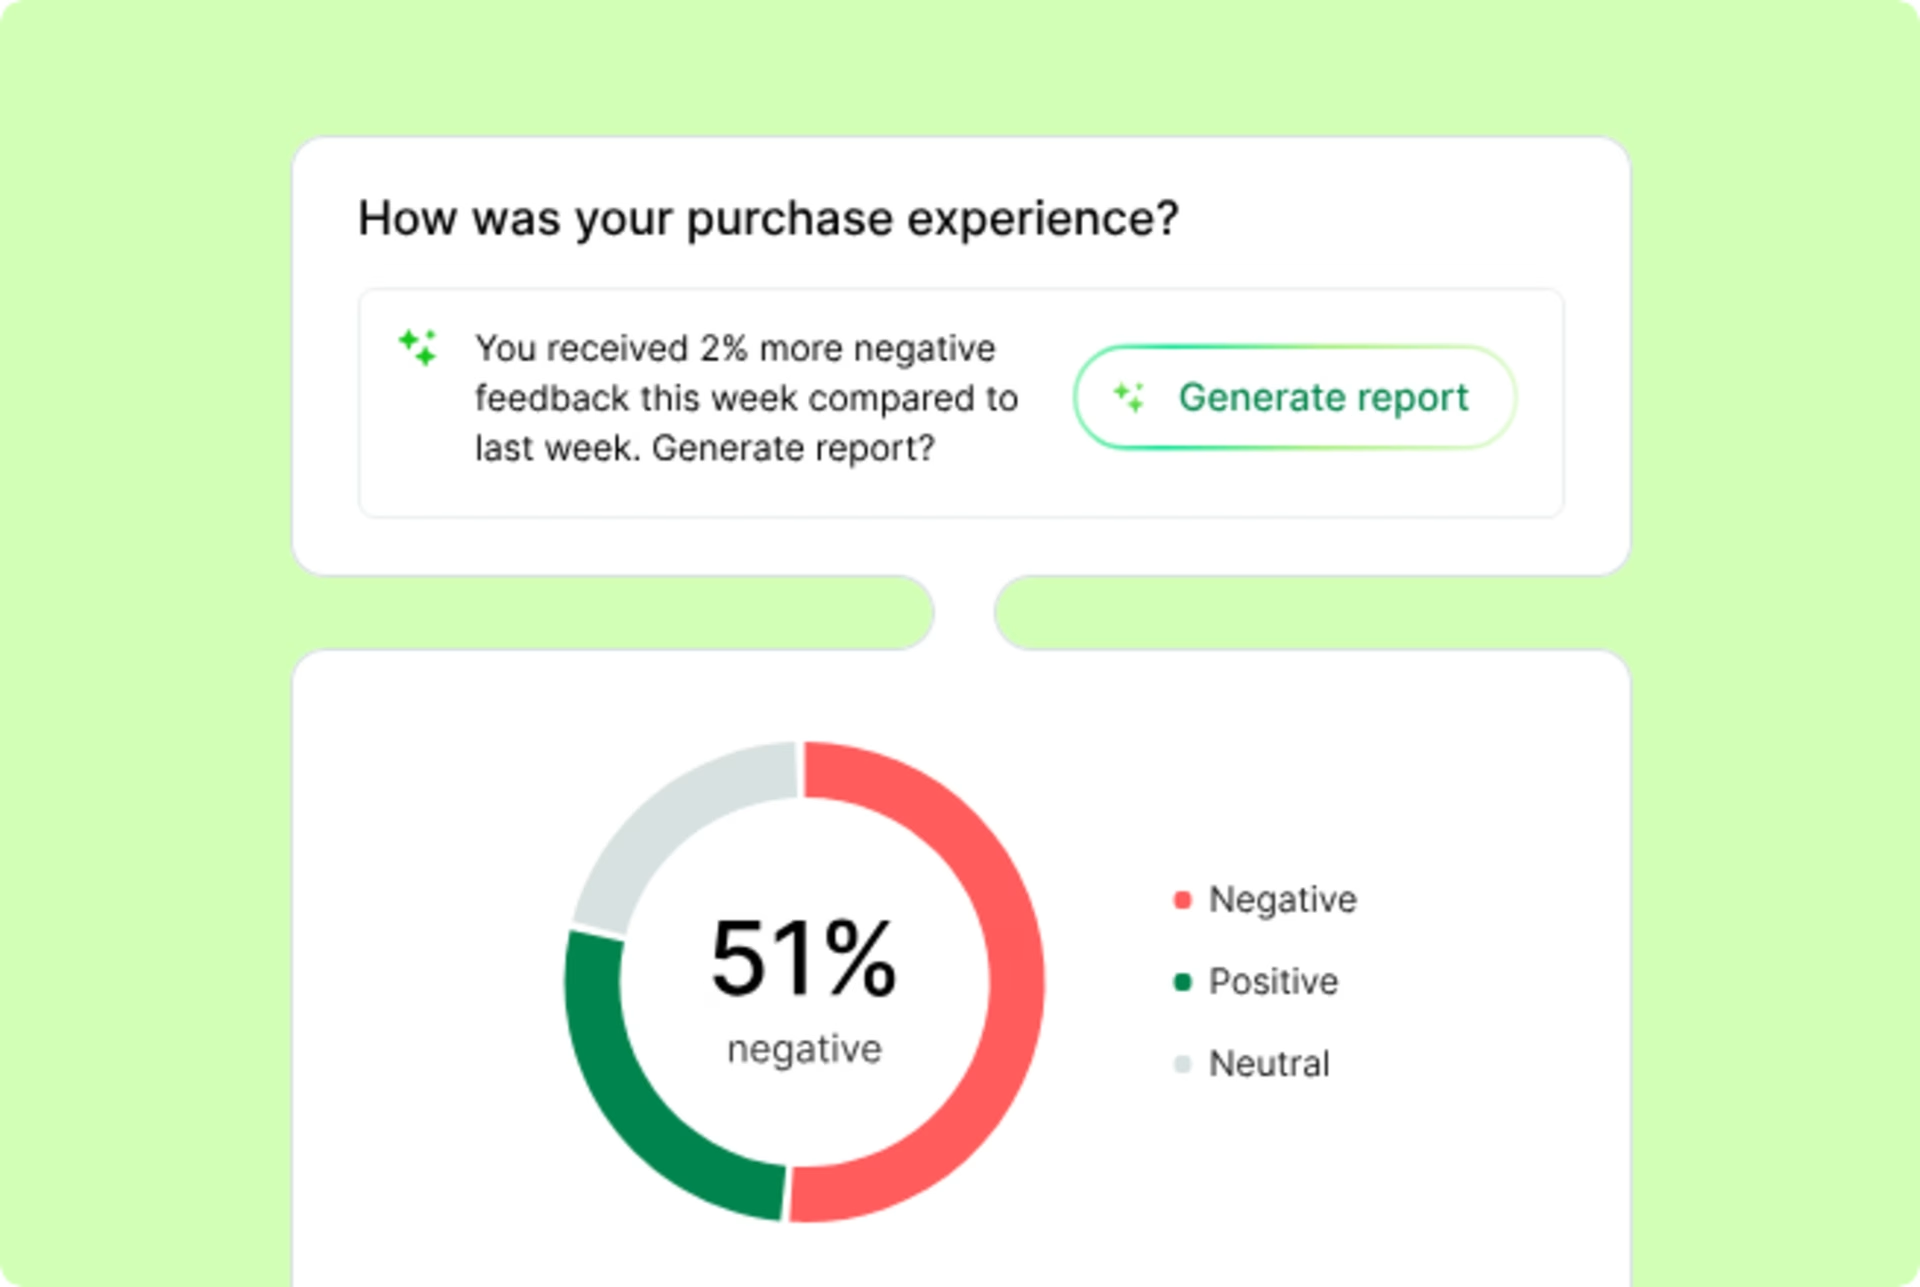
Contentsquare gives you more ways to collect, analyze, and get value from VoC feedback, powered by Sense AI
Is Contentsquare or GA4 better for your team?
GA4 is not going anywhere. Even with the messy shift away from Universal Analytics, GA is still the default way to track traffic, channels, and top-level performance, especially if you’re already invested in the Google ecosystem.
For most teams, the question isn’t about ‘GA4 vs. Contentsquare’, it’s: is Google Analytics enough to give us a competitive advantage?
GA4 might be good enough if you only need to know how much traffic you get, where it comes from, and which campaigns convert.
But it can never tell you why conversions dropped, what users actually did before they bounced, which issues are costing the most revenue, or how features are adopted across the lifecycle.
Contentsquare sits alongside GA4 as your experience intelligence layer. We autocapture every interaction across web and app, bringing user behavior, product analytics, the voice of the customer, and monitoring into one platform, and use AI and impact quantification to fast-track your insights and ensure you’re always focused on the most valuable optimizations.
And it’s not just our opinion: leading brands including Klaviyo, StoneX, and Co-op Food use Google Analytics and Contentsquare together to understand real experiences, prioritize their roadmap, and grow revenue.
Ready to see exactly how we do it? Take the 7-minute Contentsquare product tour and see how we go beyond GA4’s basic analytics to show what’s really blocking conversions and what to fix first.
Contentsquare vs GA4 FAQs
Google Analytics (GA), Google’s web analytics service, first launched in 2005 following the company’s acquisition of web statistics software, Urchin. In 2011, Google launched Google Analytics Premium, which became Google Analytics 360 (GA360) in 2016, offering enterprise-level analytics.
GA4 is the 4th and latest version of Google Analytics. Earlier versions include Universal Analytics, available between 2013 and 2023. Free GA4 users have reporting, data, and export limits compared to enterprise GA360 users.
Net Promoter®, NPS®, NPS Prism®, and the NPS-related emoticons are registered trademarks of Bain & Company, Inc., NICE Systems, Inc., and Fred Reichheld. Net Promoter ScoreSM and Net Promoter SystemSM are service marks of Bain & Company, Inc., NICE Systems, Inc., and Fred Reichheld.
![[Visual] Contentsquare's Content Team](http://images.ctfassets.net/gwbpo1m641r7/3IVEUbRzFIoC9mf5EJ2qHY/f25ccd2131dfd63f5c63b5b92cc4ba20/Copy_of_Copy_of_BLOG-icp-8117438.jpeg?w=1920&q=100&fit=fill&fm=avif)
We’re an international team of content experts and writers with a passion for all things customer experience (CX). From best practices to the hottest trends in digital, we’ve got it covered. Explore our guides to learn everything you need to know to create experiences that your customers will love. Happy reading!