![[Visual][Blog] contentsquare vs datadog](http://images.ctfassets.net/gwbpo1m641r7/2Ho4bBWBPH721f9sGefCR4/810af6f4645ea3748b1cd5b6555b911e/contentsquare-vs-datadog.png?w=3840&q=100&fit=fill&fm=avif)
The information on this page is correct as at 12/01/2026 to the best of Contentsquare's understanding.
Datadog is a powerful tool for monitoring technical reliability, performance, and security. But reliable systems don’t automatically create great digital experiences—or drive revenue growth.
Contentsquare (that’s us, hello! 👋) focuses on what Datadog doesn’t measure: how real users experience your site or app, where they struggle, and how those experiences impact conversion, retention, and revenue.
Used together, Datadog and Contentsquare give teams a complete picture. Datadog shows what’s happening inside your infrastructure. Contentsquare shows how those issues affect users on the front end—and what it’s costing the business.
In this guide, we break down how Datadog and Contentsquare complement each other, where each platform is strongest, and why teams that care about both reliability and growth rely on both.
TL;DR
Datadog is a technical monitoring platform, giving engineering teams deep visibility into errors, performance, and system health across complex environments
Contentsquare is an AI-first experience intelligence platform, combines Experience Monitoring, Experience Analytics, Product Analytics, Voice of Customer (VoC), and Conversation Intelligence to show every digital team what’s working, what’s broken, and what actions to take to grow revenue.
On its own, Datadog stops at the technical layer, making it hard to understand how issues affect real users, journeys, or revenue
Contentsquare fills the experience and growth gaps, connecting performance issues to user behavior, friction, conversion, and revenue impact across the full digital journey
Many leading companies integrate Contentsquare and Datadog to prioritize what to fix—and how—based on business impact
Contentsquare is used by all teams across the organization, not just devs
Contentsquare focuses on proactively increasing revenue, not just fixing bugs
Contentsquare quantifies the revenue impact of issues, helping prioritize fixes
Using Datadog and Contentsquare together can lead to significantly higher revenue gains compared to focusing solely on technical issues
Contentsquare vs. Datadog: what are the main differences?
Most teams start by comparing feature lists. A smarter approach is to look at the problems you’re trying to solve and which teams need those answers.
Here’s a Contentsquare vs. Datadog comparison chart that assesses both in terms of their impact on your goals.
Typical business goals and use cases | Datadog | |
|---|---|---|
How do we surface obstacles and technical issues? | Very Strong | Very Strong |
How do we prioritize what to fix based on revenue impact? | Very Strong | Light |
How do we improve content experiences and engagement? | Very Strong | Medium |
How do we create better products and drive user adoption and growth? | Very Strong | Light |
How do we improve marketing acquisition? | Very Strong | - |
How do we create happier customers by collecting their feedback and making sense of it? | Medium | - |
Shared use cases that Contentsquare and Datadog both address
Both Datadog and Contentsquare surface issues that affect digital experiences, but they do so from different perspectives. Datadog focuses on system health and reliability, while Contentsquare focuses on how those issues affect real users and revenue.
Use case 1: Surfacing obstacles and prioritizing what to fix based on revenue impact
Obstacles like slow page loads, JavaScript errors, confusing navigation, and frustrating checkout flows cause potential customers to abandon your site or app, directly impacting your bottom line. Datadog and Contentsquare surface and prioritize these obstacles in different ways.
However, on its own, Datadog isn’t designed to show how these issues translate into user frustration or revenue loss.
Error and speed analytics
Datadog excels at error and speed analytics for modern cloud applications. There’s also some overlap with Contentsquare.
You can use either platform for
Granular error tracking for a wide range of error types
Comprehensive Real User Monitoring (RUM) and synthetic monitoring
Website and mobile app monitoring
Customizable real-time alerts for critical issues
Session replays to debug workflows
As you would expect, Datadog also has many additional features relating to error and speed analytics, including comprehensive infrastructure monitoring, network performance monitoring, and security management.
However, Datadog’s depth is built for developers, which makes it harder for non-technical teams to prioritize fixes based on business impact.
Contentsquare makes error and speed issues understandable and actionable for every team.
With Contentsquare, everyone can use
Error Analysis to surface JavaScript, API, and custom errors harming conversions and revenue
AI error summaries to understand root causes and key issues without digging through logs
Speed Analysis to spot slow pages and quantify their impact on revenue
Impact Quantification to prioritize bug fixing by business metrics like consetions and revenue
🔥Pro tip: Contentsquare also automatically supports retroactive text search to find hidden error messages users see like ‘Oops, something went wrong’ or ‘Invalid entry’.
![[visual] Contentsquare’s AI shows you which errors are costing you business](http://images.ctfassets.net/gwbpo1m641r7/1tTmcffkVWbkj6M2IY54mP/9b7becf2239769270200f7fceb934ede/Contentsquare-vs-Dynatrace-use-AI-to-find-errors.jpg?w=3840&q=100&fit=fill&fm=avif)
Use Contentsquare to find and prioritize errors by business impact, no technical expertise required
UX optimization
Not every issue on your website or app is technical. If you rely solely on Datadog, you’ll miss critical UX problems that impact user satisfaction and conversion rates.
Datadog can only flag limited frustration signals like rage clicks and dead clicks. Contentsquare surfaces a broader range of behavioral and navigation issues that affect real user journeys.
Our Frustration Score automatically surfaces the most impactful UX issueson your site or app, ranks them by impact, and connects them to session replays and journeys for further context. Use it to find
Confusing navigation paths that lead to abandonment
Form fields that cause friction and drop-offs
Unclear CTAs or messaging that reduce conversion rates
Content that fails to engage users
Design elements that distract from key conversion goals
Contentsquare also quantifies the revenue impact of UX issues, so you always know exactly which fixes to prioritize.
Impact quantification
Datadog excels at performance monitoring, but it doesn’t connect errors, slowdowns, and UX issues to business outcomes. Contentsquare does.
We call this Impact Quantification. It shows you exactly how much revenue you're losing to specific issues, enabling you to
Prioritize fixes based on their actual business impact
Build stronger business cases for technical improvements
Track the ROI of optimization efforts
Align technical and business teams around shared KPIs
Datadog doesn’t have an equivalent feature so if you rely on it alone, you’ll find it harder to get buy-in for fixes beyond engineering teams and decide what to work on next.
Use case 2: Improving content experiences and engagement
Datadog has really limited digital experience capabilities (basic session replays and heatmaps)
Contentsquare is designed to optimize content experiences and engagement across the entire customer journey.
With Contentsquare, you get a single platform that combines
Experience Analytics (DXA) to increase engagement and conversion
Experience Monitoring (DEM) to optimize performance and eliminate friction
Voice of Customer (VoC) tools to find out what improvement your customers care about
By combining experience analytics, performance monitoring, and user feedback, we connect content engagement with load times, friction signals, and real user sentiment to guide what to optimize and why.
Leveraging AI for content optimization
Datadog’s AI tools (such as Bits AI) are designed to support engineering teams respond to incidents, which makes them harder for non-technical teams to use.
By contrast, Contentsquare's AI-powered features open up analytics by giving everyone a more comprehensive view of how users interact with content. This helps teams enhance the overall digital experience by
Identify high-impact opportunities for content optimization
Get proactive recommendations for improving user engagement
See which content elements drive conversion and revenue
Surfaceunexpected patterns in user behavior that reveal content issues
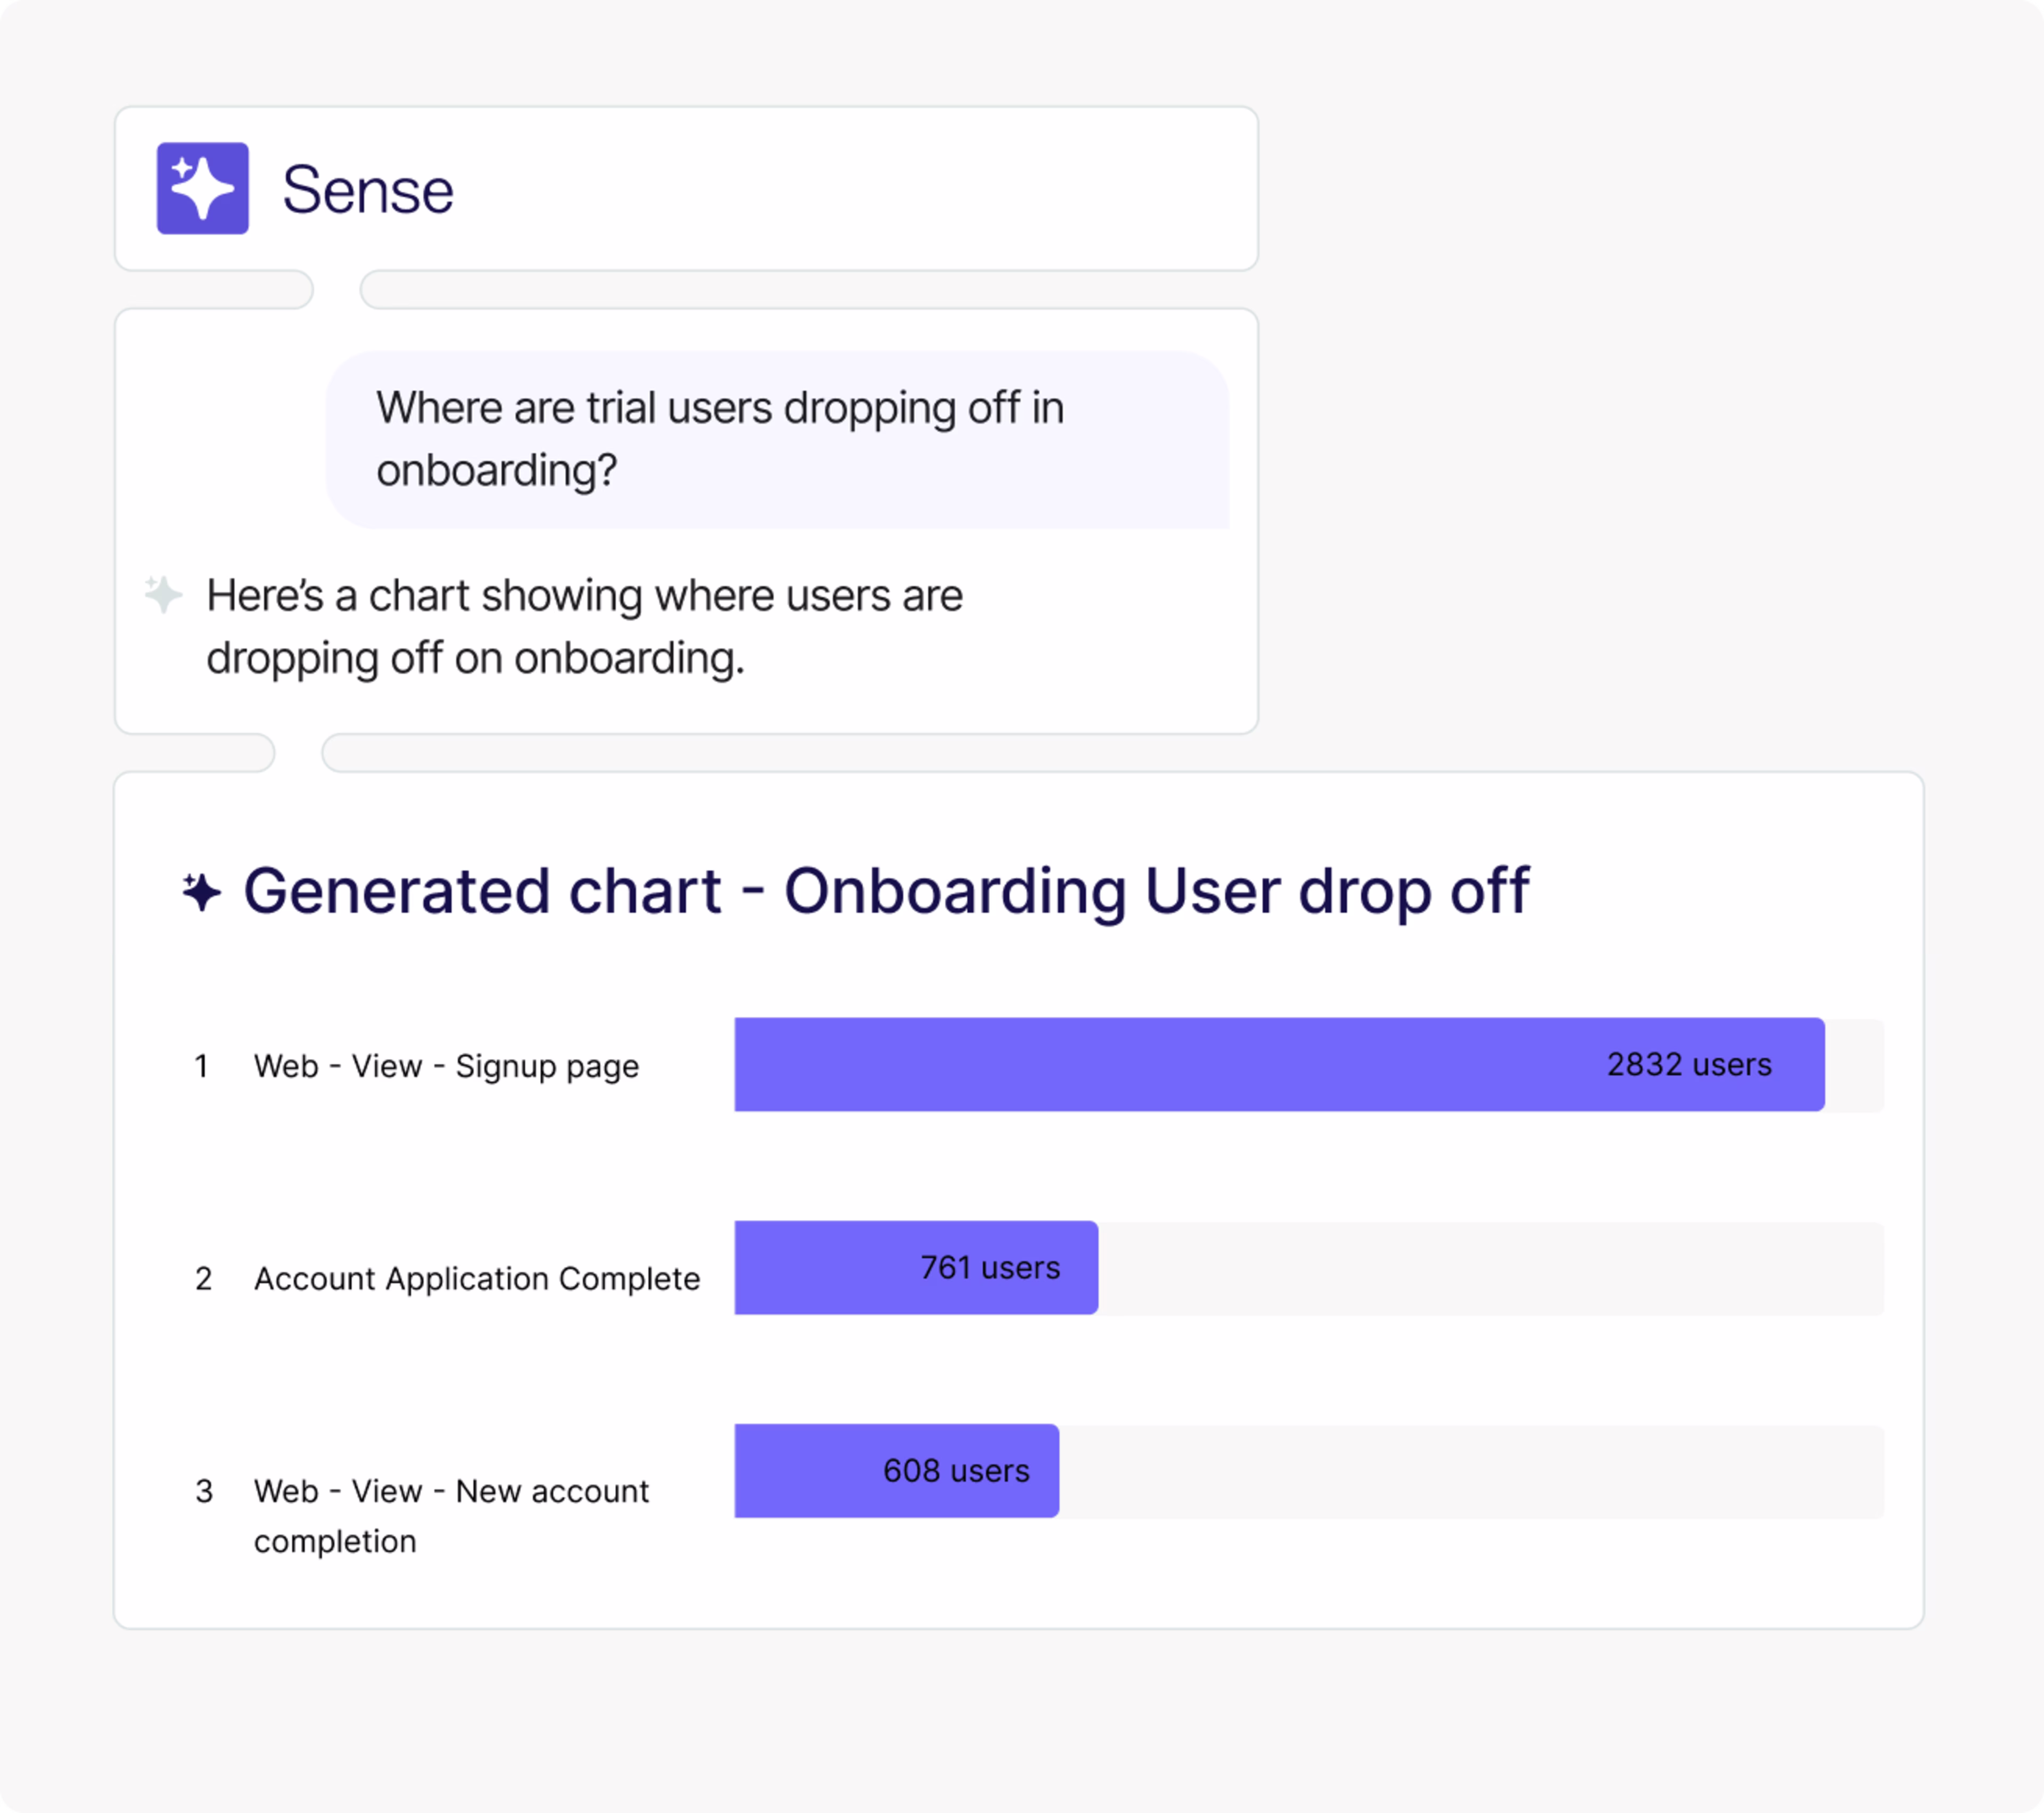
Generate insights in plain language by chatting with Sense
Turn customer conversations into growth with Conversation Intelligence
Run deep, multi-step analyses automatically with our AI agent, Sense Analyst
Get advanced analytics data without manual setup
Bring Contentsquare insights into your favorite LLM tool like ChatGPT or Claude with our MCP Server
Instead of reacting to issues, we use AI to continuously surface content improvements that drive engagement and conversions, no technical setup or knowledge required.
Optimizing for engagement with unique visualizations
Datadog’s engagement visualizations are limited to basic heatmaps that focus on click behavior and offer limited insight into overall content effectiveness.
Contentsquare Heatmaps provide deeper insight into how users engage with content and how that impacts future behaviors.
![[visual] Zoning analysis in Contentsquare](http://images.ctfassets.net/gwbpo1m641r7/4YmUJ6T747sHKR7qGinoNo/72718581ca4db578f27a2840fcf4f6f8/Contentsquare-vs-Dynatrace-zoning-heatmap.jpeg?w=3840&q=100&fit=fill&fm=avif)
Use Contentsquare Heatmaps to see exactly which elements drive revenue
With Contentsquare Heatmaps, you can
Identify high-impact A/B test and redesign opportunities
Browse live heatmaps using the Contentsquare CS Live Chrome extension to overlay metrics like conversion rate and revenue
Compare heatmaps side-by-side across variants, segments, or traffic sources
When to use Contentsquare and Datadog together
On its own, Datadog provides deep visibility into technical errors and performance for engineering teams.
Used together with Contentsquare, you can connect that technical insight to user behavior, experience quality, and revenue impact.
Use case 3: Creating better products and driving user adoption and growth
While Datadog monitors technical performance, it wasn't built to drive product growth. Contentsquare gives product teams powerful tools to understand user behavior, optimize experiences, and increase adoption.
Here's how the platforms compare.
Web, app, and product analytics
Datadog has limited product analytics capabilities. Instead of replacing product analytics tools, it’s more of a way for engineering leaders and product owners to track application performance data and error rates.
Contentsquare Product Analytics, offers full web, app, and product analytics so every team can track KPIs, identify journey blockers, and improve conversion and retention.
Use Contentsquare's AI-powered Product Analytics to get straight to the right insights
With Contentsquare Product Analytics, your teams can
Get retroactive insights through autocapture and robust data governance without pre-planning events
Create customizable analytics dashboards for different teams and use cases—for example, an acquisition dashboard for marketers, or a feature adoption dashboard for the product team
Combine website, app, and offline data in one place to understand journeys across devices and touch points
Use intuitive tools like Web Analytics, Lifetime Value Analysis, User Analysis, and Page Comparison to get quick insights and monitor changes
Use AI to generate any analytics chart or insight by chatting with Sense
Investigate analytics data from other Contentsquare tools in just a few clicks, like Heatmaps or Funnels
Journey analysis across sessions and devices
You can view limited sankey journey visualizations in Datadog—they look similar to the ones GA4 generates. However, these basic visualizations have limited filtering capabilities and only show from/to paths without deeper behavioral context.
For deeper insights into user behavior, you’ll need Contentsquare Journey Analysis, which
Displays a comprehensive top-down view of all user flow through your site or app at once
Uses color-coding to represent different page types (like product detail pages or category pages)
Enables side-by-side journey comparisons to analyze successful vs. unsuccessful paths
Allows different teams to view journeys at the level that matters to them (executives can see high-level site sections while content teams can analyze granular page-level data)
Makes it easy to discover unexpected patterns in user behavior like looping behaviors
Uses Sense AI to generate journey maps from any conversational query (like “What did visitors do after viewing a blog post?”)
![[Customer story] alexanderwang - sense chat](http://images.ctfassets.net/gwbpo1m641r7/HqH1cqpCSnzUhkCdEBV72/96f2073d56800612fdd24485c360f24e/sensechat.webp?w=3840&q=100&fit=fill&fm=avif)
Analyzing customer journeys in Contentsquare, enhanced by Sense AI
Because of the wider platform, Contentsquare’s journey visualizations show not just the paths users take, but why they take them and, more importantly, how to optimize those journeys for better outcomes.
Data-backed A/B testing to drive measurable outcomes
Datadog isn’t built for A/B testing and doesn’t have native integrations with testing platforms.
By contrast, Contentsquare integrates with leading A/B testing platforms—including Optimizely, VWO, and AB Tasty—and makes it easy for teams to
Identify the most impactful opportunities for testing through AI-powered recommendations
Track detailed user behavior metrics during tests
Tie behaviors to outcomes by measuring the revenue impact of behaviors in each variant
Analyze how different segments respond to changes
Generate test hypotheses based on actual user behavior patterns
By using Contentsquare, you can go beyond simply testing variations and move toward a more data-driven approach to A/B testing that focuses on driving measurable business outcomes.
📢 See it in action
RingCentral, a leading provider of trusted AI communications, used Contentsquare to identify the best areas for A/B testing and improvement. One test—a redesign of the main lead capture form—resulted in an immediate +25% increase in conversion rate.
Use case 4: Improving marketing acquisition
Data plays an increasingly important role in marketing acquisition. Datadog helps spot the technical issues that lead to bounces and abandonment, but it stops there.
Here’s how Contentsquare gives marketing teams the insight needed to convert more traffic into customers.
Marketing campaign performance analysis
Use Contentsquare to boost marketing campaign performance by
Analyzing the performance of your marketing campaigns
Our Product Analytics capabilities aren’t just for product teams. Use them to create marketing dashboards and gain deep insight into your customer acquisition channels, including traffic and conversion metrics by campaign
Use the User Lifecycle extension to identify key drivers of ROI and customer lifetime value
Reducing bounce rates
Our Heatmaps show why acquired traffic bounces on landing pages and the steps to take to reduce bounce rates
Similarly, Journey Analysis shows you where users drop off so you can optimize paths to conversion
Session Replay gives you qualitative context to pinpoint the exact moments of hesitation or frustration that lead to abandonment
Optimize landing pages for conversion
Beyond detecting technical errors, we analyze every interaction on landing pages to show what’s working, what’s ignored, and what hurts conversion.
See exactly which CTAs get attention (and which are being ignored) using Heatmaps
Use AI Frustration Scoring to automatically surfaces the highest-impact opportunities on your landing pages
Compare converting and non-converting journeys side by side with Journey Analysis
Test different layouts and content variations to maximize engagement—connect Contentsquare to your A/B testing platform to measure detailed behavioral metrics for each variant
Track form completion rates using Heatmaps
Measure the impact of design changes on conversion metrics with Impact Quantification
Conversion funnel analysis
While Datadog funnels can show basic user flows and connect with session replays for further investigation, Contentsquare's advanced funnel analysis capabilities go beyond by helping you transform those insights into revenue.
Use Contentsquare’s AI-powered funnel tools to
Instantly spot conversion blockers by automatically surfacing hidden friction points and opportunities
Investigate drop-offs at a granular level by clicking through to analyze user behavior at any funnel step using Journey Analysis
Take immediate action on insights by creating user segments based on funnel completion or abandonment—perfect for targeting these users with personalized messaging
Get answers in seconds by asking Sense questions like ‘what causes most users to abandon during checkout?’
![[visual] Track and optimize marketing funnel performance in Contentsquare](http://images.ctfassets.net/gwbpo1m641r7/6Z5C9LyQKKJCmcDcr6ebX8/13b03b15702070e808b343d49c8dbb99/Funnel-analysis-Datadog-vs-Contentsquare.png?w=1920&q=100&fit=fill&fm=avif)
Track and optimize marketing funnel performance in Contentsquare
Use case 4: Collecting and analyzing customer feedback to improve your experiences
Although Datadog excels at technical monitoring, it doesn't offer any capabilities for collecting and analyzing customer feedback—a crucial missing piece for truly understanding and improving the customer experience.
Contentsquare's Voice of Customer tools fill this gap by helping teams
Capture feedback at the right moment with targeted surveys that automatically appear based on user behavior, like cart abandonment or repeated page visits
Connect feedback to behavior by seeing exactly what users did before and after leaving feedback through direct integration with Session Replay
Highlight key customer pain points using AI sentiment and response analysis
Share insights across teams to help prioritize improvements based on customer needs
Take immediate action by creating segments of users who left specific feedback for targeted follow-up
Analyze customer chats with Conversation Intelligence, powered by Loris AI
![[visual] Use Contentsquare to analyze feedback with AI at scale](http://images.ctfassets.net/gwbpo1m641r7/16o3RTIspsIYhFuJVmY567/8db484ee5e665ed0d4c281c146c56c99/Use_Contentsquare_to_analyze_feedback_with_AI_at_scale_.png?w=1080&q=100&fit=fill&fm=avif)
Automatically generate AI survey reports and feedback sentiment analysis in Contentsquare
By combining VoC data with Contentsquare's other capabilities and application monitoring tools like Datadog, teams can
Validate technical issues with real customer feedback
Understand the ‘why’ behind behavioral patterns
Prioritize improvements based on what customers actually want
Measure the impact of changes on customer satisfaction
This holistic approach to customer feedback helps organizations move beyond just fixing technical issues to creating experiences that truly resonate with customers and drive long-term loyalty.
Contentsquare vs. Datadog: why teams use both
When evaluating Contentsquare vs. Datadog, remember that while Datadog excels at technical monitoring, relying on it alone means you're only plugging holes, not actively driving growth.
To summarize, Datadog helps you
Find and fix technical issues
Monitor application performance
Alert developers to problems
But this reactive approach leaves critical questions unanswered:
Which issues are actually hurting revenue the most?
What frustrations are causing users to abandon?
How can you optimize experiences to drive growth?
What content and features actually engage users?
When you use Contentsquare alongside Datadog (or alternatives like Dynatrace or Noibu), you will
Transform technical fixes into revenue gains and
Quantify the exact revenue impact of every error and performance issue
Prioritize fixes based on business impact, not just technical severity
Build stronger business cases for technical improvements
Optimize the entire digital experience
Surface UX issues that technical monitoring misses
Understand how users actually engage with content and features
Test and validate improvements with detailed behavioral data
Track the revenue impact of every optimization
Drive proactive growth across teams
Give everyone—not just developers—the insights they need
Improve marketing campaigns and conversion rates
Create better products based on actual user behavior
Build experiences that truly resonate with customers
Ready to see how Contentsquare will transform your analytics? Take our product tour and discover how to turn your data into growth-driving insights.
FAQ Contentsquare vs Datadog
Datadog is a cloud-based application monitoring and security platform founded in New York City in 2010 by Olivier Pomel and Alexis Lê-Quôc. The company went public on the NASDAQ in 2019 and today has 5,000+ employees and regional headquarters in Boston, Dublin, Paris, Singapore, Sydney, and Tokyo.
![[Visual] Contentsquare's Content Team](http://images.ctfassets.net/gwbpo1m641r7/3IVEUbRzFIoC9mf5EJ2qHY/f25ccd2131dfd63f5c63b5b92cc4ba20/Copy_of_Copy_of_BLOG-icp-8117438.jpeg?w=1920&q=100&fit=fill&fm=avif)
We’re an international team of content experts and writers with a passion for all things customer experience (CX). From best practices to the hottest trends in digital, we’ve got it covered. Explore our guides to learn everything you need to know to create experiences that your customers will love. Happy reading!
![[Visual] What is Contentsquare - header](http://images.ctfassets.net/gwbpo1m641r7/520cmRL5dDNOrfb9OOPCSW/a770ce55ac2daeb24d9f221d5817abd6/What_is_Contentsquare_header.png?w=1920&q=100&fit=fill&fm=avif)