The information on this page is correct as at 15/12/2025 to the best of Contentsquare's understanding.
You can’t fix what you can’t see. Amplitude helps teams run tests, analyze product usage, and track customer data, but it doesn’t show where users struggle, what causes frustration, or how much revenue is at stake.
Contentsquare (that’s us, hello! 👋) gives you the complete picture. We don’t have built-in A/B testing like Amplitude (that’s what integrations are for). We automatically capture every interaction across web and mobile, add visual context with heatmaps and session replays, and surface issues and optimizations tied directly to revenue impact. Our AI agent, Sense, goes further by proactively analyzing user behavior and highlighting the patterns, anomalies, and opportunities that matter most, so teams can act faster without relying on tagging, analysts, or guesswork.
In this comparison, we look at Contentsquare and Amplitude side-by-side so you can see which platform delivers the insights and outcomes your team really needs.
TL;DR
Amplitude is a product analytics platform focused on capturing what is happening in your product
Contentsquare is a complete experience intelligence platform that combines product analytics, experience analytics, voice of customer, and experience monitoring to show what happened, why, and what you need to focus on to drive business growth
According to Forrester Total Economic Impact™, Contentsquare delivers 602% ROI in just 6 months, almost 3x more than Amplitude does over 3 years (217%)
While Amplitude now offers basic autocapture, it remains a product-centric tool. Contentsquare provides a more robust Experience Intelligence layer, capturing not just clicks but the 'why' behind them—like frustration, hesitation, and revenue impact—right out of the box.
Contentsquare gives you the best autocaptured data on the market: we capture every interaction—clicks, scrolls, mouse moves, and form fills—across web and mobile, with full retroactivity and no manual tagging required
Amplitude shows you the ‘what’; for deeper UX insight, teams often add other tools like Hotjar or Contentsquare for session replay and error tracking, which increases cost and complexity
Contentsquare combines the ‘what’ with the ‘why’ (including user frustration, speed issues, content engagement, and drop-offs), all tied to business impact
Amplitude’s AI is limited to what’s been tagged. Contentsquare’s Sense AI proactively surfaces insights and lets teams explore data in plain language
Amplitude includes native A/B testing. Contentsquare enhances your favorite testing tool by showing why variants perform differently through side-by-side visual analysis and conversion impact
What are the main differences between Contentsquare vs. Amplitude?
Instead of jumping into a tool comparison, start from your business goals. What are your biggest business challenges? Choose the platform that’s designed to help you achieve your goals.
Here’s an overview of the main use case differences between Contentsquare vs. Amplitude from our perspective
Typical business goals and use cases | Contentsquare | Amplitude |
|---|---|---|
How do we create better products and drive user adoption and growth? | Very Strong | Very Strong |
How do we improve marketing acquisition? | Very Strong | Medium |
How do we improve content experiences and engagement? | Very Strong | Light |
How do we surface obstacles and prioritize what to fix based on revenue impact? | Very Strong | Medium |
How do we create happier customers by collecting their feedback and making sense of it? | Medium | - |
Native experimentation and customer data platform? | 100+ integrations | Very Strong |
Use cases that both Contentsquare and Amplitude do well
Both Contentsquare and Amplitude are strong in product analytics and support teams focused on user adoption, feature engagement, and growth. But they take very different approaches to get you there.
Here’s what you need to know.
How do we create better products and drive user adoption and growth?
Since acquiring Heap in 2023, Contentsquare is now a comparable Amplitude alternative, with full product analytics capabilities plus additional tools for retention analysis and user segmentation.
Both Contentsquare and Amplitude are popular alternatives to product analytics competitors like Mixpanel, and Pendo. Use either to
Report on sign-ups and product usage
Measure onboarding and feature engagement
Stitch user behaviors across sessions and devices
Track retention and run cohort analysis
Create custom product analytics dashboards for different teams with templates for common use cases
Measure the success of SaaS products and ecommerce stores
Key difference: complete vs. limited autocapture
One of the biggest differences between Contentsquare Product Analytics and Amplitude is how they capture data.
While they recently added limited autocapture for a predefined set of events (like page views, clicks, and file downloads), Amplitude has introduced Autocapture for web, but there is still a heavy reliance on 'precision tracking' for complex business logic. Contentsquare’s Smart Capture is purpose-built for experience analysis, automatically tracking gestures like 'rage clicks' and 'hesitation' that Amplitude's default autocapture doesn't prioritize.
In contrast, Contentsquare Product Analytics has the best mobile and web autocapture on the market (we call it Smart Capture).
![[visual] live data feed](http://images.ctfassets.net/gwbpo1m641r7/71mzWiLRk4oO45jnDuvnHN/11f377e64eb896e053b93cd081f65bf5/live_data_feed.png?w=3840&q=100&fit=fill&fm=avif)
Contentsquare’s live data feed
Unlike Amplitude, Contentsquare is built for comprehensive, retroactive, ‘always-on’ product analysis. Every team self-serves retroactive insights without extensive planning or back-and-forth with engineering to get things set up correctly.
Plus, Smart Capture works on all plans with no event limits, even on our free tier. 🥳
For teams looking to go even further with their data, Contentsquare’s Data Connect lets you automatically export experience, product, and error data straight to your warehouse of choice.
How do you facilitate experimentation?
Experimentation gives your team a low-risk way of finding what works best, backed by data.
Amplitude provides a native experimentation tool called Amplitude Experiment. You can use it to
Launch product feature and web tests, and target any segment
Track A/B test success based on metrics you already track (like completed sign-ups or average order value)
See how long it will take to reach your chosen goal using the duration estimator
Measure success based on various algorithms and confidence levels
Amplitude is strong if you want to run and manage experiments and feature flags inside one tool. Contentsquare does not provide a native A/B testing tool, but we integrate with all leading testing platforms, including AB Tasty, Optimizely, and VWO.
Contentsquare complements any experimentation stack by showing you where to test, what to change, and why one variant outperformed another.
You can use Contentsquare to improve A/B tests in 3 ways:
Use Contentsquare’s AI-powered insights to identify new opportunities for experimentation
See exactly what impacts conversions and revenue during the tests using side-by-side Zoning Analysis
Understand exactly why variants won (and lost) to iterate more effectively on future tests and design changes
![[Visual] ab test heatmaps](http://images.ctfassets.net/gwbpo1m641r7/71Feljv3nwR0ng3PEiPGEG/c5c4f991ef679e660e08970edb2a894a/ab_test_heatmaps.png?w=3840&q=100&fit=fill&fm=avif)
Visualize the outcome of A/B test variants with side-by-side Zone-Based Heatmaps in Contentsquare
What Contentsquare does better than Amplitude (and why it matters)
If you’re scrolling through homepages, Contentsquare and Amplitude could look pretty similar—collect data, put it in charts, use it to drive growth, rinse and repeat. But there are several use cases where Contentsquare provides tools that are not a focus for Amplitude’s product suite.
Here are the main differences you need to know.
How does Contentsquare use AI to scale insights?
While competitors are beginning to use AI on captured events, Contentsquare’s Sense AI is uniquely integrated with behavioral signals (like scroll depth and dwell time) to proactively surface anomalies, rather than just waiting for you to ask questions about specific tagged buttons.
Contentsquare’s AI isn’t just a layer on top of data; it’s built into the entire platform to reduce time-to-insight across every use case.
Our autonomous AI agent, Sense Analyst, continuously analyzes behavior patterns in the background and surfaces the most important changes, anomalies, and opportunities.
Sense Chat lets teams ask questions in everyday language and instantly explore the data, no dashboards required.
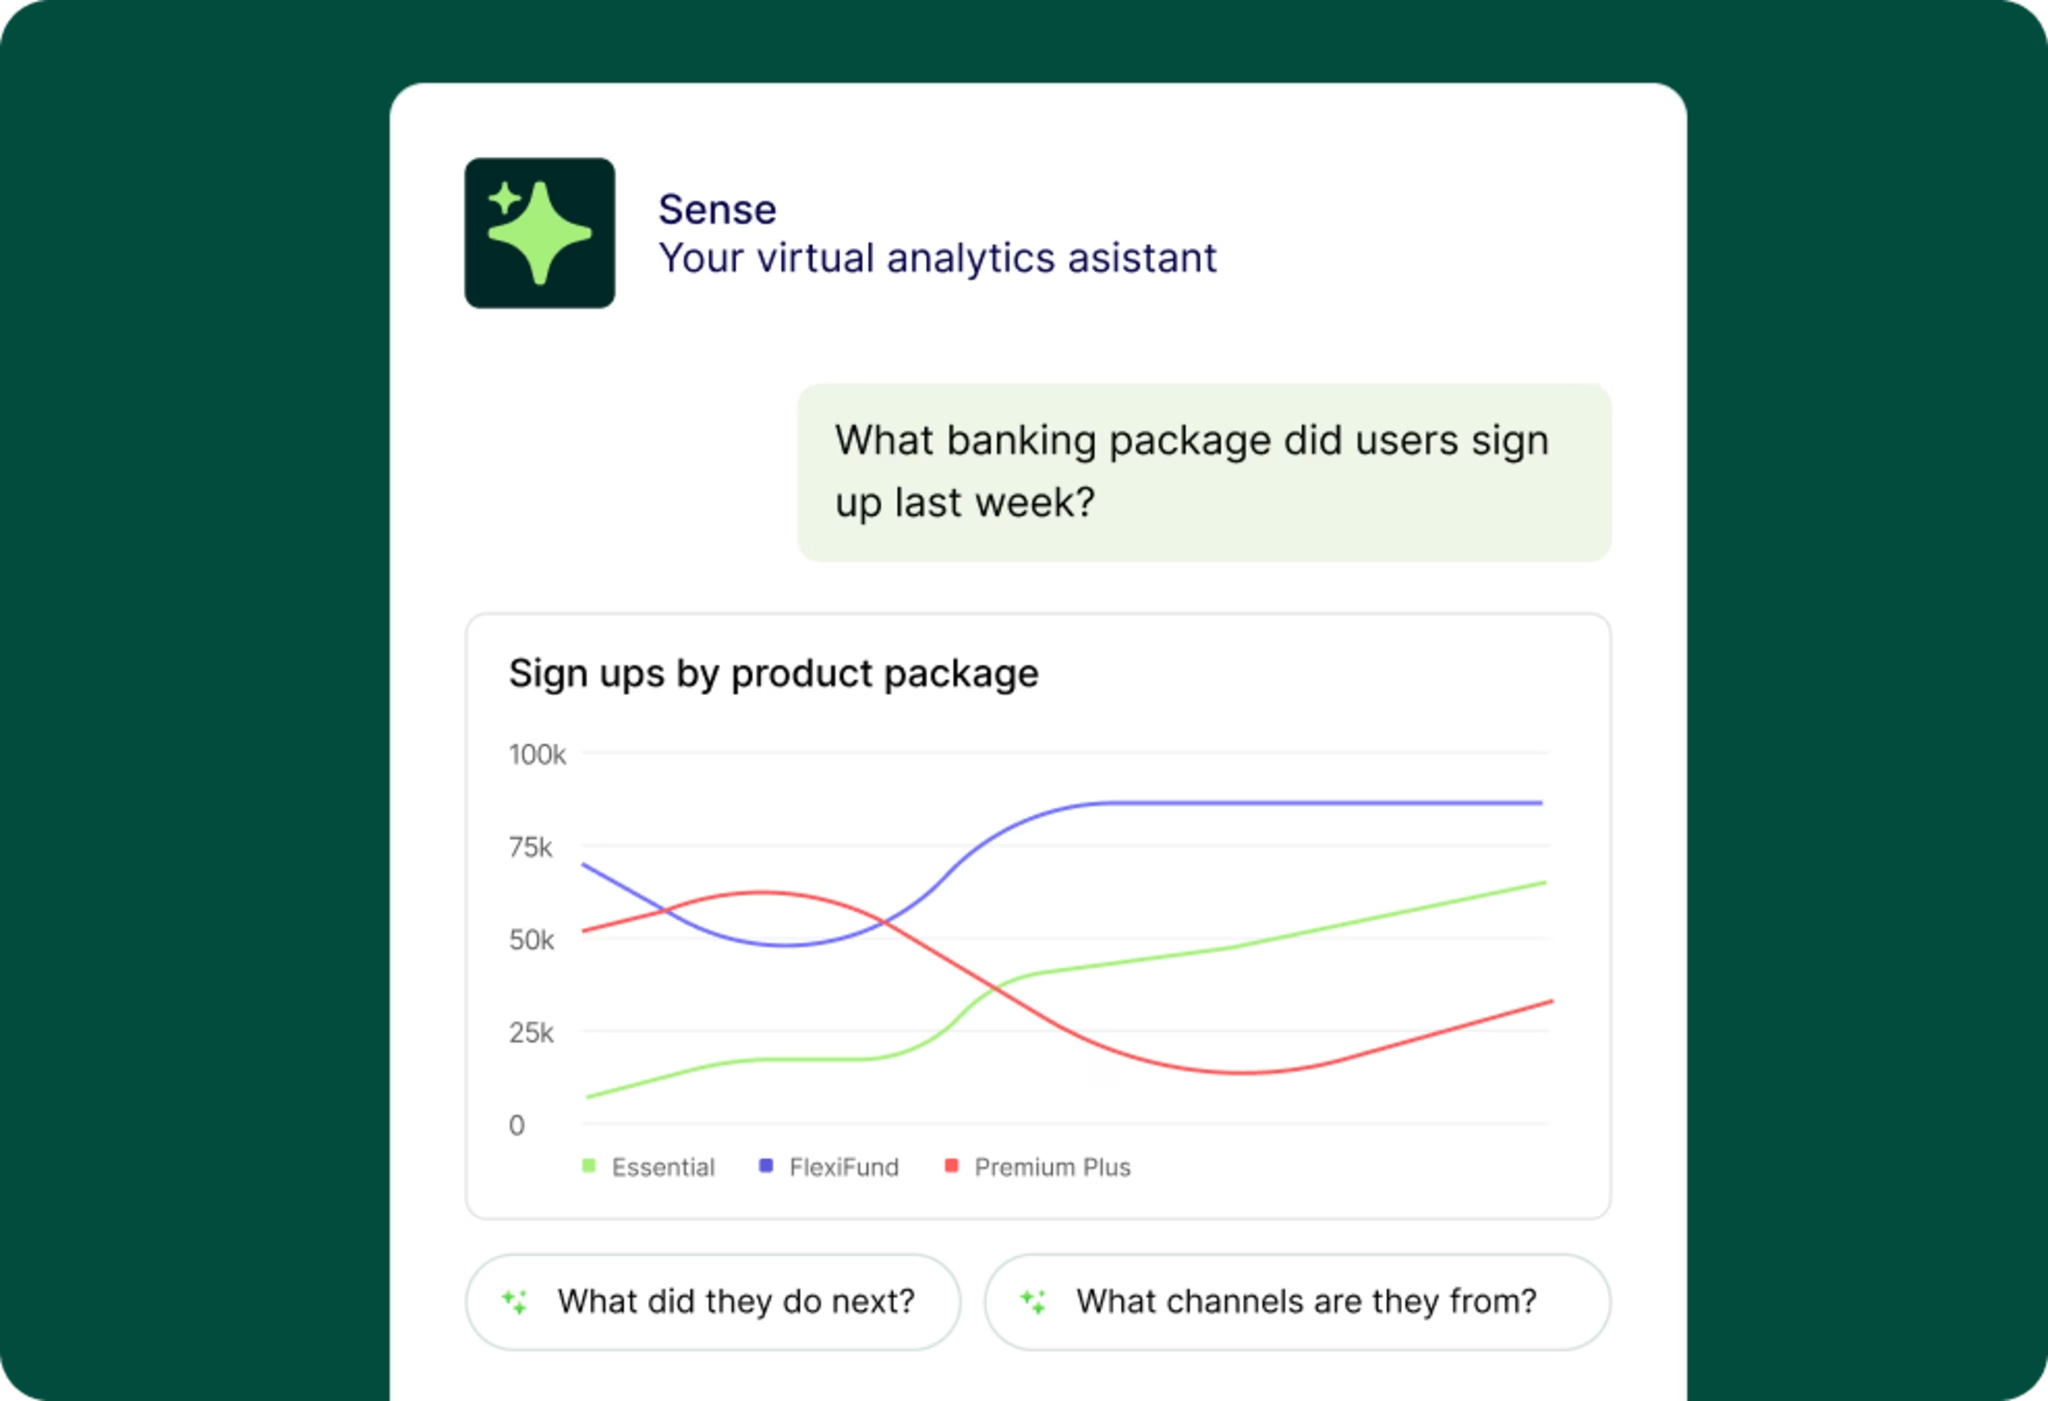
Let Sense Analyst do the hard work for you
With our acquisition of Loris AI, we’re bringing conversational intelligence into our AI layer as well. You can analyze support conversations, chat transcripts, and ticket data at scale, detect sentiment and intent, and connect what people say to what they actually did on your site or in your app.
How does Contentsquare tie insights to business outcomes?
Speaking of opportunities: Amplitude, and many of its competitors, stop at user behavior. They show you what happens, but not what it means to your business-critical metrics (like conversions and revenue).
Contentsquare goes further by connecting every interaction to business impact. Teams can quantify the revenue effect of UX issues, content performance, technical errors, and journey drop-off directly from heatmaps, journeys, or session replays.
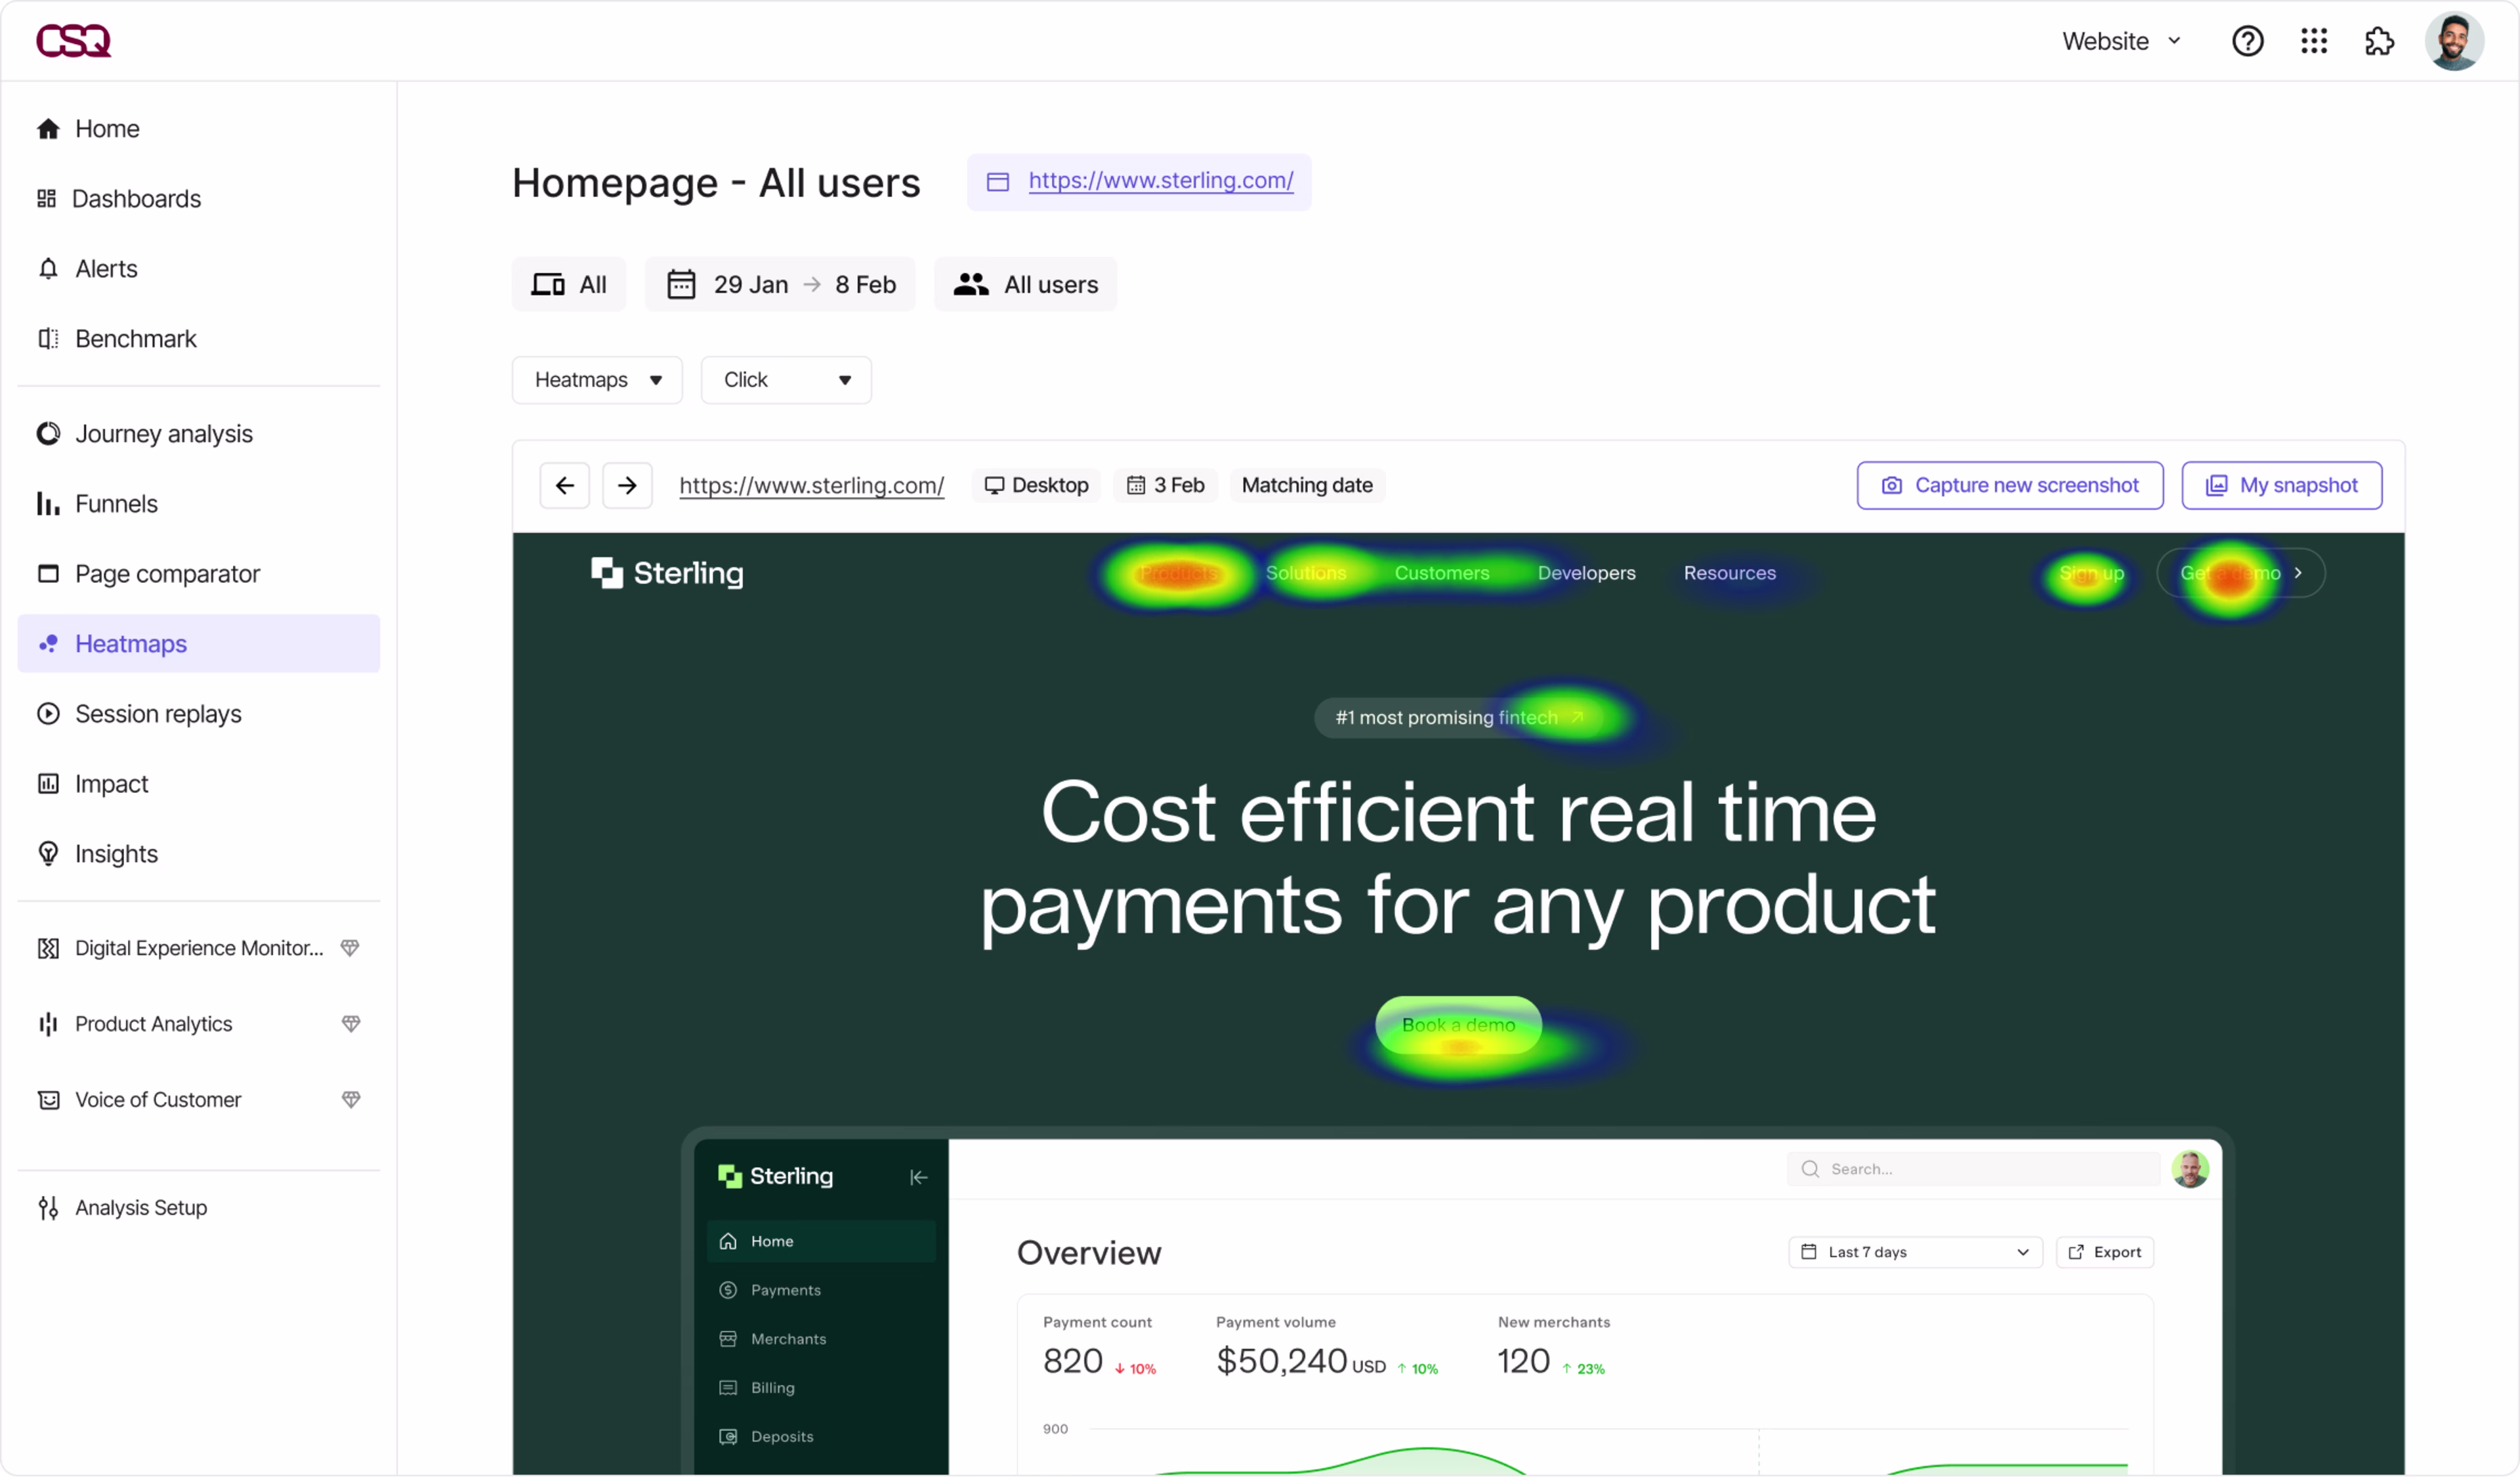
See what’s driving revenue with Contentsquare Heatmaps
With built-in frustration scoring and 1-click impact quantification, Contentsquare helps teams prioritize what to fix based on real business results, not just gut instinct or volume.
How does Contentsquare improve marketing acquisition?
For marketers working on acquisition challenges, both Amplitude and Contentsquare provide metrics on campaign traffic and conversion. Amplitude enables users to bucket UTMs and referrers into channels to organize acquisition traffic, use multi-touch attribution to evaluate which acquisition strategies shine, and track return on ad spend metrics with Google and Meta integrations or warehouse data.
Meanwhile, Contentsquare’s Product Analytics capabilities aren’t limited to analyzing product or ecommerce metrics—they also let you gain deep insight into your customer acquisition channels, for example, traffic and conversion metrics by campaign.
![[visual] Acquisition analysis in Contentsquare](http://images.ctfassets.net/gwbpo1m641r7/1C7LrEYFHRYGLw1DDaGLz5/532437b6f638add945f13243dcaa542f/Acquisition-analysis-in-Contentsquare-vs-GA4.png?w=3840&q=100&fit=fill&fm=avif)
A marketing acquisition overview dashboard in Contentsquare
Visual analytics
With Contentsquare’s Experience Analytics added to your eco-system, you also get comprehensive visual analytics for improving marketing ROI:
The Zone-Based Heatmaps tool shows exactly which elements are driving conversions and revenue, for example on campaign landing pages—use them to make a case for changes, demonstrate the success of an experiment, and compare segment behavior
Live Zoning overlays metrics directly onto your website—use the CS Live Chrome extension to visualize how people interact within your website pages in real-time
Sunburst journey maps visualize customer journeys to help you discover unexpected behaviors. It displays the entire user flow through the entire website or app at one glance. Similar pages are grouped into page types to reduce the noise. You can compare user journeys side by side to see how marketing-acquired users who convert behave differently from those who drop off
By combining visual analytics and traditional charts, Contentsquare gives everyone on the marketing team self-serve insights into why traffic is bouncing and what changes you should be A/B testing to improve results.
![[Guides] [Mobile Analytics] [Mobile Heatmaps] Compare Journeys](http://images.ctfassets.net/gwbpo1m641r7/7CcbpQsDieNoOOSkvT6SsJ/740f749f0c91a9fdd263f2029a7c43ef/comparejourneys.webp?w=1920&q=100&fit=fill&fm=avif)
Visualize segment differences with side-by-side journey maps in Contentsquare
Contentsquare’s Google Audiences integration
A fact of life is that many of your investments in digital marketing will be through Google’s advertising products. That’s where an integration with Google products makes it easier to improve your ROI on Google ad campaigns.
Contentsquare lets you import GA4 audiences directly into Experience Analytics. You can see how each audience behaves after they click your ads, which content they engage with, where they drop off, and how their journeys differ.
With GA4 Audiences in Contentsquare, you can:
Filter heatmaps, journeys, and session replays by audience segment
See which campaigns and audiences drive engagement and conversions
Identify drop-off patterns and content issues for specific groups
Feed those learnings back into Google Ads and the broader Google Marketing Platform
How do we surface obstacles and prioritize what to fix based on revenue impact?
No company can afford to lose customers and users because of frustration on their sites and apps. Session Replay lets you step into users’ shoes and see what they’re experiencing.
While Amplitude has recently added session replay to its product offering, but it doesn't provide native error tracking or full experience monitoring. Many teams end up stitching it together with other tools for errors, performance, and UX diagnostics.
Contentsquare goes way beyond Amplitude’s basic features to identify all points of friction, their root causes, and (more importantly) their business impact.
Technical error analytics and resolution
Using Contentsquare you can
Combine Experience Monitoring + Session Replay for websites and mobile apps—automatically detect errors, then view relevant session replays to see exactly what users experienced before, during, and after the error occurred, like. JS errors, API errors, app crashes, console logged errors, and custom defined errors such as form validations
Save time with Frustration Scoring + Session Replay + AI summaries by skipping straight to the most important sessions
Enable support teams to resolve escalated issues by replaying the exact sessions related to customer service tickets, understanding root causes of issues down to errors, granular network details, request/response headers, and bodies
Ensure security by enabling only authorized personnel to decrypt customer data needed for handling the customer’s service tickets
Enable engineers to see the full waterfall of network details behind every replay so they can understand what leads up to bugs and fix them quickly
Get customizable real-time error alerts and dashboards that rally your team around critical issues
Make it easy to file tickets via Jira or rally teams to action via Slack and Microsoft Teams
Save time focusing on high-impact optimizations with Contentsquare’s AI-powered insights such as Frustration Score
Error tracking
Perhaps the two most popular capabilities in Contentsquare for technical teams tasked with ensuring friction-free experiences are text search and 1-click Impact Quantification.
Only Contentsquare provides retroactive text search, which enables teams to
Surface and quantify all occurrences where site users encountered unexpected error messages of any kind, for example “Oops, something went wrong”
Visualize how users experience these messages,
To learn things that technical teams didn’t already know from their APM tools such as Dynatrace, Datadog, etc.
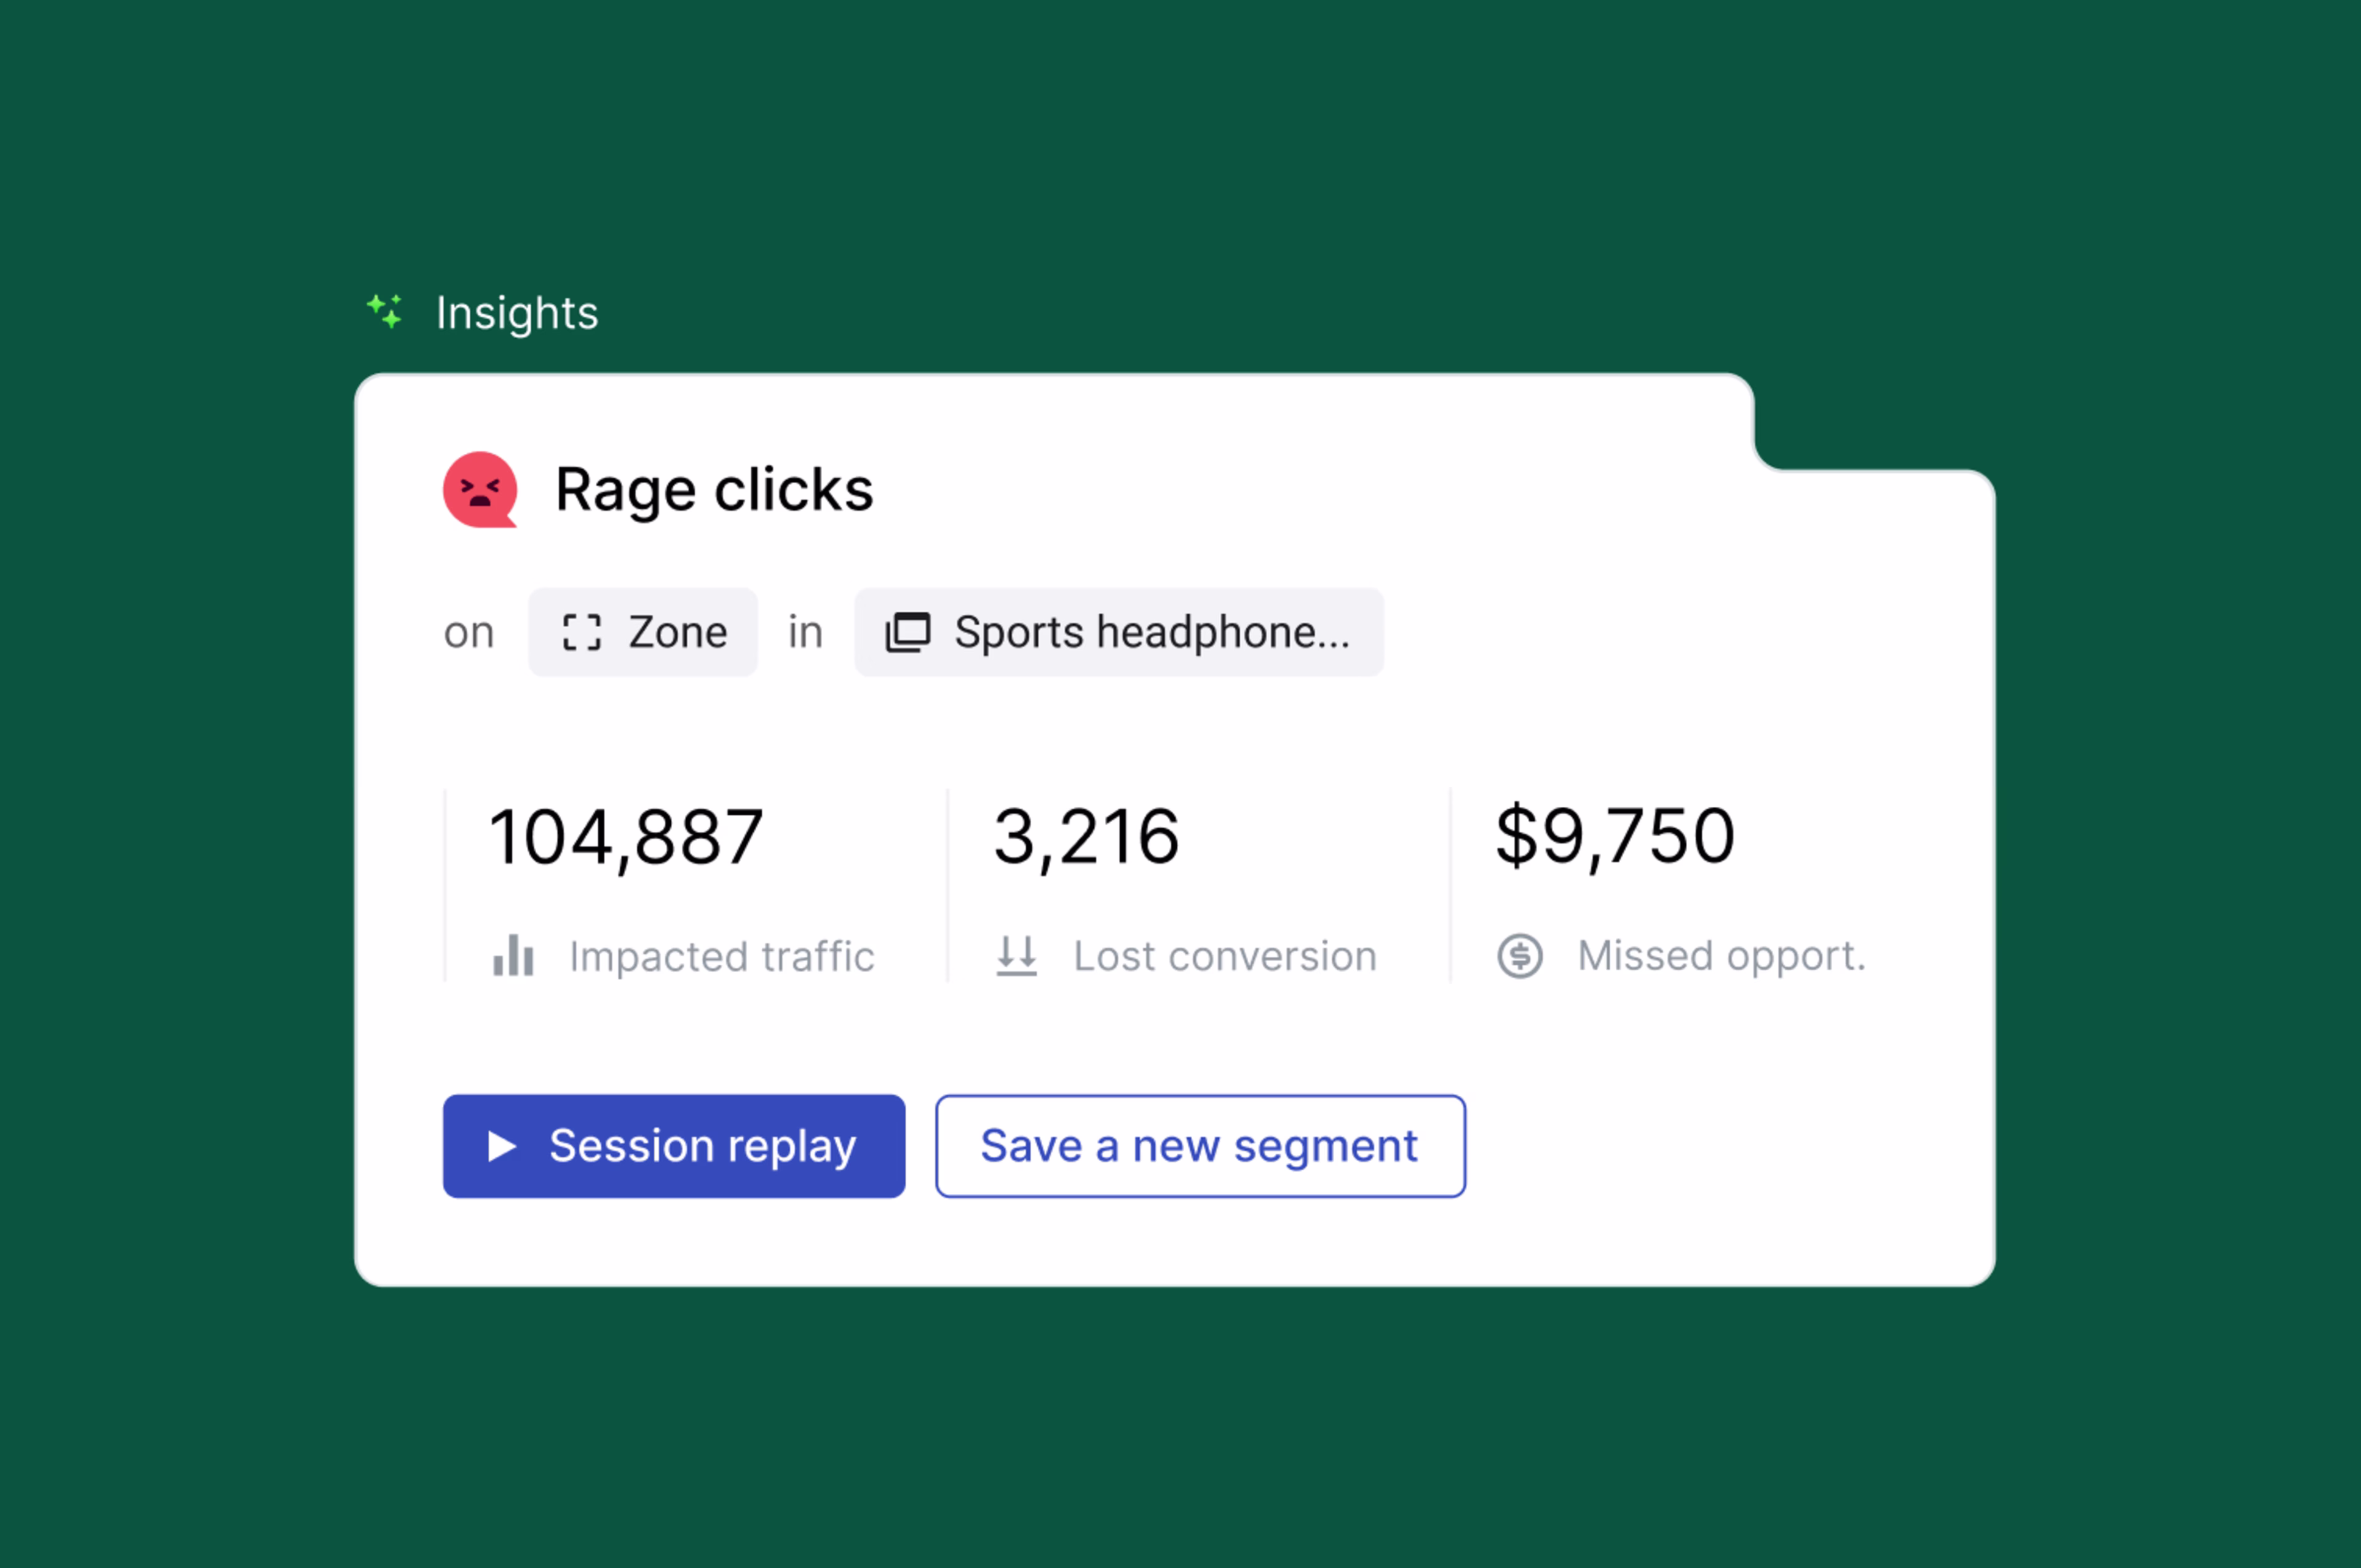
Only Contentsquare enables 1-click Impact Quantification of behaviors and errors directly from session replay:
Spot any issue or error? Simply select the issue or behaviors leading up to it and quantify with one click to see how many others experience the same problems
Contentsquare automatically compares the segment of customers that experience the issue vs. those that don’t experience it at that point to calculate the true impact of the problem
This is what enables teams to go from one to many and prioritize the issues that will actually move the needle for the business and customers
Error Analysis ranked by missed revenue in Contentsquare
Speed analysis
Errors aren't the only reason users abandon. Slow site speeds are just as costly. Contentsquare helps you pinpoint where performance lags are causing drop-offs, so you can fix them before they impact revenue.
Contentsquare provides speed analysis based on real user monitoring (RUM) to identify performance issues affecting conversion. Most importantly, this lets you quantify the conversion impact of slow speeds
Contentsquare also provides additional Speed Analysis tools based on Synthetic Monitoring. Teams use these to
Speed test new product releases before launching them to avoid costly blunders
Automatically speed test production experiences to get alerted if performance degrades
Get automated tips for what is hurting performance and how to speed it up
UX problems
Even when a website or app works as designed, users can (and often) still get confused or frustrated. These issues often go unnoticed without behavioral data that goes beyond standard click tracking.
Unlike Amplitude, which lacks zoning, frustration scoring, and visual context, Contentsquare shows you not just what users clicked, but how they interacted with the page and where the experience broke down.
With Contentsquare, you can easily spot:
Clicks on unclickable elements where users expected interactivity
Rage clicks and repetitive taps that signal confusion or error
Multiple failed form interactions and high drop-off points
Automated form field analysis, including drop rates, blank fields, and refills
Sessions where users left negative feedback, replayed with full context
Behavioral patterns behind 1-star vs. 5-star experiences, using side-by-side journey comparison
This level of insight helps product, UX, and support teams not only detect frustration, but also understand why it happened and how to fix it.
It’s also why technical teams rely on Contentsquare to monitor experience health in real time—whether they use it alongside Amplitude or as their primary product analytics solution.
How does Contentsquare create happier customers by collecting feedback and listening better?
Voice of Customer (VoC) feedback gives you direct access to what’s going on in the minds of your most important business asset—your customers.
Here’s how VoC tools empower teams across the organization to make data-driven decisions:
Marketers refine campaigns based on customer sentiment
Product teams prioritize features that resonate with users
Customer support address common pain points
Executives gauge overall satisfaction and loyalty
All this leads to improved customer experiences and increased business growth.
Amplitude doesn’t provide a native VoC tool—you’ll need to integrate with other paid tools like Survicate or Sprig to collect feedback responses and connect them to your quantitative data.
With Contentsquare, you have the option to integrate or use built-in VoC tools, including
Surveys: AI-powered for any use-case like exit-intent surveys and Net Promoter Score® (NPS®) surveys
User Tests: recruit participants and run unmoderated tests and Interviews to get feedback on new iterations of your product or feature
Intelligent analysis: transform qualitative data into actionable metrics with AI survey results and sentiment analysis
Contentsquare also gives you the ability to make sense of feedback at scale with the help of
Session Replay: 1-click to replay experiences leading up to feedback
Segmentation: to compare behaviors of users that rated experiences highly vs. poorly
Root cause analysis: combine feedback responses with Error Analysis to reveal why users are getting frustrated
Impact Quantification: quantify how many other users ran into the same frustrations even if they didn’t leave feedback, and calculate the impact on conversion and revenue
Contentsquare gives you more ways to collect and analyze VoC feedback
Is Contentsquare vs. Amplitude better for your team?
What’s your primary reason for using a platform like Contentsquare, Amplitude, or alternatives?
If you only need event-based product analytics and are comfortable with manual tagging, Amplitude could be a good fit.
If you need whole-business growth driven by deeper experience insights, faster time to insight, and less engineering overhead, Contentsquare is the best choice.
That’s why Contentsquare delivers 602% ROI in just 6 months, almost 3x more than Amplitude does in 3 years (217%), according to Forrester Total Economic Impact™.
Ready to see which solution best fits your team? Take the 7-minute Contentsquare product tour to discover how we turn your data into growth-driving insights.
FAQs about Contentsquare vs. Amplitude
Amplitude is a product analytics and event-tracking platform founded in San Francisco in 2012 by Spencer Skates and Curtis Liu. Today, Amplitude has around 3,000 customers, supported by 700+ employees spread across offices in the US, Europe, and Asia.
Net Promoter®, NPS®, NPS Prism®, and the NPS-related emoticons are registered trademarks of Bain & Company, Inc., NICE Systems, Inc., and Fred Reichheld. Net Promoter ScoreSM and Net Promoter SystemSM are service marks of Bain & Company, Inc., NICE Systems, Inc., and Fred Reichheld.
![[Visual] Contentsquare's Content Team](http://images.ctfassets.net/gwbpo1m641r7/3IVEUbRzFIoC9mf5EJ2qHY/f25ccd2131dfd63f5c63b5b92cc4ba20/Copy_of_Copy_of_BLOG-icp-8117438.jpeg?w=1920&q=100&fit=fill&fm=avif)
We’re an international team of content experts and writers with a passion for all things customer experience (CX). From best practices to the hottest trends in digital, we’ve got it covered. Explore our guides to learn everything you need to know to create experiences that your customers will love. Happy reading!
![[Visual] What is Contentsquare - header](http://images.ctfassets.net/gwbpo1m641r7/520cmRL5dDNOrfb9OOPCSW/a770ce55ac2daeb24d9f221d5817abd6/What_is_Contentsquare_header.png?w=1920&q=100&fit=fill&fm=avif)
![[visual] fullstory alternative](http://images.ctfassets.net/gwbpo1m641r7/7bASJZ9MHcxtfTnp6c3b45/855f561cfd4ddc3d34212625d24f7a90/alternative-fullstory-blog.png?w=1920&q=100&fit=fill&fm=avif)