The SaaS customer journey starts with a buyer becoming aware of the problem your service can solve—and ideally continues long after purchase with a loyal customer who can't get enough of your software.
It can be complex to map out cyclical subscription-based SaaS customer journeys. But mapping your users’ journey effectively gives you the best chance of improving their experiences and adding value at every touchpoint.
Follow these seven steps to map out the buyer journey for your software-as-a-service (SaaS) business to help you understand your users and turn them into satisfied, long-term customers.
Mapping out the SaaS customer journey in 7 steps
With the right insights into how users engage with your software solution, you can create a product your customers love using and stick with for years.
Follow these seven steps to create an effective SaaS customer journey map.
1. Have a clear purpose
Set a clear purpose when mapping out your SaaS customer journey and adapt your map to your unique goals. These will vary depending on what your company’s specific objectives are and whether you offer a B2B or B2C SaaS product.
Define a primary goal for your customer journey mapping process. It could be
Streamlining product adoption so users make use of all relevant features
Creating a seamless, continuous onboarding process that maximizes customer retention
Minimizing churn by identifying issues and blockers that negatively impact user experience (UX)
These goals will likely shift as your business grows and the customer journey evolves, so it’s worth revisiting them every time you update your customer journey map.
Pro tip: use heatmaps and session replays to identify underutilized features and meet your product adoption goals. Seeing how users interact with your website and product helps you pinpoint which features and page elements they’re ignoring, and prioritize making them findable and user-friendly.
![[Product screenshot] Session Replay summary – Sense AI](http://images.ctfassets.net/gwbpo1m641r7/nlg5vootccUxdOYItZBXE/f6b8b7e42ce62f2f8f283fefa64eaae8/Platform___Session_Replay___AI_summary.png?w=3840&q=100&fit=fill&fm=avif)
Watch exactly how users navigate your SaaS product with Session Replay in Contentsquare to see what's working and where they're getting stuck. Or use Sense AI to get summaries of user sessions.
2. Define every buyer type
SaaS businesses generally have various user personas. Make sure you dive deep into customer journey map research to define each potential buyer profile before mapping out the customer journey.
Use customer journey mapping tools to understand common pathways and define each customer profile for your product.
Keep in mind that this process will look different depending on whether you’re offering a B2B or B2C solution.
Think of a B2B SaaS product like email marketing tool MailChimp, for example. While marketing teams are typically the main end-users, managers and C-level executives may be the decision-makers who have the final say on whether to invest in the tool.
It’s important to create distinct user profiles for the end-users of your product as well as the people who decide whether or not to purchase it.
B2C SaaS customer profiles might look different. Take the music streaming service Spotify: music is such a universal commodity that Spotify’s user personas vary significantly in age, demographic, geography, and more.
Pro tip: use customer segmentation to understand how users behave on your site. Segment users by behavior, demographic, geography, or source (like channel or campaign) to compare how different cohorts act, and watch session replays from each segment to explore their journeys in more detail.

User (or customer) segmentation gives you granular insights about how different segments behave which you can use to enrich your SaaS customer profiles
3. Establish the stages of your customer journey
Before you start mapping, make sure you understand the key stages in your customer journey.
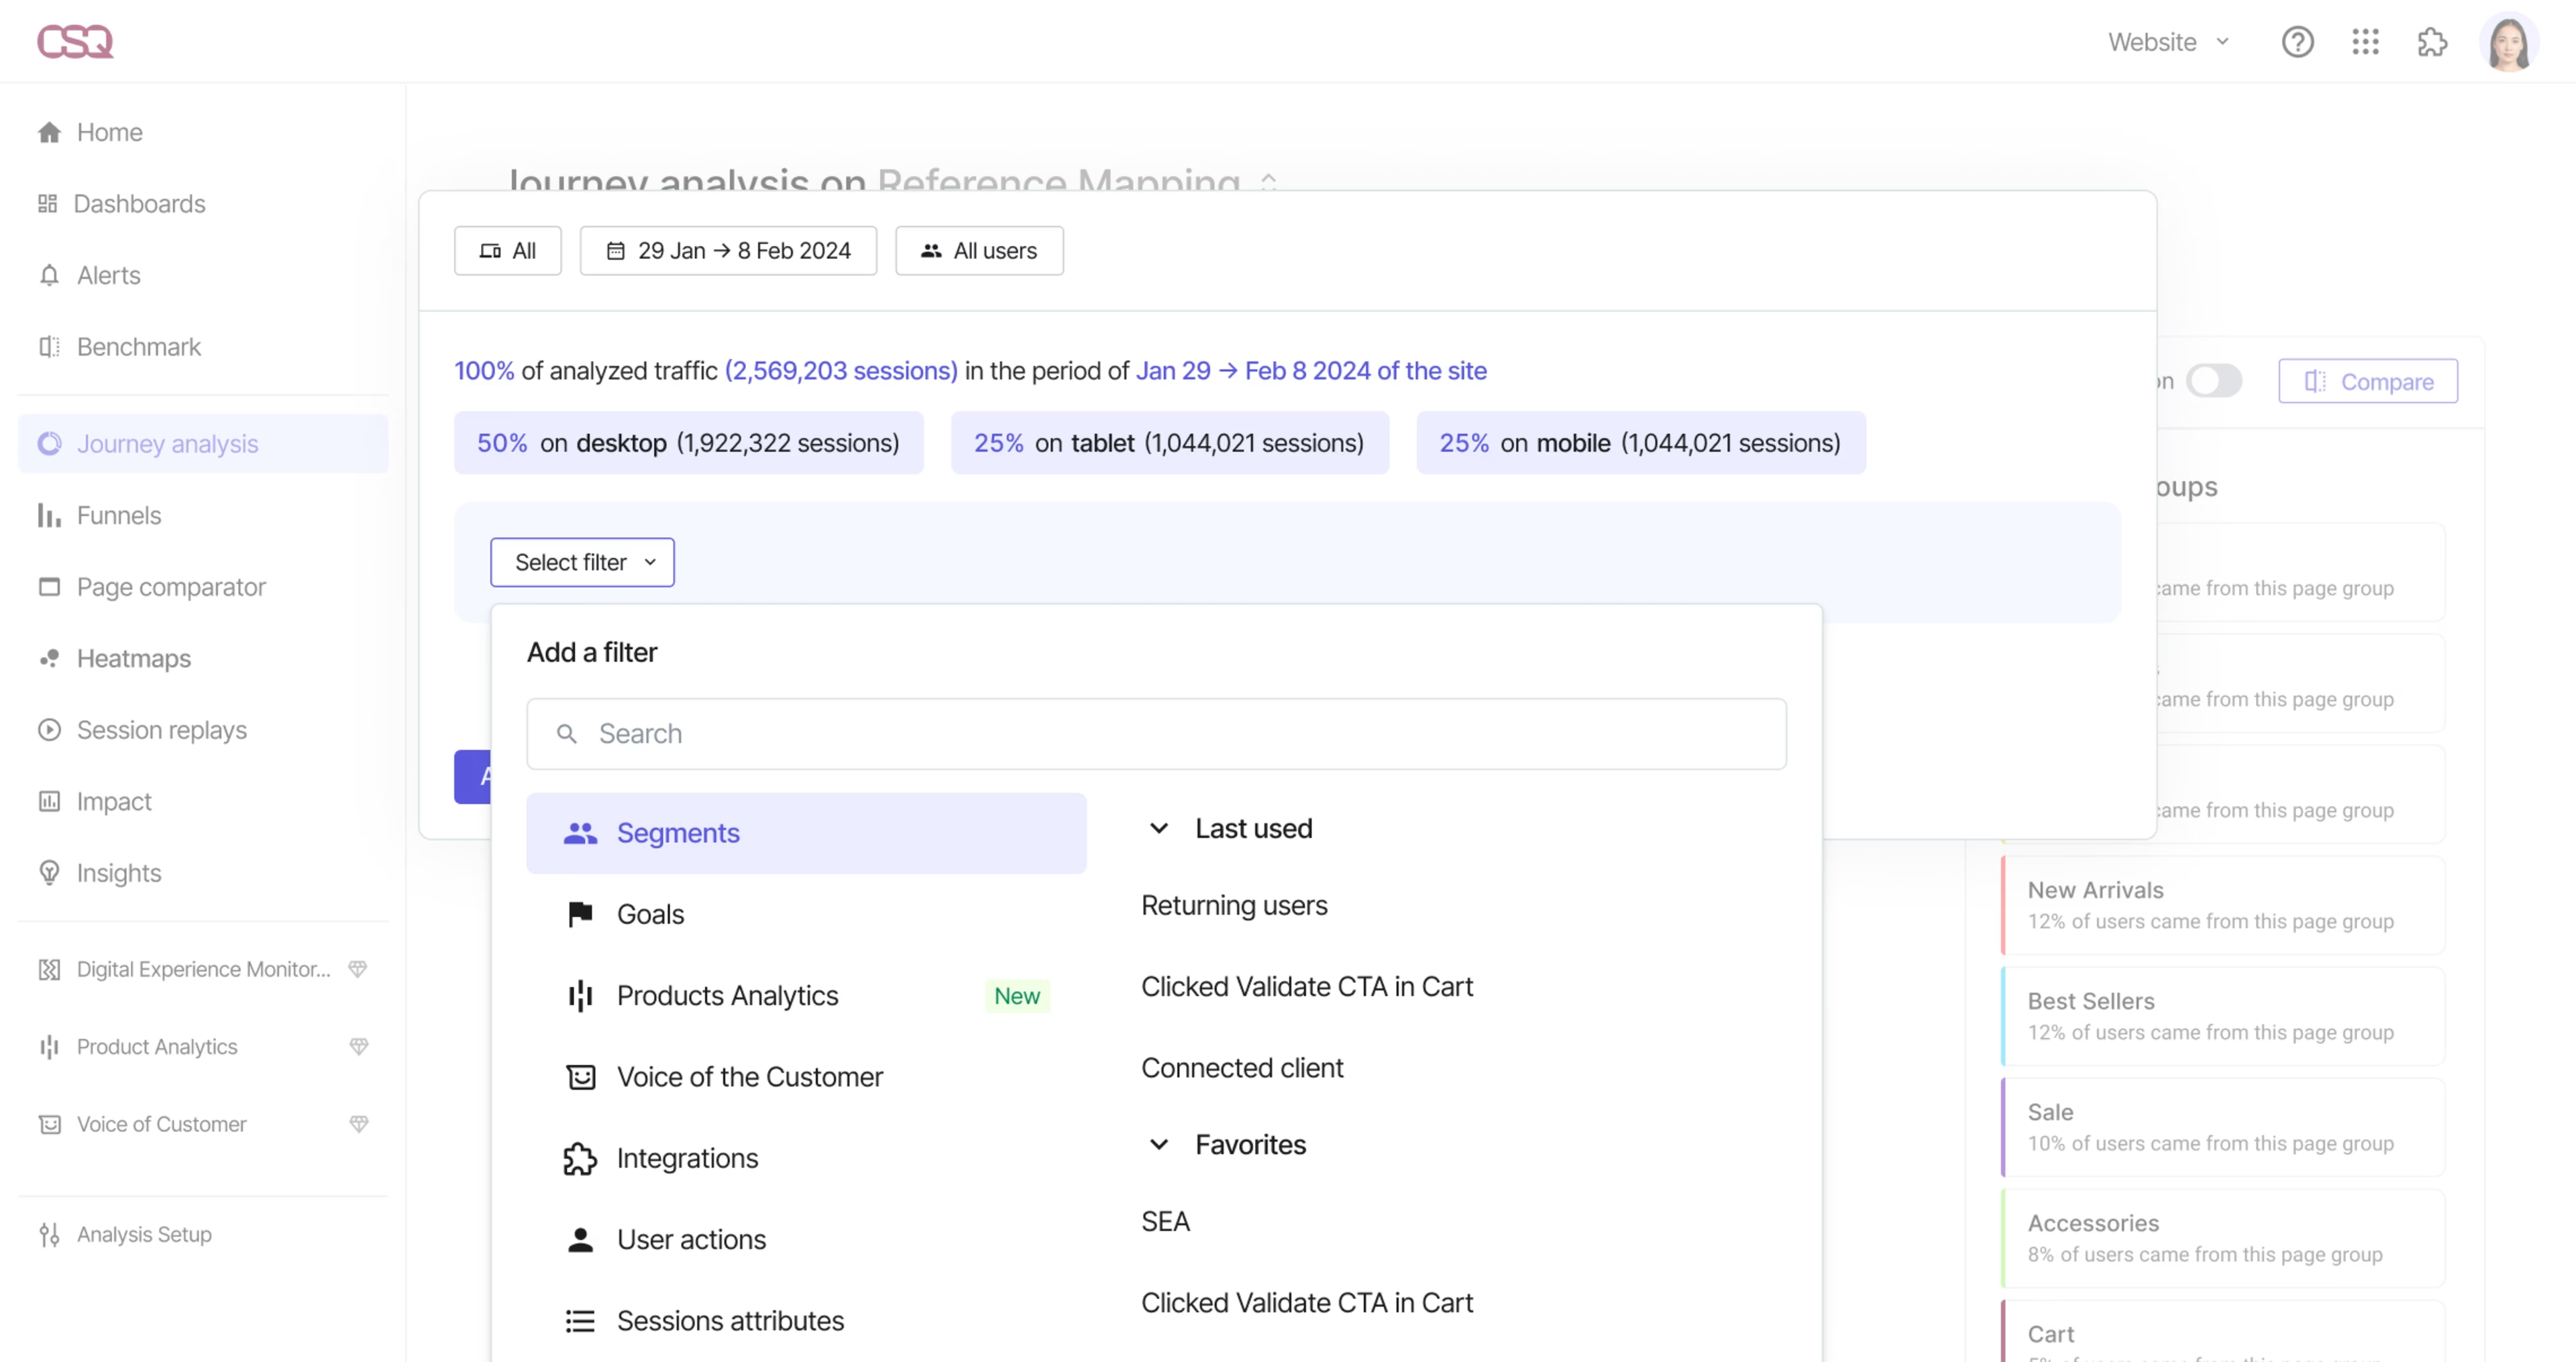
Use Journey Analysis to visualize common user journeys from entry to exit, including the pages they land on, where they go next, and where they bounce.
![[Visual] Chat with Sense typical journey](http://images.ctfassets.net/gwbpo1m641r7/5f6Z3h6Yjozlo5CWQZJX8w/f127d65f5de5edb417600ab10f382b1b/CSQ-Chat-with-Sense-typical-journey.jpg?w=3840&q=100&fit=fill&fm=avif)
Journeys aggregates user data to show you common paths customers take after landing on your site. Chat with Sense to collect insights faster, in natural language.
Typical stages for a SaaS customer include:
Awareness: a potential user becomes aware of their problem and begins to seek out solutions. This is when they find and start to explore your website or SaaS product.
Consideration: the user begins to consider various solutions. They look at product demos, blogs, and other resources to evaluate their options.
Decision: the user decides to purchase your software, either for themselves as an end user, or for their team, and selects the subscription that best fits their needs
Onboarding: the end user begins to use your tool, learns about its features, and starts integrating it into their workflow. The onboarding phase is especially important for SaaS companies to focus on, as strong product adoption is the key to recurring revenue.
Support: when problems arise, the user reaches out to customer support to resolve their issues
Retention: the user decides whether or not to renew their subscription and considers upgrading for more features
Advocacy: the user becomes a brand advocate, leaves positive testimonials and reviews, and recommends your product to friends and colleagues
Dorota Owczarek, AI Product Lead at nexocode, highlights the importance of mapping out a variety of onboarding processes for SaaS products:
It’s important to track not only the onboarding flow for a user’s first log-in or registration, but also know how to support your users when they come back to your product after a long break or if you make updates to your product’s features.
The first interactions a user has with a system and its features will be very different from the flows that they will have in day-to-day use, so these are totally separate customer journey maps that you should design with your team.
Pro tip: retention is one of the most important customer journey metrics for any SaaS business. Use these two simple steps to optimize it:
Map out what the retention stage looks like for ongoing users to find opportunities to offer more value and help them resolve their issues.
Make it easy for users to upgrade without losing their progress so far.
4. Identify the customer touchpoints at each stage
Once you’re clear on the main stages your customers move through, identify major points where users interact with your brand to create a seamless product experience (PX) across multiple channels. Laying out customer journey touchpoints is essential to improving the customer's experience every time they engage with your page or product.
Key examples of SaaS customer journey touchpoints include social media posts, the CTAs on your landing page, a sign-up form on your homepage, and your product itself.
But, you have to analyze both pre-purchase and post-purchase conversion touchpoints to improve the user experience (UX) and create loyal customers.
Take a look at how Spotify tracks one specific product workflow for a music-sharing feature, and the touchpoints they’ve identified:
![[Visual] Spotify customer journey map](http://images.ctfassets.net/gwbpo1m641r7/6P1bTjrUReELo4m4MFnhnz/a06a9785ee27a4a95fc8928163396b40/Spotify_customer_journey_map.jpeg?w=1920&q=100&fit=fill&fm=avif)
This Spotify customer journey map details customer stages, thoughts, touchpoints, and emotions
Spotify tracks external touchpoints like WhatsApp and iMessage as well as the interactions that a user has with the Spotify mobile app. At every touchpoint, they analyze users’ emotions and experiences.
Monitor every interaction, from the moment a buyer becomes familiar with your product, right through their onboarding, ongoing use, and retention experiences, to pinpoint improvements that will enhance the customer journey.
5. Highlight customer milestones
Pay close attention to key customer milestones as you track customer touchpoints. These include conversion events and other critical moments that can determine whether customers churn or stay loyal to your product.
For example, your CTAs are important customer milestones. Effective CTAs move users through the buyer journey, helping them transition from curious prospects to decided customers.
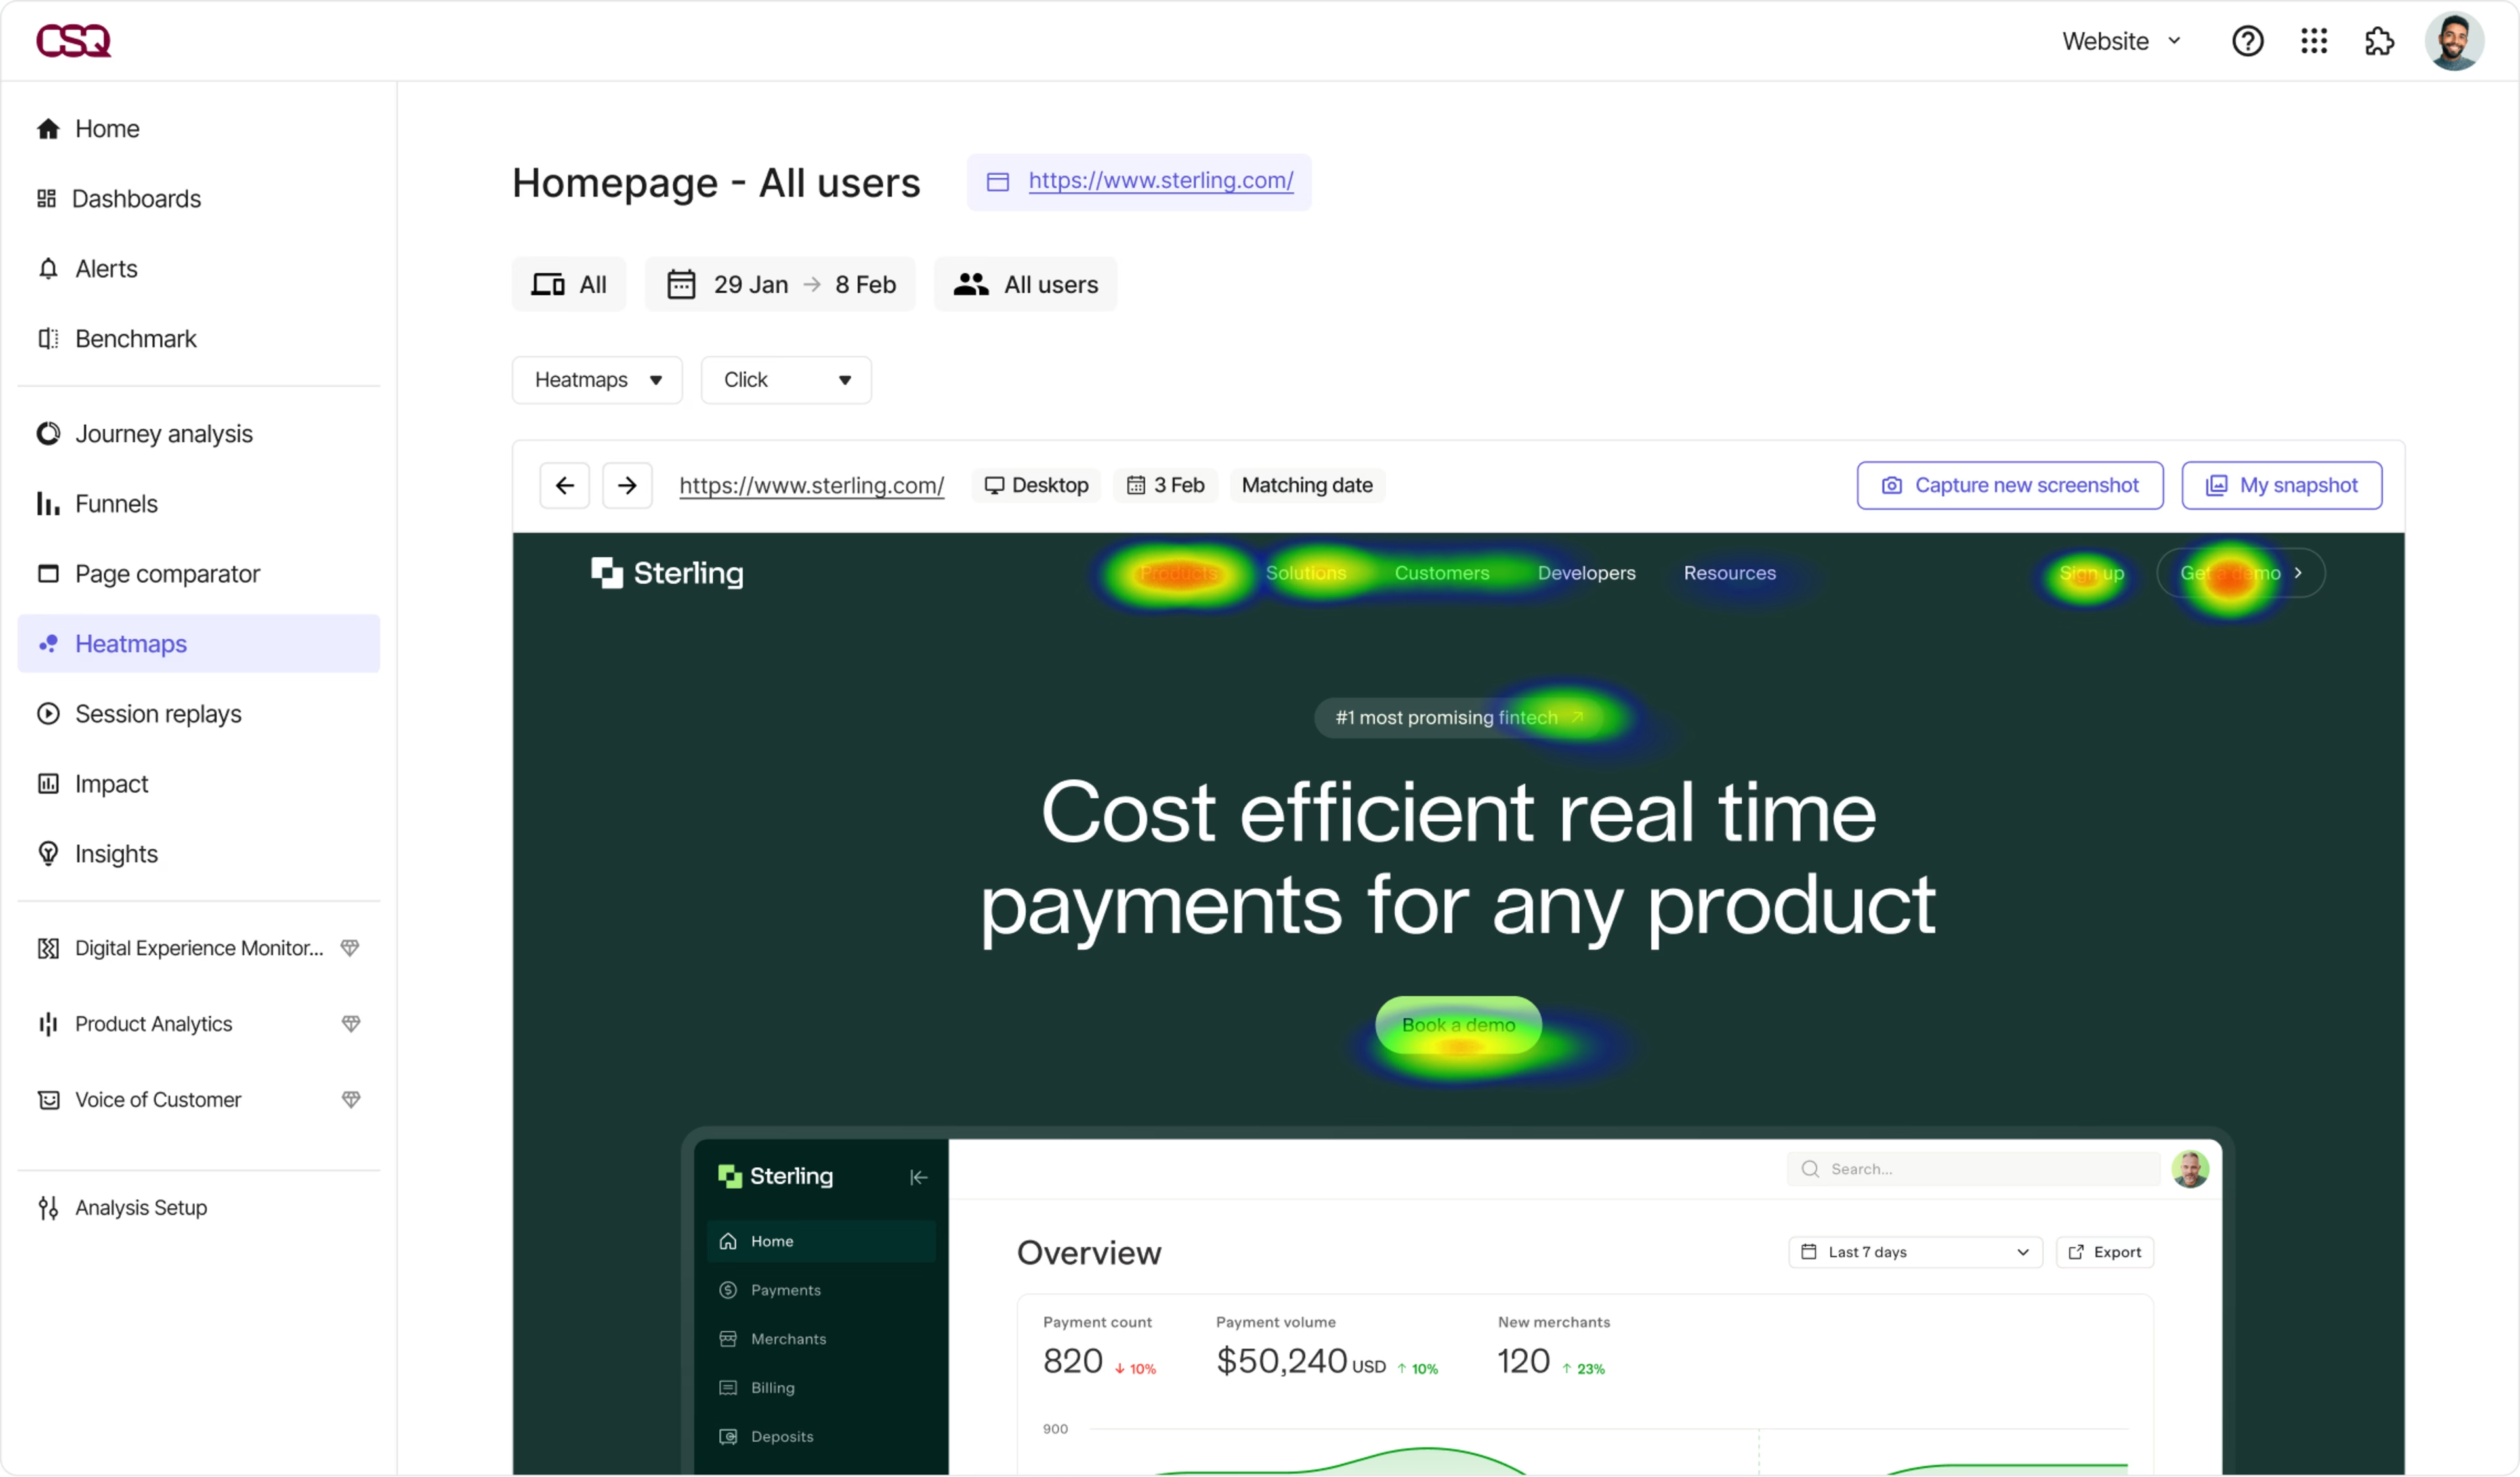
Use heatmaps to understand how users interact with your website and see whether you need to tweak your SaaS product's CTAs to increase engagement.

Heatmaps in Contentsquare reveal the areas users engage with most, so you can make data-driven optimizations
Given the importance of the post-purchase journey for SaaS products, also pay close attention to onboarding touchpoints like product demos and self-service support to prevent users from getting frustrated and dropping off.
Take B2B SaaS project management solution ClickUp. Long after users have completed their purchase and initial onboarding, they continue to see a help icon and tooltips. This gives users self-serve resources and quick access to customer support to make sure they get the help they need and feel satisfied with their experience.
![[Visual] clickup-resource-support-center](http://images.ctfassets.net/gwbpo1m641r7/2F06iRJ0BFKfEbJ5fX0FgX/8bbc23653deedb4096b06026b8d0e59d/clickup-resource-support-center.jpeg?w=1920&q=100&fit=fill&fm=avif)
The ClickUp Resource and Support Center is an onboarding touchpoint that helps ensure customer success
6. Make your map cyclical
The ideal SaaS customer journey is cyclical, so make sure you map out the full customer cycle from purchase to repeat use and renewal, rather than focusing on a linear journey that begins with users finding your product and ends with them making a purchase.
For cyclical customer journey mapping, pay close attention to your buyers' post-purchase actions, like continuous onboarding, renewals, and upgrades. Ask yourself:
Does your product make it easy for users to learn how to use new features?
Do you offer auto-renewal?
Are users aware of relevant product upgrades that might better meet their needs?
Asking these questions helps you better understand how to cater to customers post-purchase and move them into two of the most important SaaS customer journey stages: retention and advocacy.
Oleg Donets, founder and Chief Marketing Officer at Real Estate Bees, emphasizes the importance of creating a cyclical SaaS customer journey map:
The longevity of a SaaS customer is determined by a well-mapped post-sale customer journey. Due to the nature of subscription models used by SaaS businesses, SaaS companies must continuously improve customer experience through well-organized, timely, and predictable customer journey mapping to reduce churn rates and increase customers’ lifetime value.
7. Measure the outcome of the customer journey
Once you’ve mapped out key customer milestones and touchpoints, regularly check in and determine whether your customer journey helps you reach your business and user goals. Use your map to measure which parts of the journey are and aren’t working to prioritize next steps effectively.
Here are some ways to measure the outcomes of your SaaS customer journey:
Learn from every touchpoint, both the successful and less successful ones, to improve the customer journey. Even users who fail to convert, or cancel their subscriptions can provide a great learning experience. Send out a churn survey with Contentsquare to figure out what went wrong and learn how you can lower churn rates with future customers.
Use qualitative and quantitative data analysis to evaluate your customer journey and go deeper in understanding how it affects your customers and your business. Take a look at the customer journey map template for B2B SaaS AI solution nexocode: you’ll notice that they track users’ emotions, frustrations, and needs as well as KPIs at every stage of the journey.
![[Visual] nexocode-product-journey-map-template customer journey map](http://images.ctfassets.net/gwbpo1m641r7/7p5o4Z3a07PIbWctrZt0yB/49e9f23815248a65e22831b2fabe6031/nexocode-product-journey-map-template__1_.jpeg?w=1920&q=100&fit=fill&fm=avif)
Source: provided by Dorota Owczarek, Product Lead at nexocode
Collect real customer opinions about their experiences with your website and product. Use Contentsquare’s Voice of Customer (VoC) tools to launch surveys and capture real-time user feedback that lets you better understand their experience across different touchpoints—and how to improve it.
Contentsquare’s Voice of Customer tools let you hear from customers in their own words. Create surveys in seconds with AI .
Track every stage of the SaaS customer journey for user success
The unique challenges of mapping out the SaaS customer journey mean it’s essential to plan and adapt your journey to your users’ needs. If you want to get users to convert—and then stick around—you need to deeply understand their purchasing process and focus on improving it.
Follow these steps to successfully map out the SaaS customer journey to delight your buyers and turn curious users into loyal customers with a high lifetime value.
