Trusted by 3,000 enterprise and mid-market brands and 1.3+ million websites
Find the story behind every click
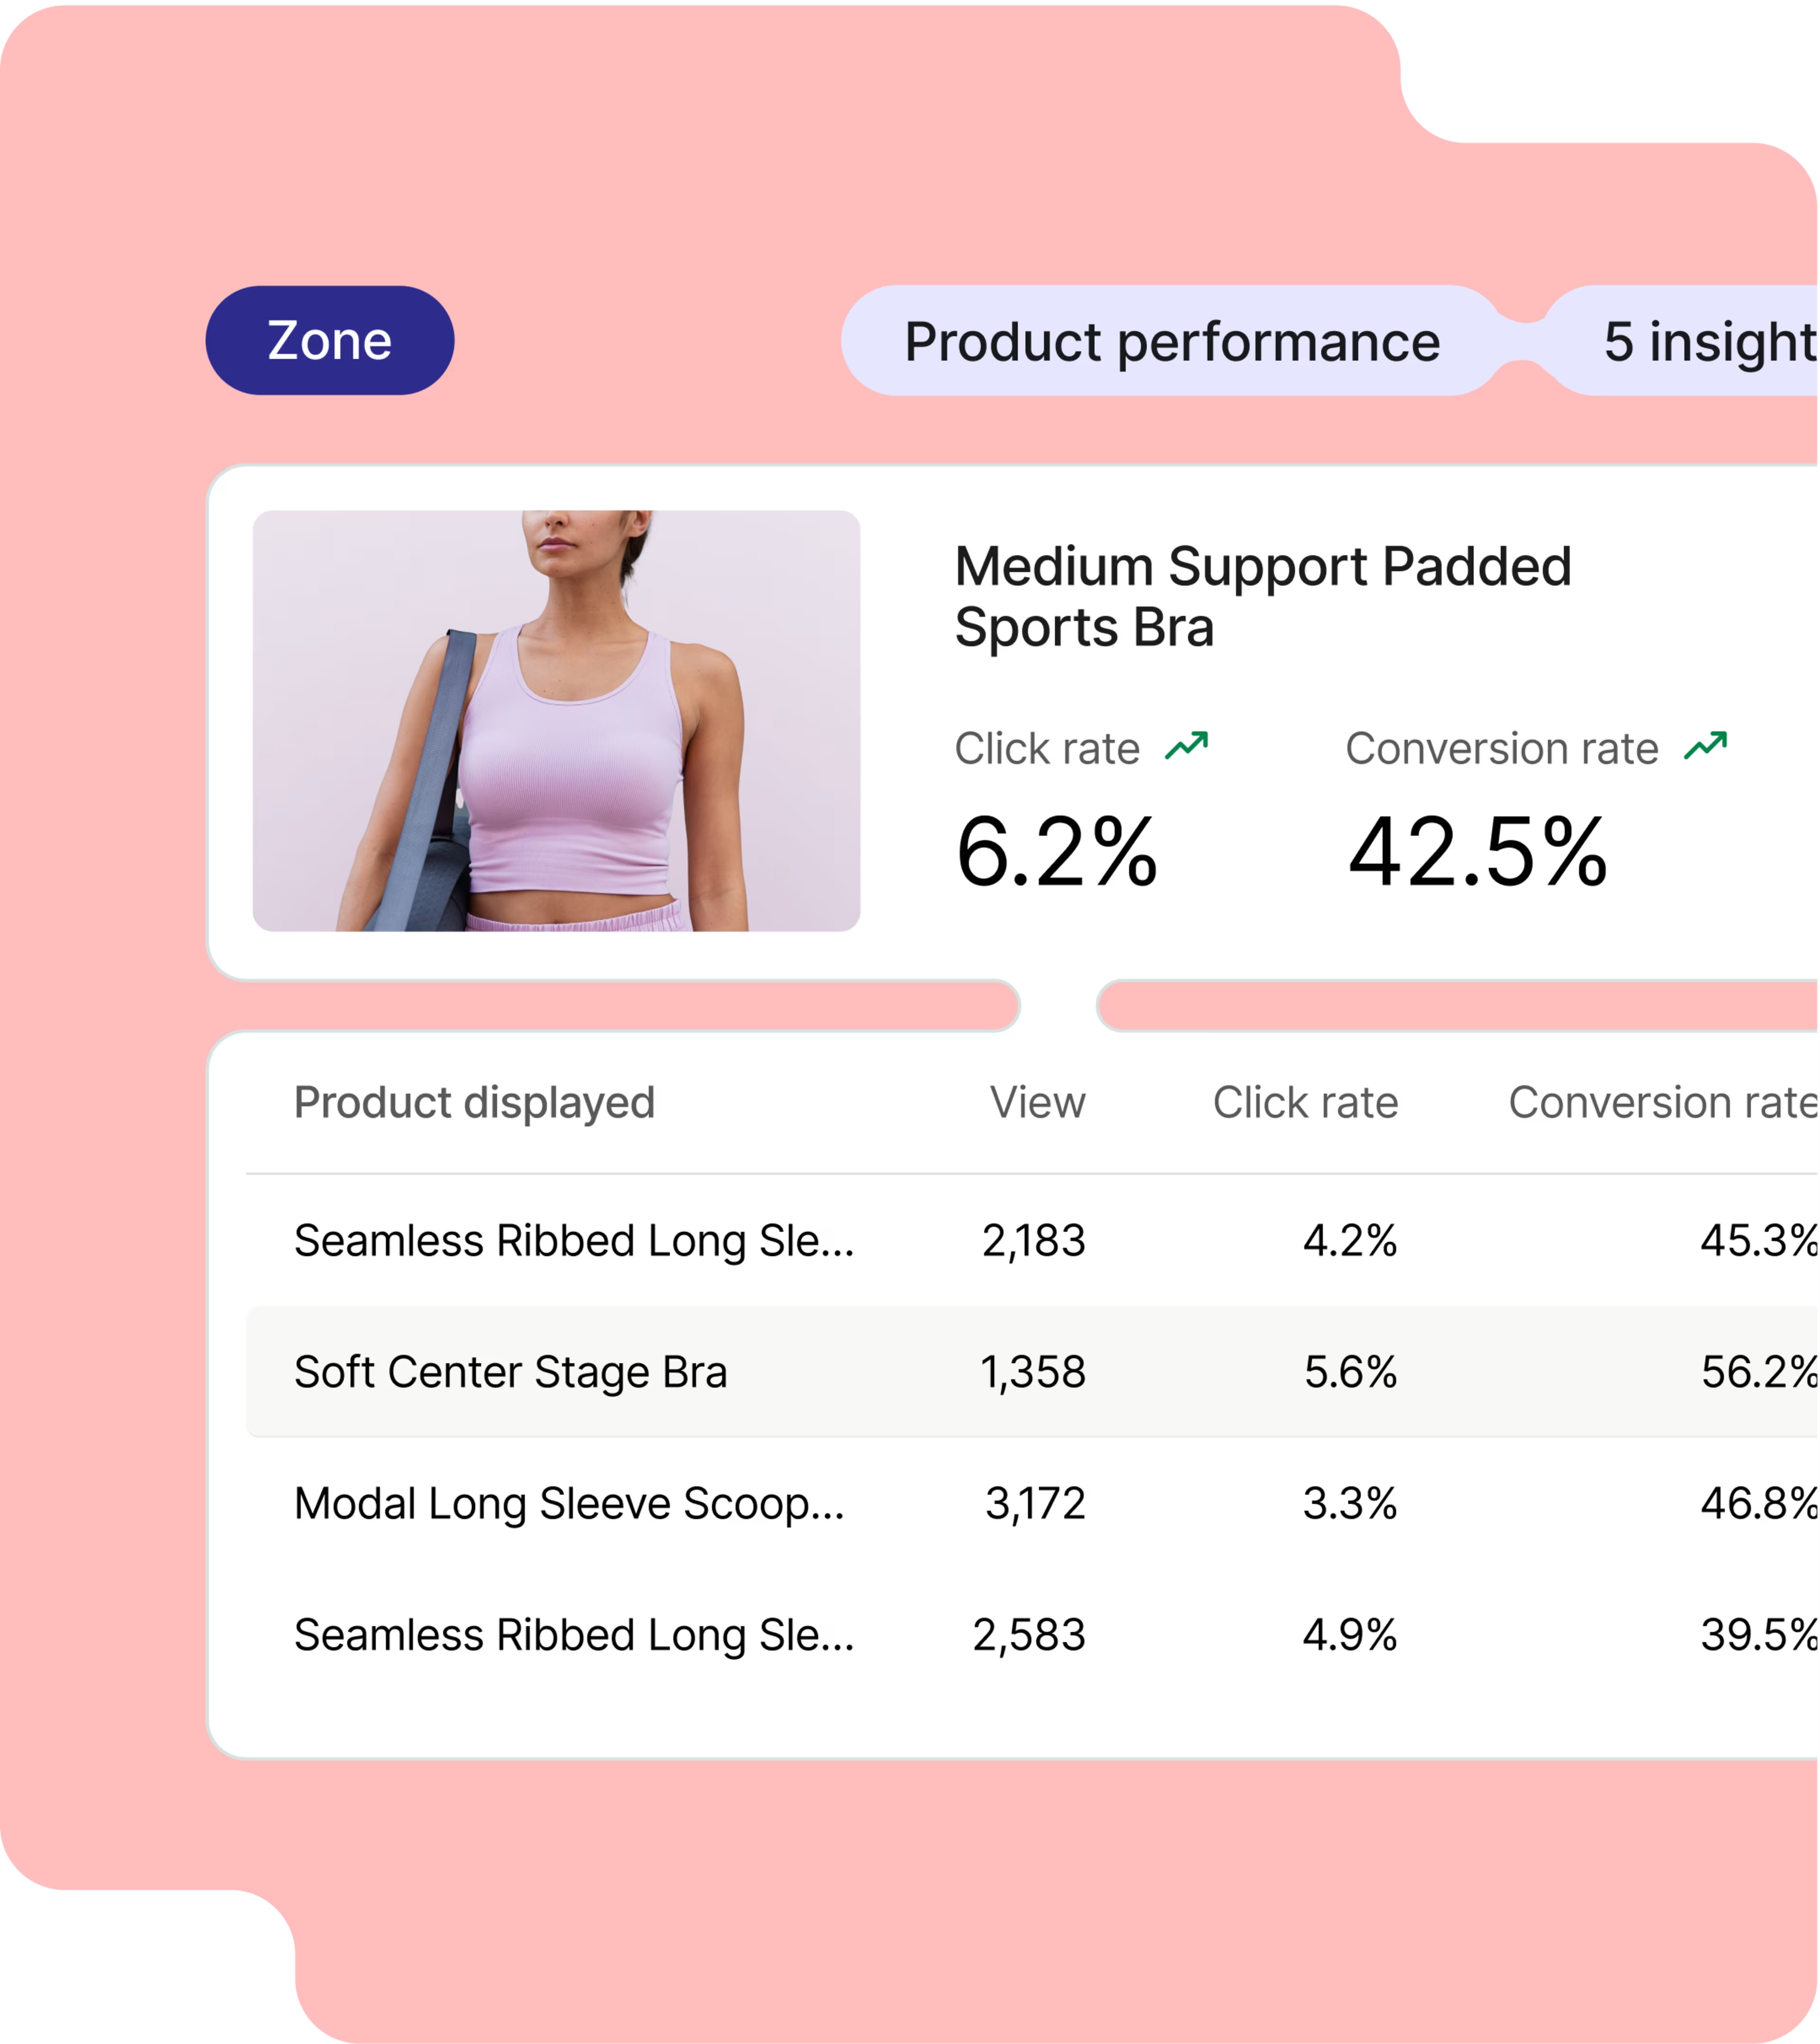
Most analytics tools tell you what users do on your site, but never why. Contentsquare lets you dig much deeper by turning quantitative and qualitative data into usable insights.
Start by checking how many users enter, exit, and convert on any page. Then go a step further and identify the reasons they convert, click, and explore—or why they don’t.
Need deeper answers? Contentsquare’s AI, Sense, lets you pull up visual data and get direct feedback from visitors in one web analytics platform. Goodbye guesswork, hello “aha” moments!
Get real insights without being in the room
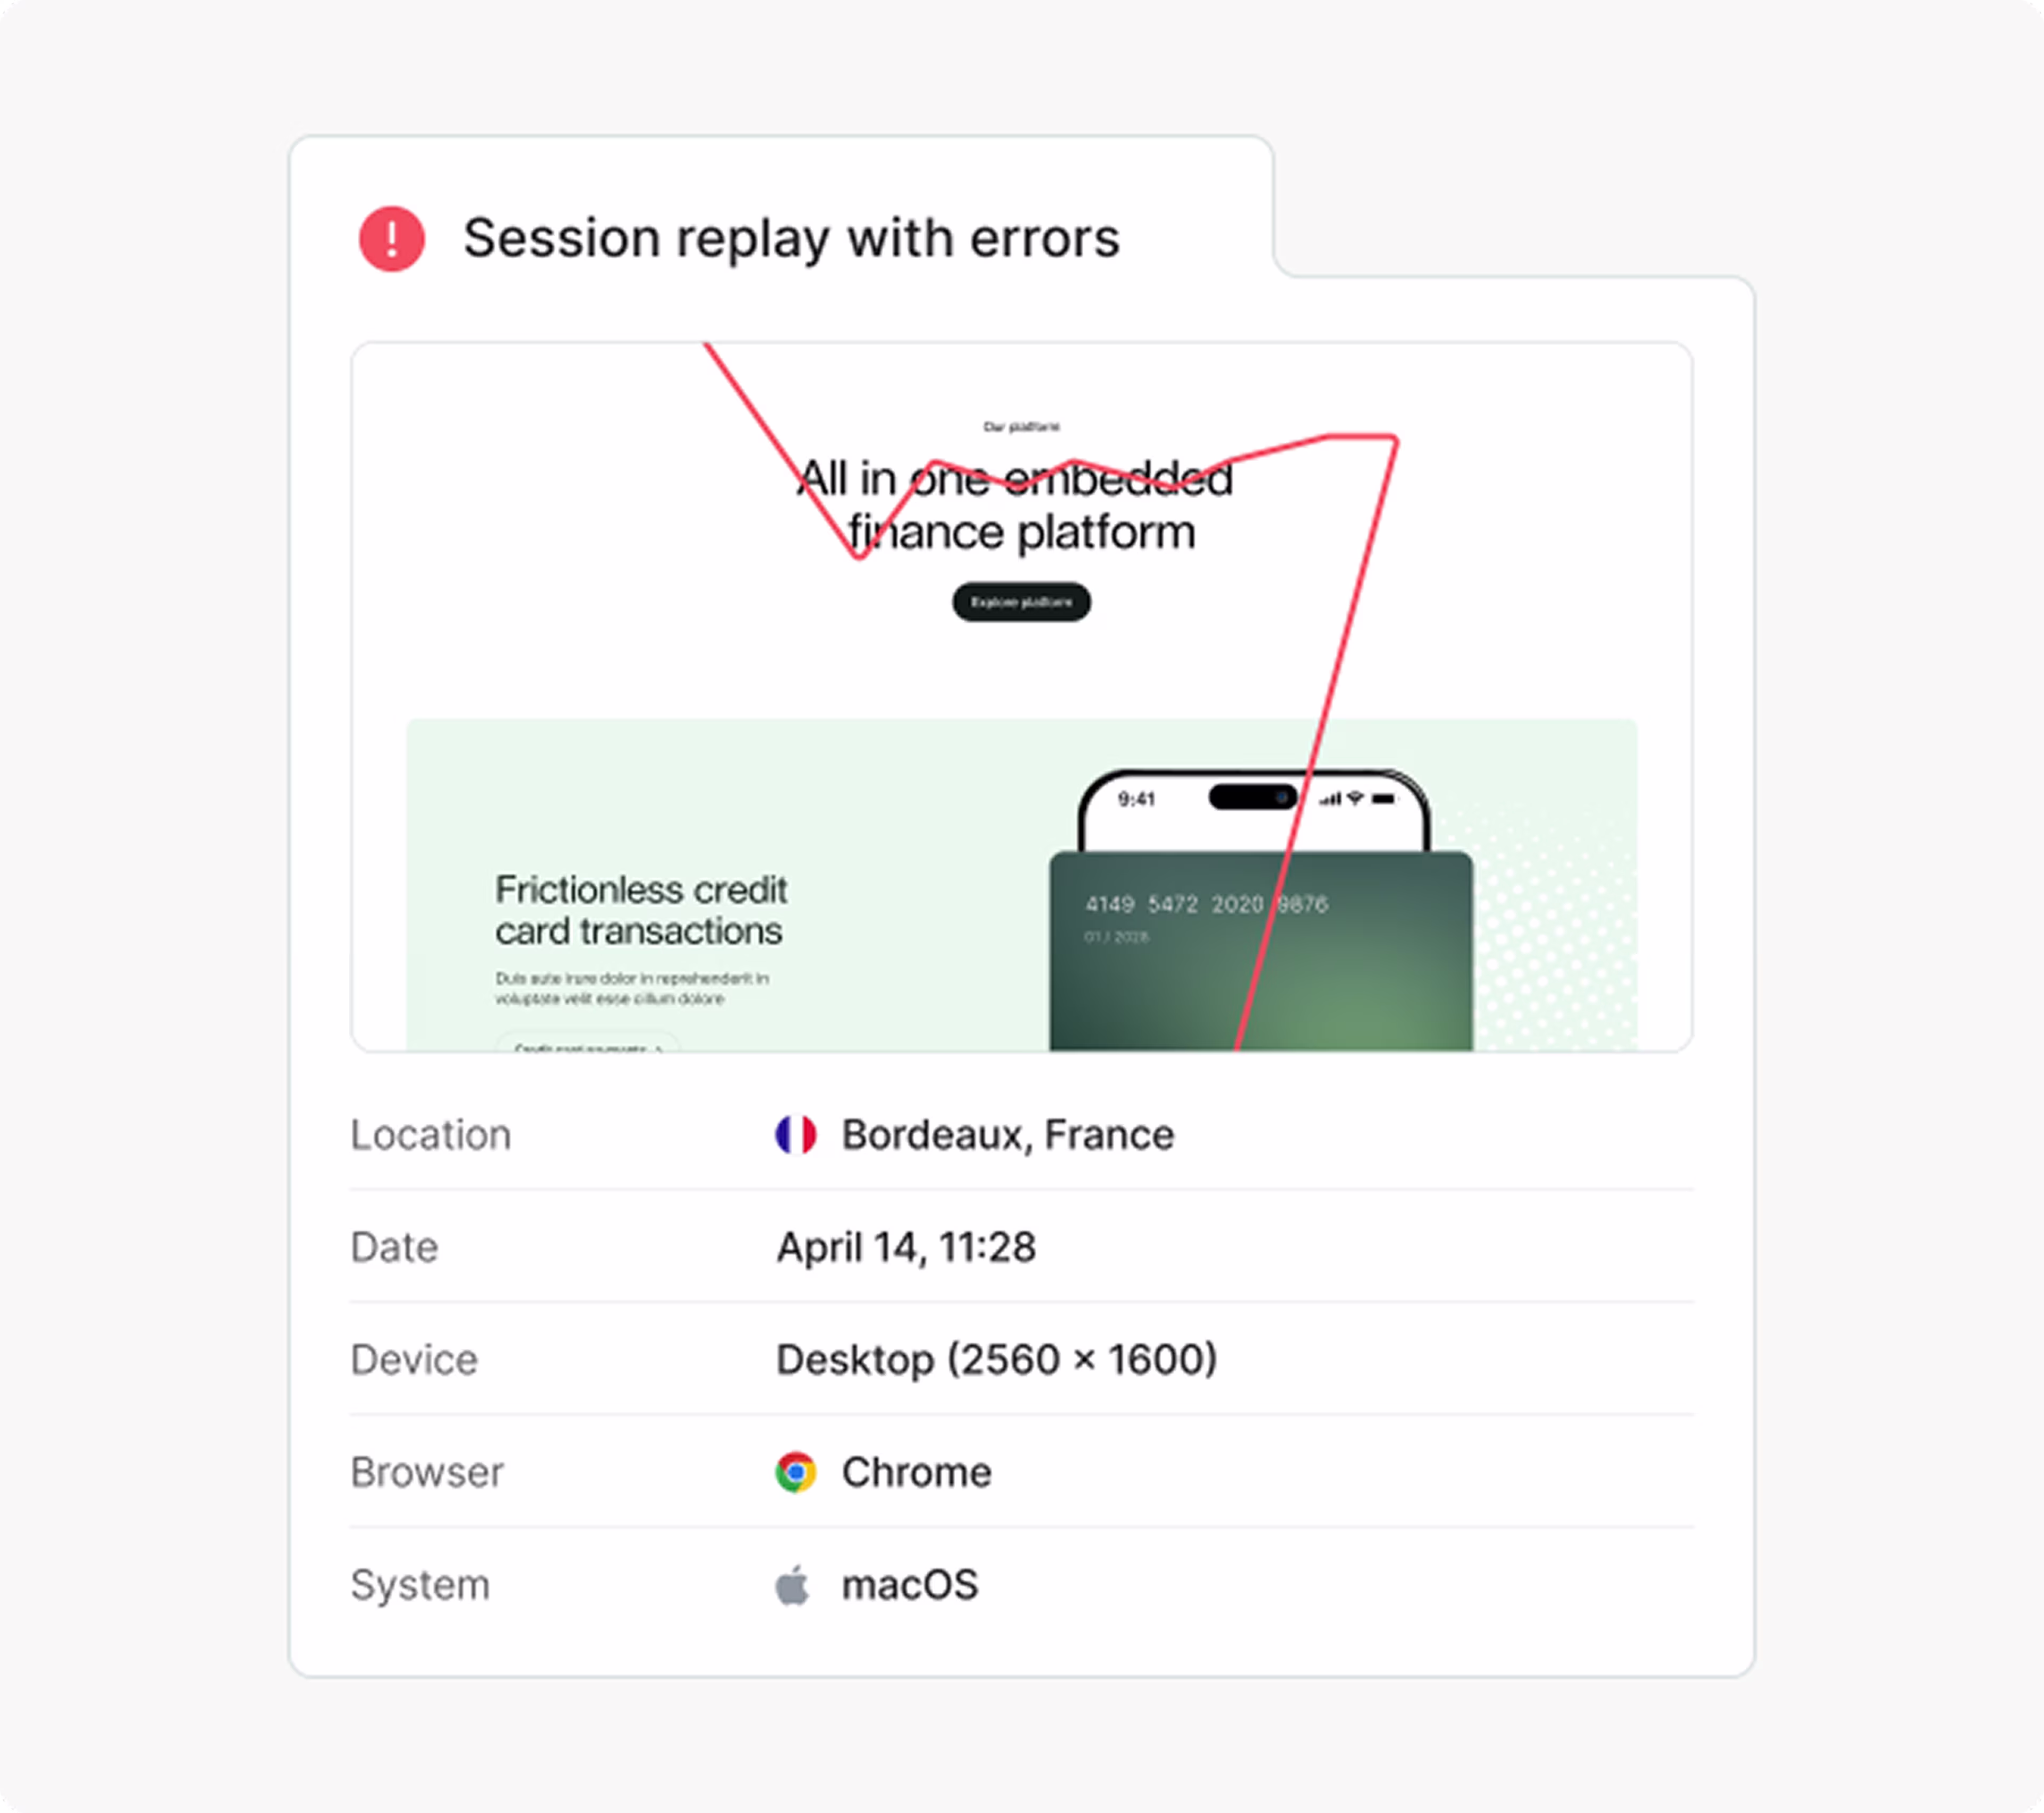
No time for moderated sessions? No problem. Contentsquare’s hands-off testing handles it for you—automatically recruiting users, guiding them through tasks, and collecting feedback. It’s ideal for scaling your research, even across different time zones.
Contentsquare records the user’s voice and screen in each test, so you can hear what they’re thinking whilst seeing their interactions. Everything you need to understand behavior, without having to be there live.
Verify your assumptions with visitor feedback
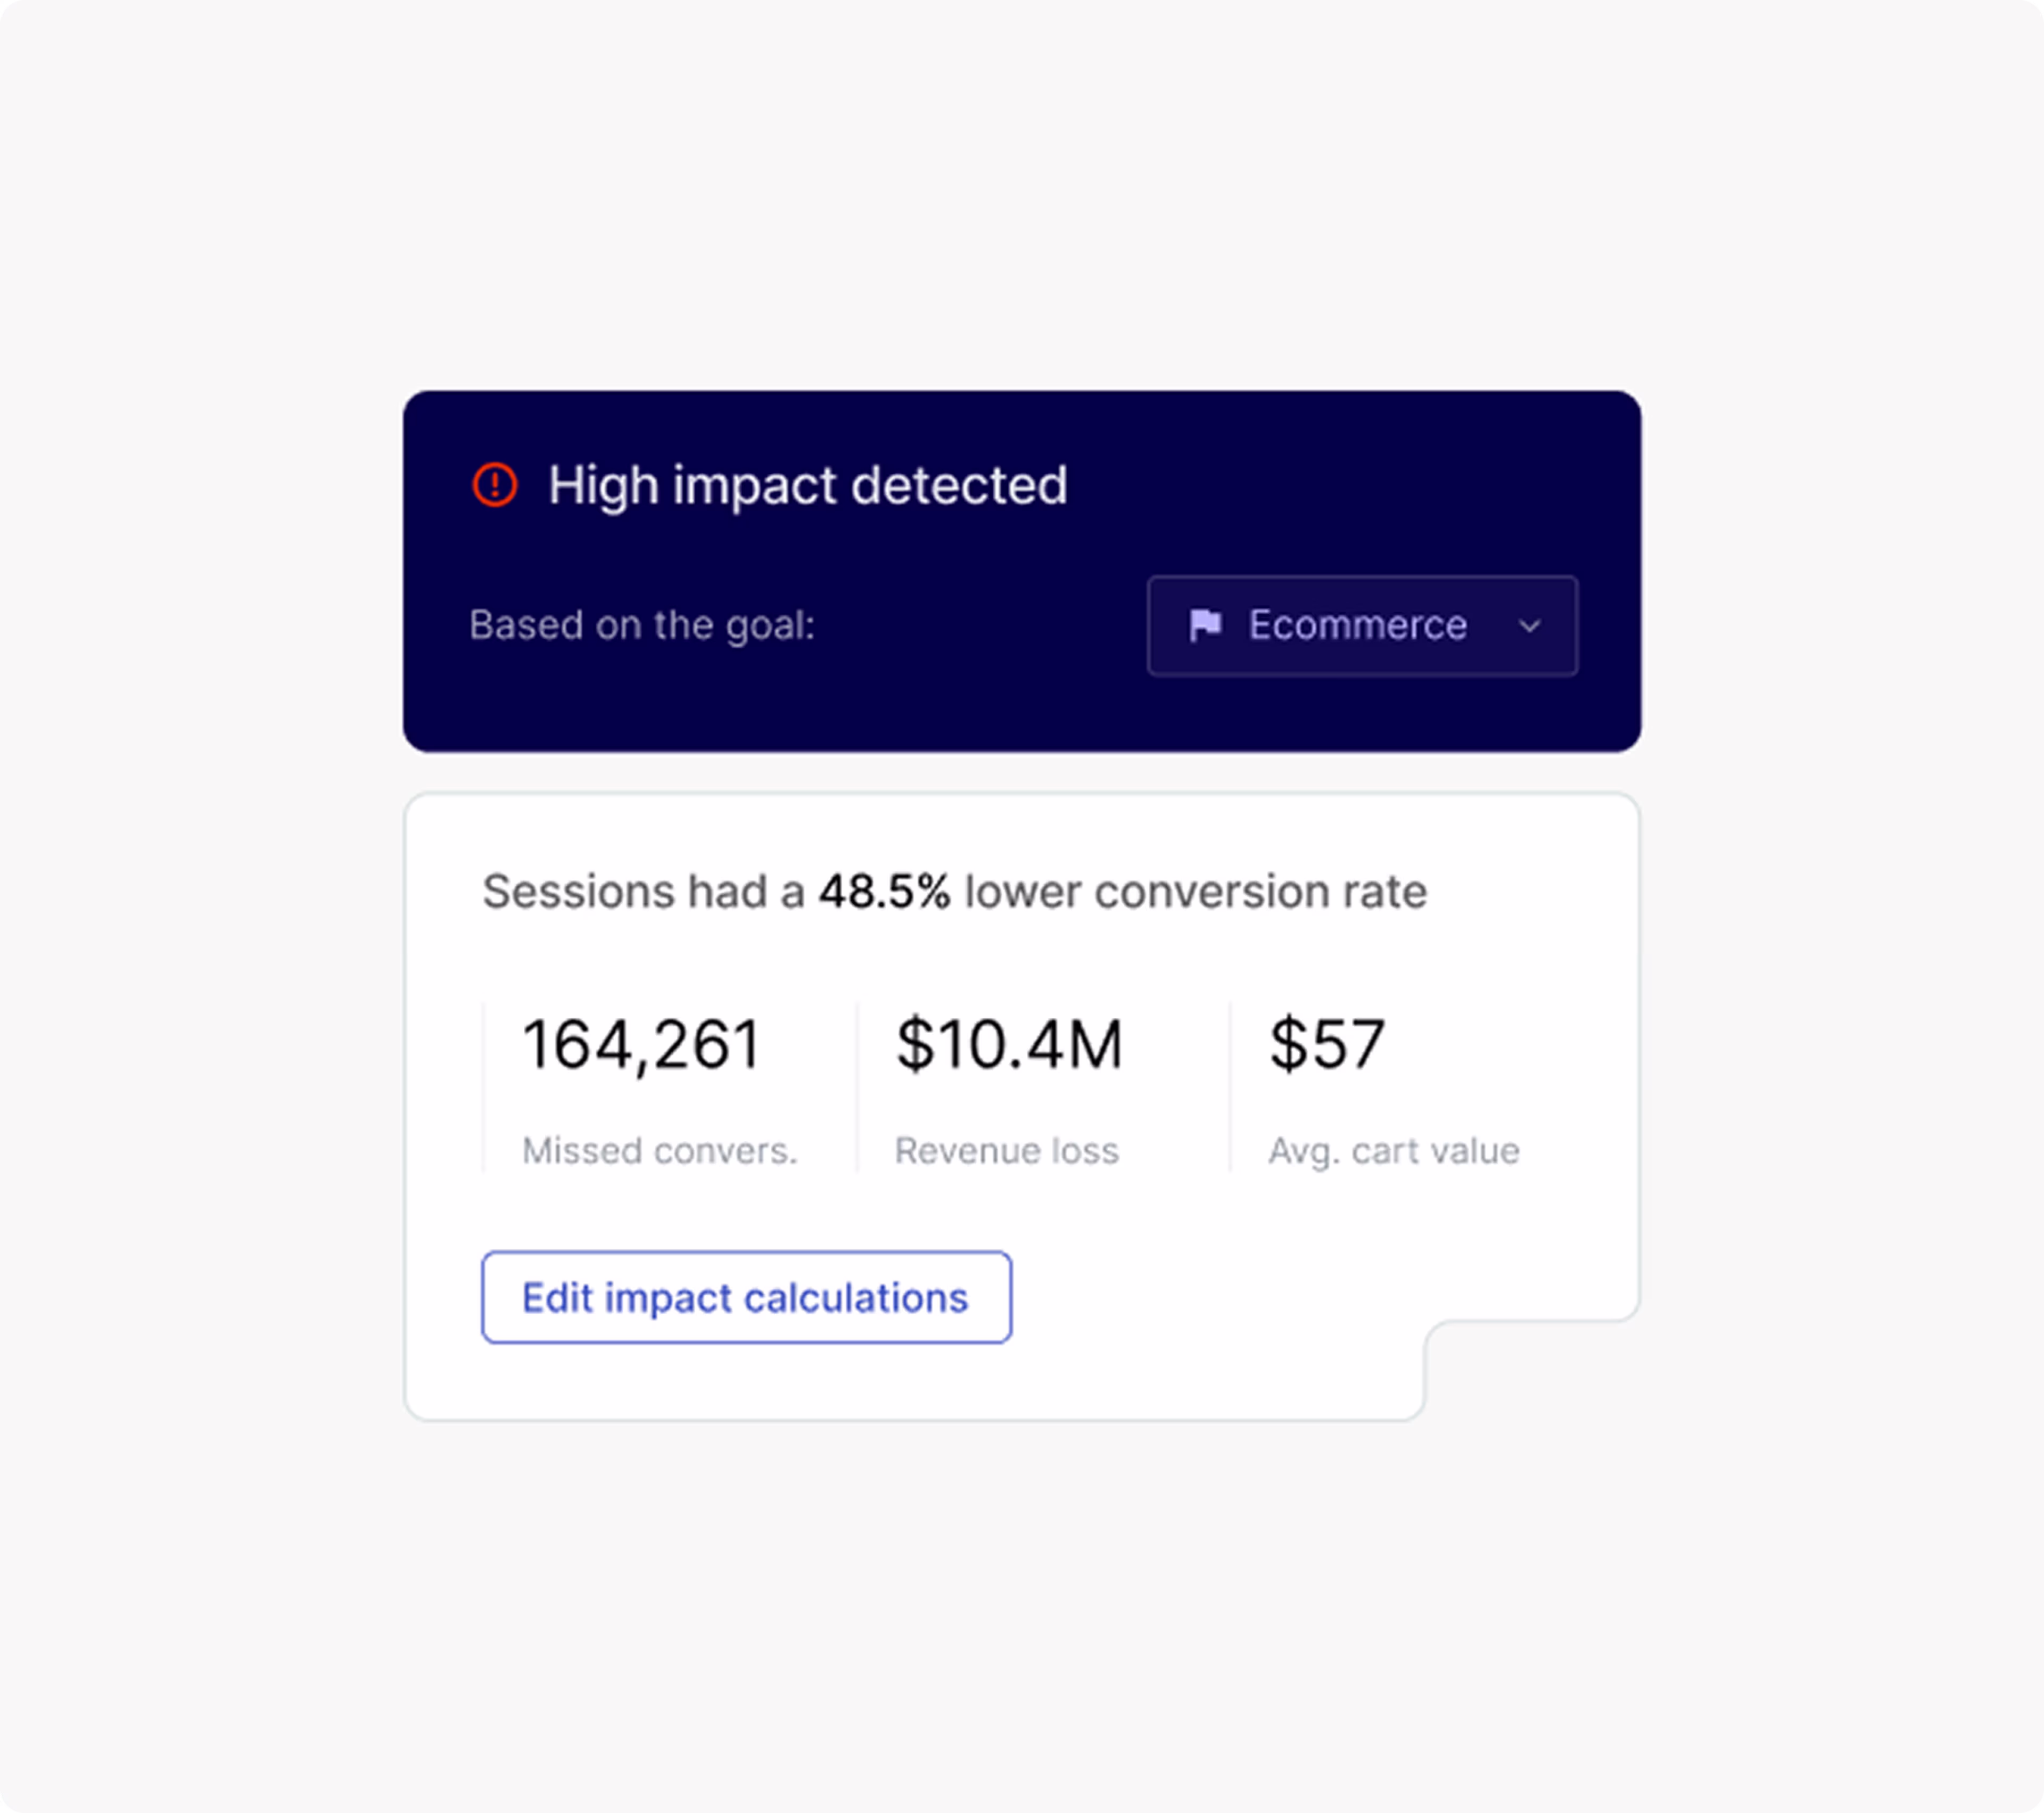
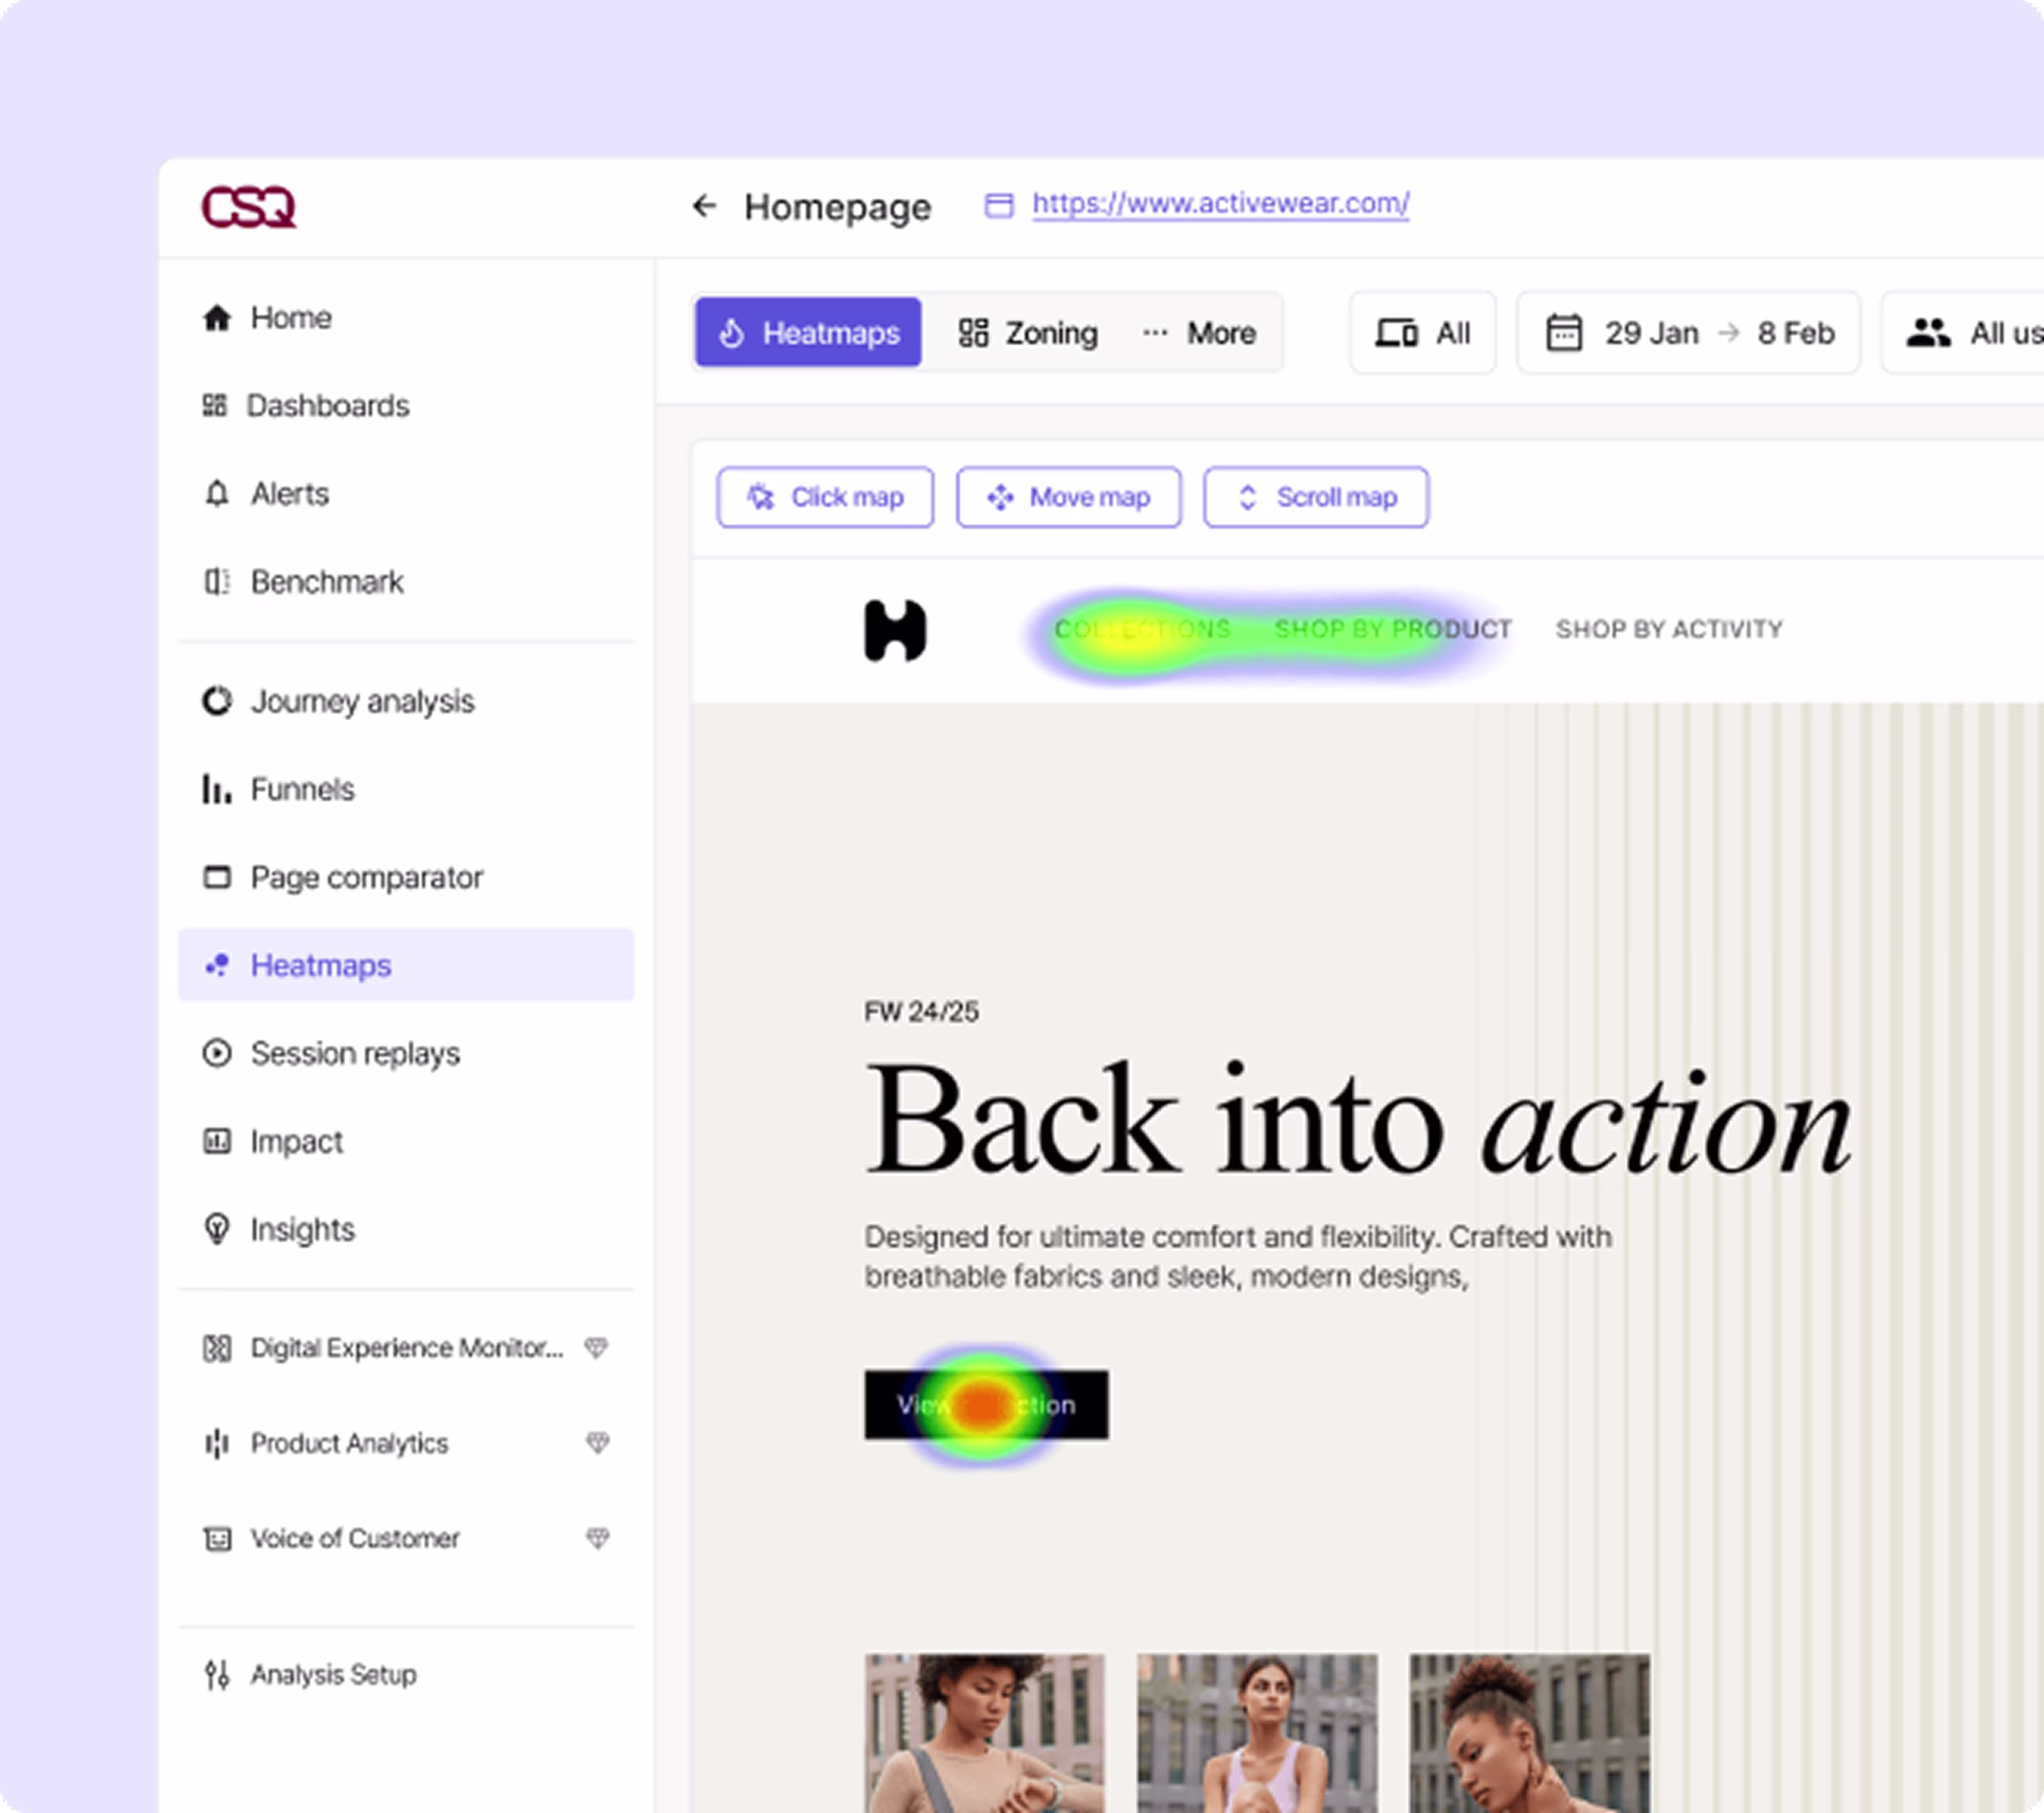
Generate a variety of heatmaps to get a visual overview of how visitors engage with your pages. Quickly spot issues, such as users clicking on the wrong element, not scrolling far enough, or ignoring your call-to-action button.
These insights lead to helpful realizations—like “maybe conversions are low because the pricing table isn’t clear.”
But you don’t have to rely on “maybe.” Instead, validate your assumptions by asking visitors about their experiences. For instance, create surveys within seconds with Sense, Contentsquare’s AI. Or embed a feedback button on your site so that visitors have a direct line to share their thoughts with you.
Understand funnel performance. Meet visitor needs.
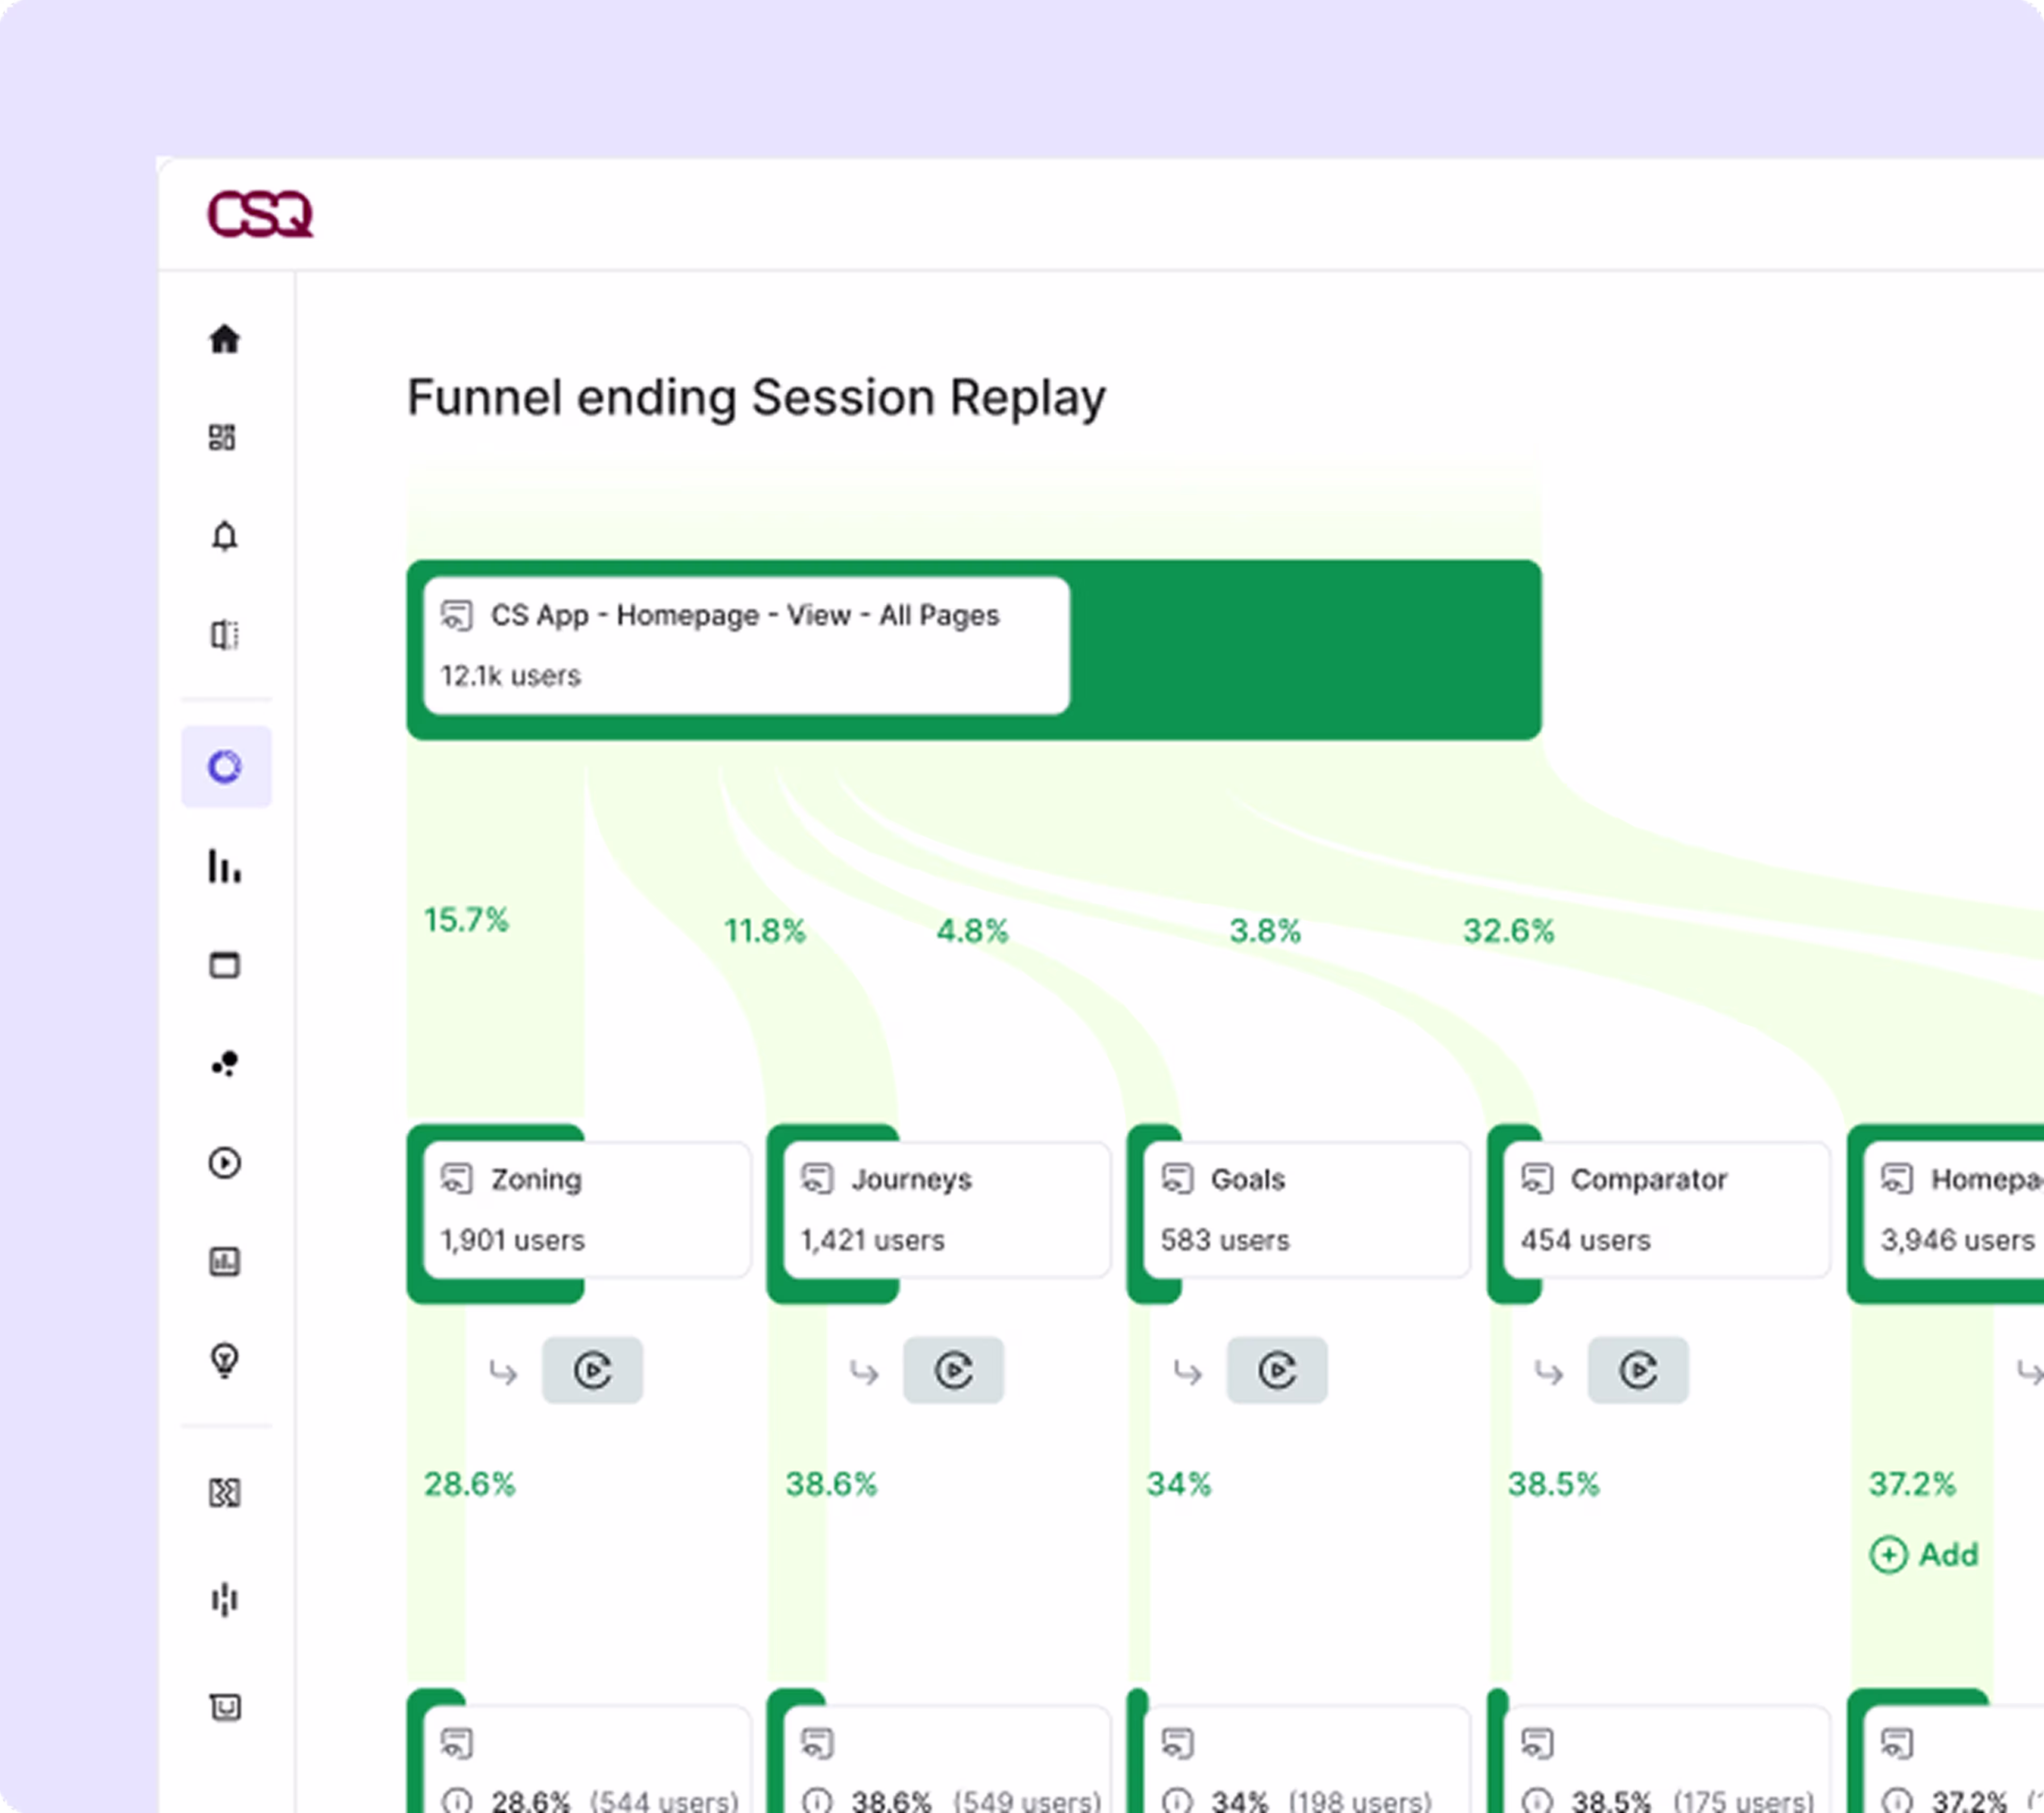
Want to understand the steps visitors take to become paying customers? The Funnel tool has got you covered. Create a conversion funnel to see a visual breakdown of what users do at each step—like whether they’re converting or dropping off.
Do you have a seasonal or high-stakes campaign running? Use the traffic channel filter to compare how visitors from different sources move through your funnel. Then jump directly into Session Replay to watch recordings of their journeys. You’ll see where they are when they hit a “Sign me up!” moment, or when they suddenly leave your site.

Go beyond basic website metrics and get insights you can actually use
With Contentsquare, you combine intuitive visual insights with real customer feedback—so you can make confident decisions that support your goals. Whether that means improving your design, refining your messaging, or creating smoother user journeys.
Ready to ramp up your website performance? Sign up for an account today. You'll get automatic access to five practical analytics tools—Session Replay, Interviews, heatmaps, Surveys, and feedback collection—absolutely free.
“With feedback on the signup page, we spotted bugs we’d never seen before. Suddenly we found users who couldn’t sign up and solved the problem fast.”
Luke Calton
Product Lead
Frequently asked questions
Web traffic analytics is a tool for collecting and interpreting data about who uses your website. It provides anonymized insights around people’s behavior and preferences, such as:
How many visitors you have over a certain period
How long they stay on specific pages
Which content they consume
Which content, element, or step drives them away
How often users return to your site