![[Visual] Churn prevention - stock image](http://images.ctfassets.net/gwbpo1m641r7/1pt2xn0ppryr3YCMcnF22C/58b89c56360789c3df903a756975a35c/AdobeStock_520992702.png?w=3840&q=100&fit=fill&fm=avif)
Understanding the path your users take to become loyal customers is key to unlocking higher conversions and driving sustainable growth.
It's a journey that's often complex and far from a straight line. But by shining a light on every step, you can transform your digital experience from good to absolutely delightful.
Today, we’ll show you how to create a user journey map that gives you an accurate depiction of how users turn from first-time visitors to brand fans.
Key takeaways
The most effective journey maps go beyond tracking user touchpoints—they reveal the why behind user actions, blending behavioral data with direct customer feedback. And emotional cues, like frustration or delight, can be as important as clicks and scrolls as part of your user journey maps.
Regularly revisiting and refining your maps ensures they stay relevant as products, markets, and customer behaviors change. Treat them as living documents—integrating fresh analytics and new customer insights—so your strategy is based on what’s happening now, not six months ago.
Pair journey mapping with experimentation to move from observation to action. Use your maps to identify high-impact areas—such as a stage with heavy drop-off or a CTA that’s often ignored—then design tests to address them. Monitor results closely to validate assumptions, double down on what works, and pivot quickly if changes don’t deliver.
What is the user journey and why does it matter?
The user journey is the entire process a user goes through when interacting with your brand, from their very first touchpoint, like landing on your homepage, all the way to completing a goal, such as making a purchase.
It’s a complex and often non-linear path, involving clicks, form completions, and responses to calls to action.
Think of it like a detective story: you’re piecing together clues from every interaction to understand the full narrative of your customers.
Mapping this journey is crucial because it helps you to:
Create user-centered experiences: anticipate what your customers need and remove obstacles before they even appear
Identify friction points: pinpoint exactly where users get stuck, frustrated, or leave your site
Understand customer needs: gain deep insights into what motivates your audience and what their habits are
Optimize marketing efforts: align your content and messaging to meet users at the right moment with the most suitable information
Boost conversions: ultimately, a smoother, more intuitive experience leads to more completed goals, whether that’s a sale or a signup
Examples of user journey maps
Still unsure what a user journey map might look like? Take a look at this B2B user journey map example from Bright Vessel.
![[Visual] user journey map example](http://images.ctfassets.net/gwbpo1m641r7/3nk9yiWFB1Nnf2xuo3pxRW/fe05d5a45460062209356f9162811364/user_journey_map_example_2.png?w=3840&q=100&fit=fill&fm=avif)
This simple user journey map blends together stages, emotions, questions, and ways they can support each stage.
And here’s a more complex user journey map example for Hewlett Packard.
![[Visual] user journey map example 2](http://images.ctfassets.net/gwbpo1m641r7/6IjkGRxG23FTlv1RpSKSh7/0d1c2634bdb2bd80f2e301ccd86a48f8/user_journey_map_example.png?w=3840&q=100&fit=fill&fm=avif)
And Hotjar shows us that you don’t always need fancy software to create a map. Sometimes, all you need is a marker and some sticky notes.
![[Visual] hotjar-sticky note customer-journey-map](http://images.ctfassets.net/gwbpo1m641r7/3K3CA9TQLp5eKAWnJbA1tb/f30c9af2402d57b78bbf19ccf59b1830/hotjar-customer-journey-map.jpeg?w=1920&q=100&fit=fill&fm=avif)
6-step process for user journey mapping
Creating an effective user journey map requires a clear, deliberate approach. Here are the 6 key stages to guide you:
1. Set goals unique to your business
Before you start drawing any maps, know your destination. Ask yourself: What do you want your customers to achieve on your site or app? What are their jobs to be done (JTBD)?
Your journey map will look different depending on your business model. For example, an ecommerce brand aiming for repeat purchases will have different objectives than a SaaS company focused on subscriptions and renewals.
Knowing your goals upfront ensures you prioritize the most impactful steps for both your customers and your business.
2. Identify your customer segments
Your customers aren't a monolith—they're diverse individuals with unique needs.
Customer segmentation is about grouping users with similar behaviors and goals. This step is foundational because you can't design effective journeys if you don't truly understand who your users are and what they're trying to accomplish.
For B2B businesses, remember that the purchasing process is often nuanced. The end-users of your product might not be the same people making the buying decision, so understand every stakeholder involved.
Contentsquare's segmentation capability allows you to analyze specific user groups, giving you the granular insights needed to inform your user journey maps.
![[Visual][product illustrations] segments](http://images.ctfassets.net/gwbpo1m641r7/7cCsfkeWIrOft8oOb1jqDv/ababc2c7810f40146b64144565cfed05/Segment.svg?w=1920&q=100&fit=fill)
See how different groups of users behave on your site with segments in Contentsquare
3. Define the user journey stages
Once you know your goals and your audience, it’s time to outline the typical stages a customer might go through. While the specifics can vary, most journeys include these phases:
Awareness: this is the discovery phase. Your potential customer realizes they have a need or problem and starts looking for solutions online. Your job here is to provide helpful, informative content that answers their questions, not to hard-sell.
Consideration: in this evaluation phase, customers begin comparing different options. They're looking for buying guides, customer reviews, and product videos. Ensure your site offers this content to help them decide if your product is the best fit.
Decision: this is the selection phase where the buyer is ready to commit. This is your chance to highlight your competitive edge, perhaps through free trials for SaaS products or clear product pages for ecommerce.
Retention: a critical stage where customers decide whether to continue using your product or service and become loyal. For many B2B companies, this is a cyclical and ongoing goal.
Advocacy: the ultimate goal! Loyal customers become brand advocates, recommending your product to others.
You should also define which metrics you’ll track in each stage. Consider these:
Awareness: impressions, campaign cost per million (CPM), reach, website sessions
Consideration: click-through rate, clicks, time on page, bounce rate
Decision: conversion rate, cost per conversion, average order value
Retention: customer satisfaction score, Net Promoter Score® (NPS®), churn rate
Contentsquare's Journey Analysis can help you visualize and explore the entire user journey from start to finish.
You can easily spot common paths that lead to conversions and, just as importantly, areas where users drop off. With sunburst and funnel visualizations, you can zoom out for an overview or dive deep into specific sequences of pages to analyze micro-conversions.
![[visual] Journey Analysis - Segments break down by behavoir or browser](http://images.ctfassets.net/gwbpo1m641r7/5Muy4j91VHoE05F9aR8zRE/a49f9b2919b7e0fdbcfcd9f7b9a73c09/eyJwYXRoIjoiY29udGVudHNxdWFyZVwvZmlsZVwvVWlVb3V1SmtzdFNxeDRHZlFIVDguc3ZnIn0_contentsquare_uVIAMsfg-SoMfrK7iC5NKgnOIw9_DomMb3.svg?w=3840&q=100&fit=fill)
Visualize how users move through your site with Contentsquare’s Journeys
For instance, NatWest used Journeys to pinpoint a high-exit rate on a product page.
Upon further analysis, NatWest noticed that users weren’t clicking on the CTA under the hero image.
![[Visual] Natwest-journey-analysis](http://images.ctfassets.net/gwbpo1m641r7/3T855JR84vBBCV6be4T0xj/8cb4d2855f3d90978898a85028f26c22/Natwest-journey-analysis.avif?w=3840&q=100&fit=fill&fm=avif)
NatWest found high-exit pages with Contentsquare’s Journeys
So, they A/B tested a variant of the page without the hero image. The result? More users clicked on the CTA on the page without the hero image and continued along the user journey.
4. List all possible user touchpoints
A touchpoint is every single point of interaction a user has with your company. This includes everything from a social media post, to your website's homepage, a call-to-action, or the product itself.
To ensure you capture every touchpoint, collaborate across teams. Your marketing and sales teams will know pre-purchase touchpoints, while customer experience teams can shed light on post-purchase interactions.
And keep in mind that different user personas might experience different touchpoints.
Contentsquare's Heatmaps is a powerful visual tool that shows you exactly how users interact with every element on your pages. It captures every click, scroll, and mouse movement to help you identify engagement levels at various touchpoints.
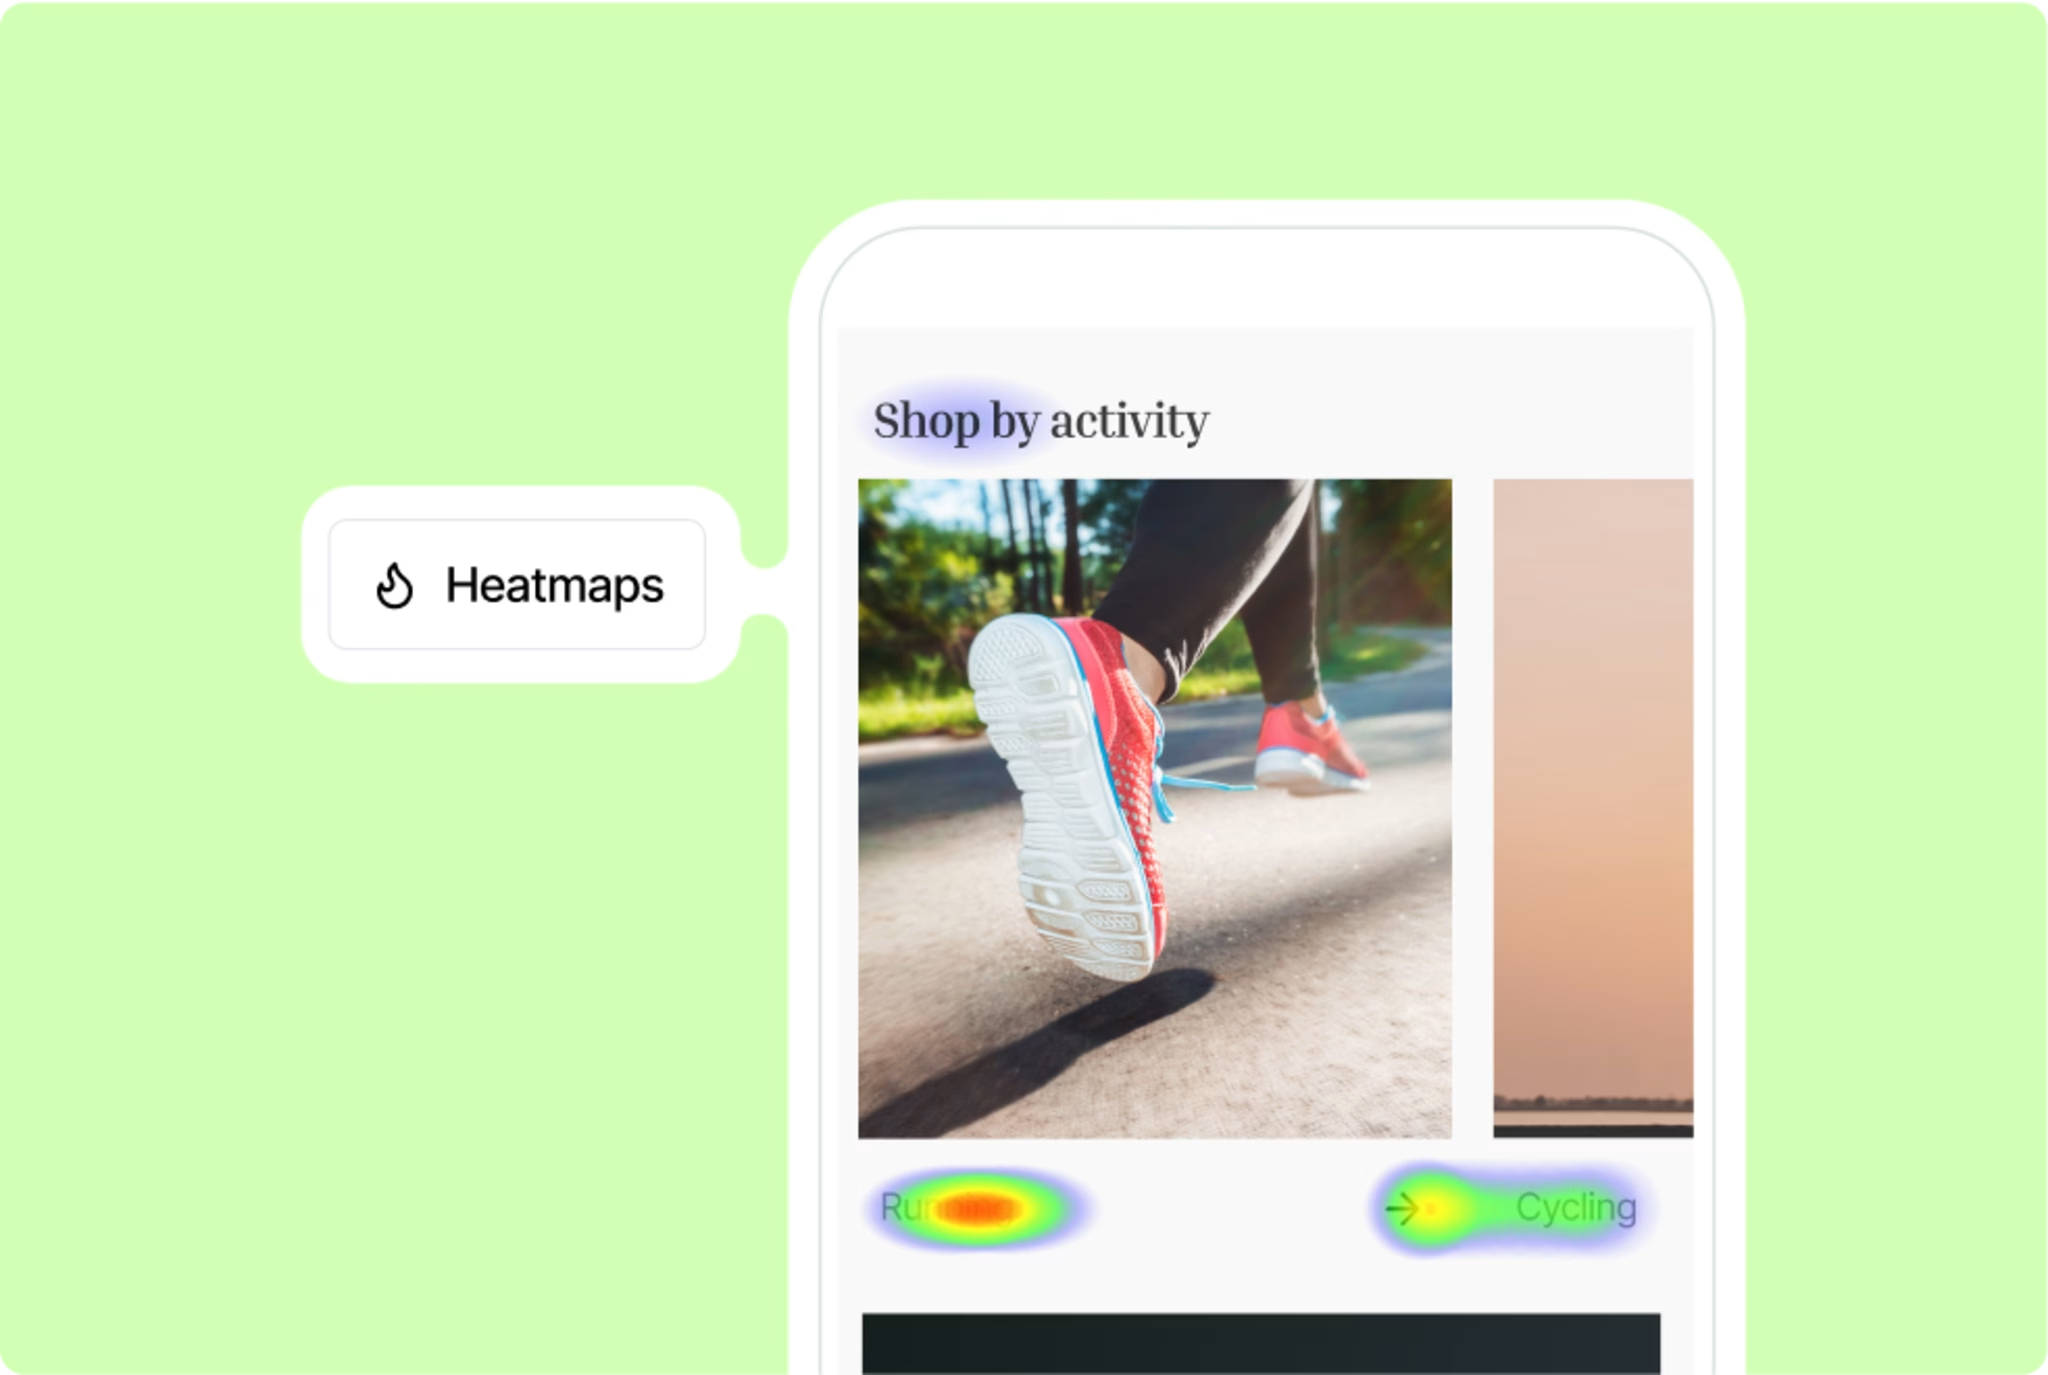
Get a sense of how users interact with your site using Heatmaps
But not only do heatmaps show you which elements users interact with, they also highlight the elements users ignore.
This can help you identify areas of the user journey that are perhaps not working as you intended. Such as an important CTA that people ignore.
Charles Sturt University used heatmaps (alongside Journeys) to find friction points and identify which areas of their login page users weren’t seeing, which helped them formulate a page redesign.
Vaughan Files, Digital Customer Experience Manager at Charles Sturt University, notes that "finding these friction points for users is critical in improving the customer experience and it doesn't always need to be a major design change to get the results.”
5. Map out the user journey
Now, you bring it all together. Start by creating an overarching map, sequencing your key touchpoints and noting how different user personas interact with them. Then, drill down into the details, looking at specific actions on your website or social media.
It's helpful to think of the journey in terms of key functions:
Connect: how do users first engage with your brand?
Attract: how do you persuade them to convert?
Serve: how do you assist customers when they want to purchase?
Retain: how do you foster brand advocacy and customer retention?
You can use tools like Miro or UXPressia to create visuals of your user journey maps.
6. Measure and analyze the success of the user journey
Mapping the journey is just the beginning. The most crucial step is continuously measuring and analyzing its success. This means combining quantitative data (the ‘what’) with qualitative data (the ‘why’) to get a full picture.
Contentsquare’s Experience Analytics offers a comprehensive suite of tools for this:
Journeys helps you spot common paths that lead to conversions and, just as importantly, areas where users drop off. For example, INKEY used it to understand why customers left a bundle builder for a skincare quiz, then adjusted CTAs to improve the journey.
Session Replay lets you watch actual user sessions, providing invaluable context for why users behave the way they do, helping to validate feedback and accelerate bug resolution
Heatmaps show what content is most engaging, where users click (or don't click!), and how different areas contribute to conversion and revenue
Plus, additional tools like Voice of Customer bridge the gap by seamlessly connecting user feedback with behavioral data, helping you understand the emotions behind user behavior.
For even deeper qualitative insights, Contentsquare lets you conduct interviews and unmoderated user tests to understand user needs and pain points.
![[Visual] User Interview](http://images.ctfassets.net/gwbpo1m641r7/3zbgLjTLRN3po3fVyB6Oqv/289ef81612c25eca8a559fa80da5d0a2/User_Interview.png?w=3840&q=100&fit=fill&fm=avif)
Schedule interviews with Contentsquare’s diverse participant pool or invite your own participants to gain a richer understanding of your users
Understand user behavior over time with Product Analytics
The user journey isn’t just about a single session; it often spans multiple interactions, devices, and channels.
Which can be difficult to track on your own.
Contentsquare’s Product Analytics powered by Heap provides a user-focused view across all your touchpoints, giving you a holistic understanding of long-term user behavior.
Here’s what Product Analytics can give you information about:
Cross-session and cross-device journeys: analyze how users progress over time and across different devices, identifying true drop-off points versus mere device switches. This is invaluable for complex journeys and high-consideration purchases.
Retention analysis: understand what drives users to come back and adopt new features. You can monitor key metrics like user retention, average revenue per user (ARPU), and customer lifetime value (CLV).
User segmentation: beyond basic demographics, segment users by their behaviors to personalize experiences and marketing efforts. You can build powerful segments based on their actions, device type, or location.
AI-powered Sense: our AI capabilities, like Chat with Sense, allow you to ask natural language questions about your analytics data and get instant answers and charts. This democratizes data access, making it easier for anyone on your team to get insights without needing advanced analytics expertise.
By bringing all these capabilities together, Contentsquare helps you not just map, but truly master your user journeys, turning browsers into loyal, delighted customers.
6 pitfalls to avoid in user journey mapping
Don't try to map everything at once: start with a broad overview, then drill down into specific details as needed
Don't forget the hidden journeys: customers interact with your brand in ways you might not track directly, like ‘dark social’ communications (anything you can’t see on social media, like direct messages) or word-of-mouth. You can uncover these by directly speaking to your users.
Never make assumptions about customer behavior: always back your hypotheses with real, data-driven insights, combining both qualitative and quantitative data
Don't measure KPIs and forget them: KPIs are signals that should drive continuous prioritization and optimization
Avoid generic industry KPIs: while benchmarks are helpful, tailor your KPIs to your unique business objectives and user needs
For B2B specifically: don't overlook the complexity and length of the B2B user journey, or fail to consider all the diverse user personas and decision-makers involved
Turning insights into action
Mapping user journeys is an ongoing process. It’s a continuous cycle of understanding, optimizing, and improving.
By focusing on the customer, leveraging comprehensive data, and utilizing powerful tools like Contentsquare, you can create seamless, intuitive, and truly delightful experiences that not only meet but exceed expectations.
Remember: your customers are the heroes of this journey, and you're their dedicated guide, ready with the insights they need to succeed.
FAQs about creating user journey maps
Creating a user journey map is a structured process involving several key stages to visualize every interaction a user has with a company and its product. The general steps include:
Setting goals unique to your business
Identifying your customer segments
Defining the user journey stages
Listing all possible user touchpoints
Mapping out the user journey
Measuring and analyzing the success of the user journey
Net Promoter, Net Promoter System, Net Promoter Score, NPS, and the NPS-related emoticons are registered trademarks of Bain & Company, Inc., Fred Reichheld, and Satmetrix Systems, Inc
![[Visual] Contentsquare's Content Team](http://images.ctfassets.net/gwbpo1m641r7/3IVEUbRzFIoC9mf5EJ2qHY/f25ccd2131dfd63f5c63b5b92cc4ba20/Copy_of_Copy_of_BLOG-icp-8117438.jpeg?w=1920&q=100&fit=fill&fm=avif)