![[visual] Follow our step-by-step approach to create customer journey maps that reflect the path users take to turn into loyal customers.](http://images.ctfassets.net/gwbpo1m641r7/vZLaCvfGgcw6q3XbSjjfk/0ffbdd07ba856607573349366b5ca221/5294329__1_.jpg?w=3840&q=100&fit=fill&fm=avif)
Every interaction your visitor has—whether they’re just exploring, comparing options, or ready to commit—should flow smoothly, delighting them every step of the way. With a crystal-clear journey map, you’ll transform hesitation into confidence and clicks into conversions.
This guide explains what defines a user journey and why it matters, and how you can support your users at different stages throughout their journey.
Key takeaways
User journeys are living maps that grow and improve over time. By regularly updating them to reflect new products, changing customer needs, and market trends, you ensure your optimization efforts remain relevant and effective. Continuous refinement helps teams stay ahead and deliver exceptional experiences.
Small optimizations can create big results. Enhancing micro-moments like button placement, form clarity, or page load speed can significantly reduce friction and increase conversions. Focusing on these details ensures users feel guided and supported at every step.
Aligning teams around shared insights amplifies the impact of journey mapping. When marketing, product, design, and support teams collaborate using the same data, improvements happen faster and more consistently.
What is the user journey?
The user journey is the comprehensive process a user undertakes while interacting with your website or application to achieve a specific goal, ultimately leading them to become a loyal advocate.
This journey encompasses every interaction between the user and your brand, from their initial landing on a page to their final conversion and beyond. It's a complex and often non-linear path, involving various actions like clicking links, completing forms, or responding to calls to action (CTAs).
Mapping this journey is crucial for developing user-centered digital experiences that anticipate user needs and eliminate potential barriers to conversion.
Difference between user journeys and user flows
While user journeys offer a broad view of the entire path users take to become users, user flows delve into the specific, detailed steps required to complete a particular task, such as signing up for a free trial or booking a demo.
User flows are essentially detailed components within the larger user journey, and optimizing both is vital for creating a seamless experience, reducing bounce rates, and driving conversions.
Why should you analyze the user journey?
Analyzing the user journey provides several key advantages for your business:
Identifies points of friction: analyzing user journeys helps you pinpoint exactly where users encounter obstacles, which can cause them to leave your site. Research for our Digital Experience Benchmarks report found that sites with the highest retention rates had the fewest rage clicks.
Enhances user understanding: by examining user paths, you gain deeper insights into user needs and habits, allowing you to provide the most relevant content at the optimal time
Optimizes marketing efforts: this understanding enables you to fine-tune your marketing strategies, directing resources toward the most profitable or high-potential opportunities
Drives conversions and satisfaction: ultimately, successfully mapping user journeys improves your user experience (UX), which in turn drives increased conversions and user satisfaction
What are the 5 stages of the user journey?
A typical user journey often involves several key stages, each requiring a tailored approach to provide the best experience.
1. Awareness
This is when a user first realizes they have a problem or need and begins to search for solutions.
During this stage, your brand should focus on providing valuable content—like blog posts, tutorials, or ebooks—that addresses their questions and helps them understand their needs, rather than immediately trying to sell.
2. Consideration
Once users have explored various sources to understand their problem, they move into the consideration stage, where they evaluate different solutions.
Your site should offer content such as buying guides, user reviews, and product videos to help them compare options and determine if your product is the best fit for their budget.
3. Decision
In this final step before conversion, users know exactly what product meets their needs and are ready to make a choice.
It's crucial for your brand to provide content that highlights your competitive advantages, such as free trials for SaaS businesses or detailed product pages for ecommerce.
Social proof, including user testimonials, case studies, and reviews, along with an excellent checkout experience, play a critical role here.
4. Retention
After a user converts, the focus shifts to retaining them. Arguably, they become 'customers' more than 'users' at this stage. This involves ensuring user satisfaction and providing ongoing support.
5. Advocacy
The concept of turning users into loyal advocates is a key outcome of an optimized journey. Encouraging positive feedback and leveraging satisfied users to spread the word about your brand can be a natural extension of strong retention efforts.
User journey metrics to track
Measuring the success of your user journey is essential for continuous improvement. Here are different metrics to track across various stages:
Awareness stage metrics
Impressions: measures how many times people see your content, product pages, or ads. This provides insight into your findability, search ranking, web traffic, and content shareability.
Cost per 1,000 impressions (CPM): helps you understand the cost-effectiveness of your content or campaigns relative to how many users see them, guiding investment decisions for maximum visibility
Reach: describes the number of potential users who could see your content. Understanding reach helps increase brand awareness, minimize campaign risk, fine-tune messaging, and maximize resources.
Consideration stage metrics
Click-through rate (CTR): measures whether users are taking key actions. Optimize CTR by refining headlines and copy, using engaging images, and including clear, attractive CTAs positioned prominently.
Time on page: tracks how long users spend on specific pages, indicating how engaging or useful your content is to them
Bounce rate: shows the percentage of users who leave after viewing only one page, helping identify pages that may need better content or navigation
Clicks: indicates user engagement with website elements, content, links, and CTAs. Heatmaps and Session Replay provide deep insights into where users click, move, and scroll.
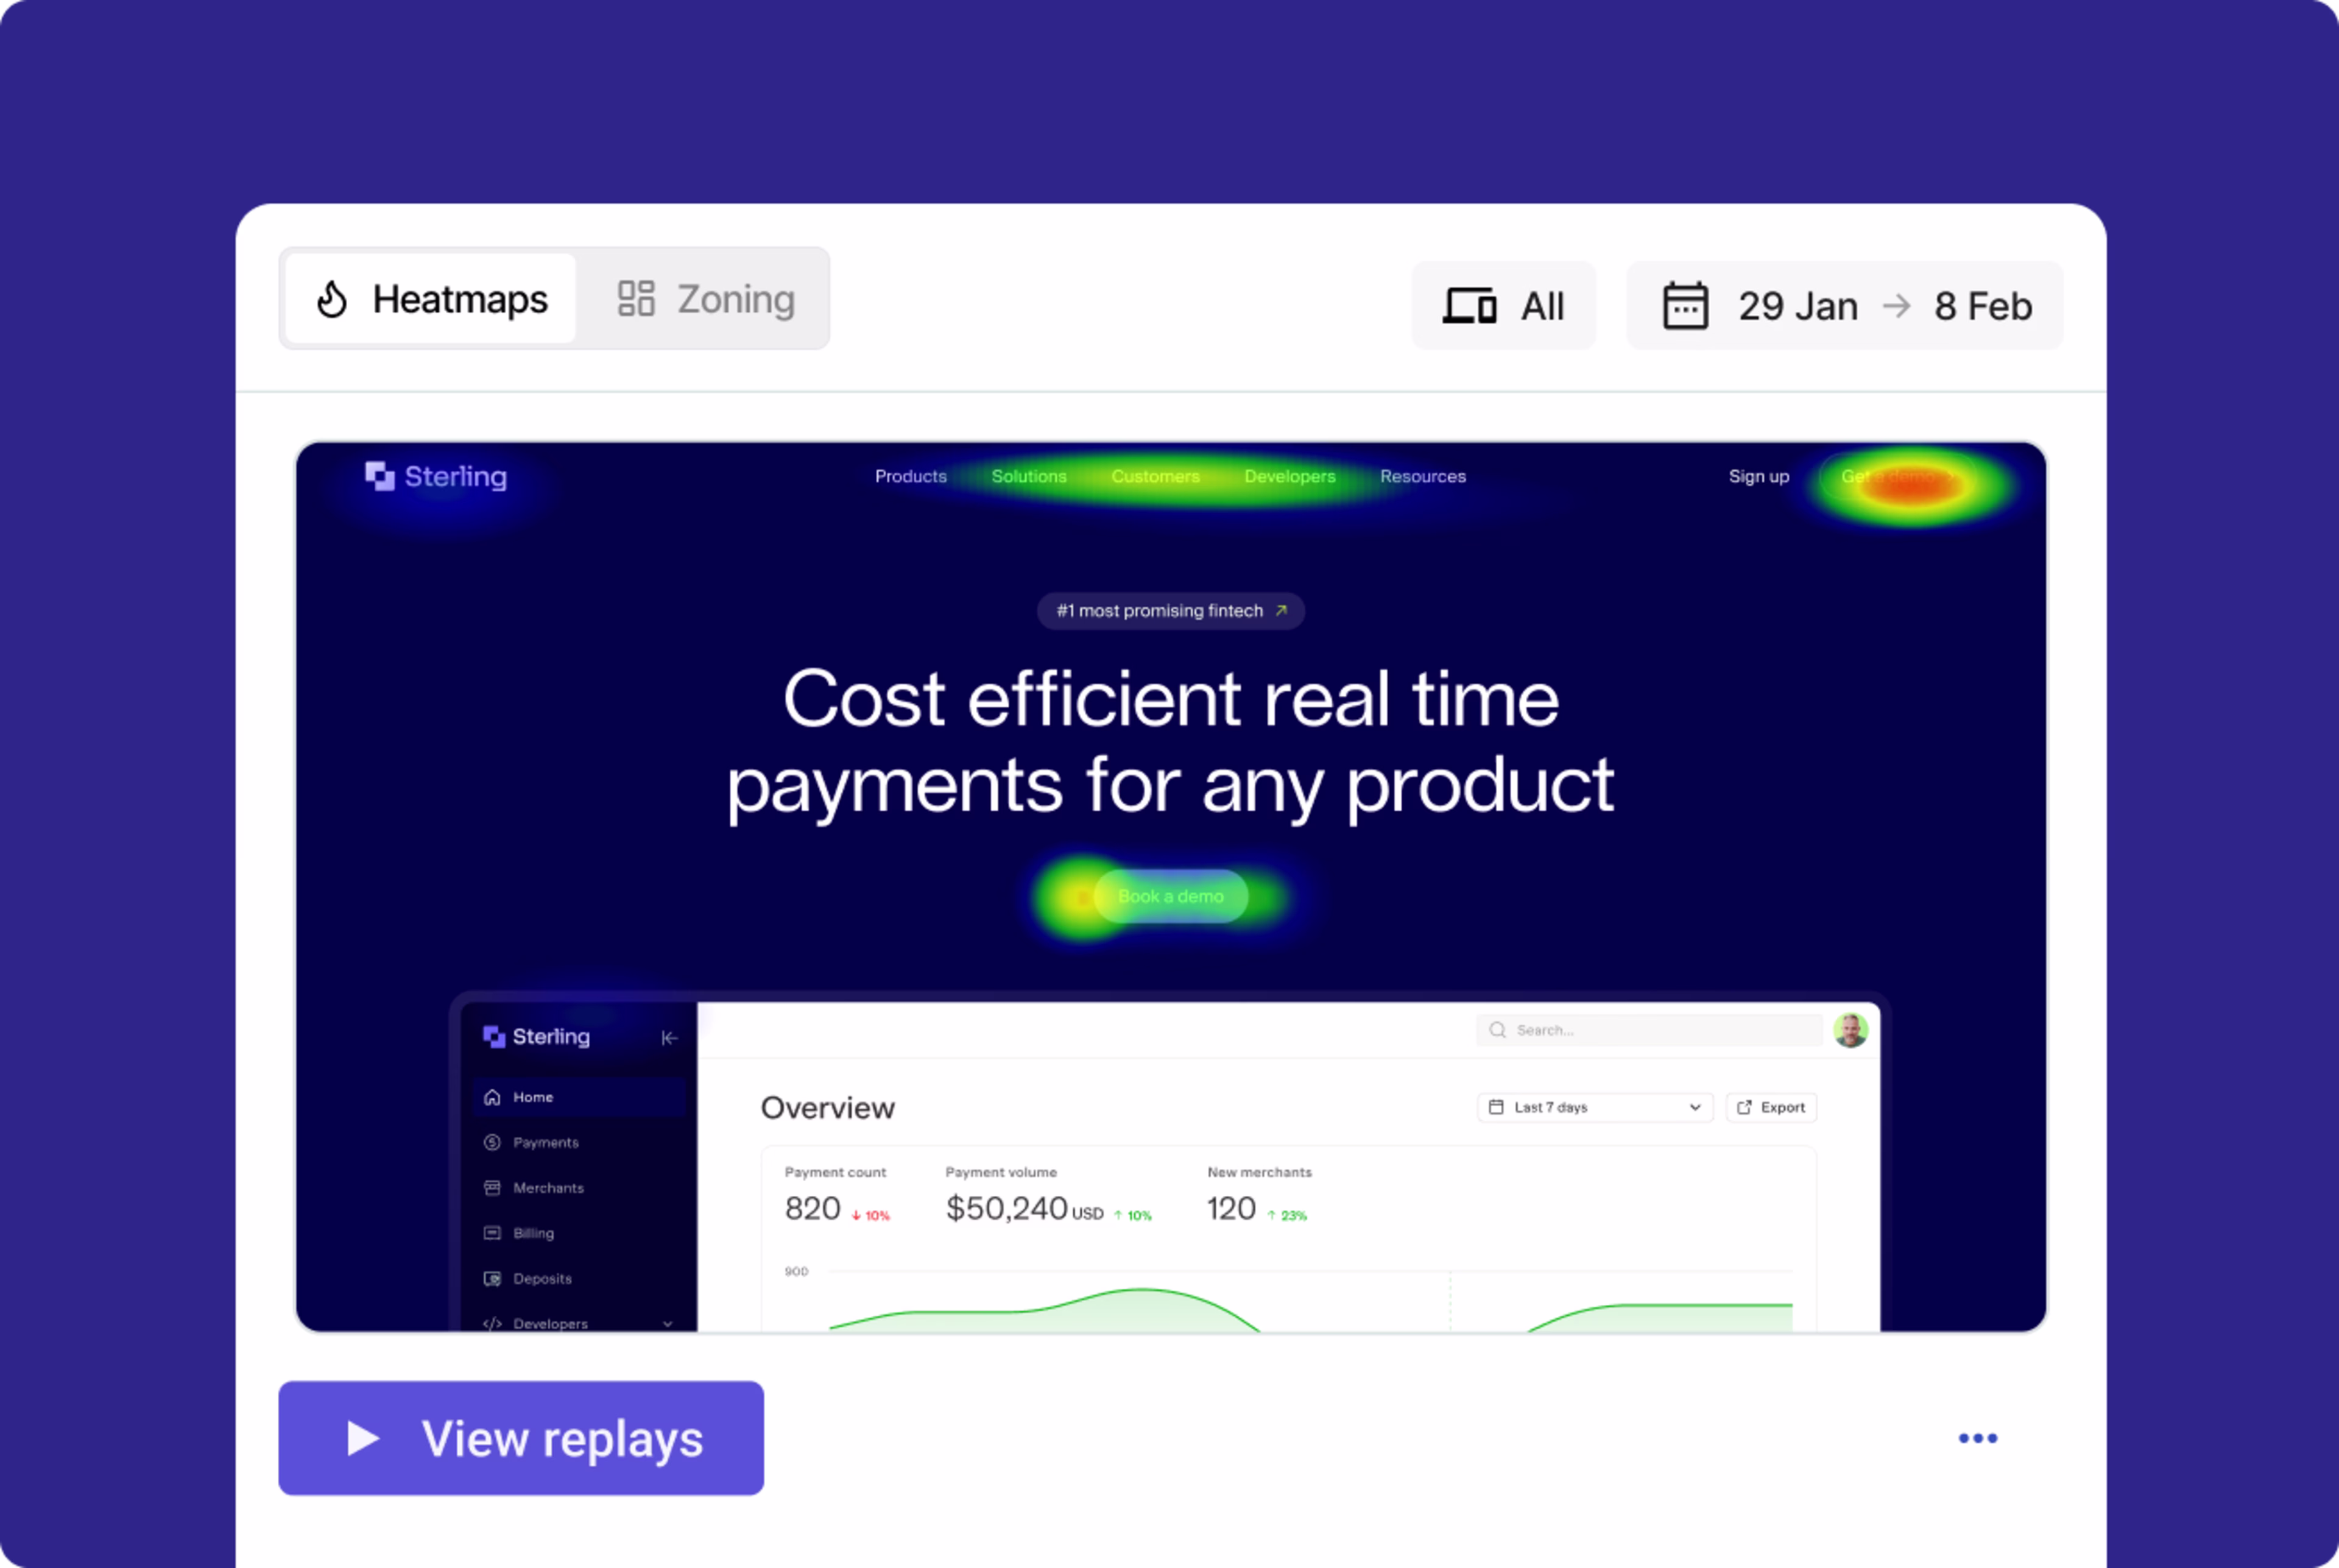
See where people click with Contentsquare’s Heatmaps and see how users actually interact with your site by viewing replays
Decision stage metrics
Conversion rate: the percentage of users who complete a desired action, such as a purchase. A great checkout experience, along with testimonials, case studies, and reviews, are critical for success at this stage.
Cost per conversion (CPC): refers to the total cost of a website element or advertisement in relation to the conversions it generates
Average order value (AOV): calculates the typical purchase amount per customer, providing insight into revenue potential and opportunities for upselling or cross-selling
Retention/post-purchase metrics
Customer satisfaction (CSAT): a score that gauges your customers’ satisfaction levels. Find CSAT using CSAT surveys
Churn rate: measures the percentage of customers who stop using your product or service over a given period, helping identify retention issues and opportunities for improvement
Net Promoter Score® (NPS®): a score that measures loyalty so you know whether your post-purchase retention efforts are paying off
💡 Use Contentsquare's Product Analytics powered by Heap to track metrics.
Product Analytics captures every data point across multiple channels and devices so you’re never left wondering what users are doing.

How to map out the user journey
Creating an effective user journey map is a structured process:
1. Set goals unique to your business
Before mapping, define your overarching business and user goals. Consider what you want users to achieve—whether that’s making a purchase, signing up for a trial, or engaging with your content.
Clarifying these objectives upfront ensures that your journey map is actionable and aligned with measurable outcomes.
2. Define your target audience and user personas
Understand different user profiles and segment your audience. This is particularly important for B2B, where end-users may differ from purchasing decision-makers.
Contentsquare’s tools let you segment your data into different user groups, so you can see how different people behave.
![[Visual] Segmentation segments](http://images.ctfassets.net/gwbpo1m641r7/6AicsoldoxudeD1oF786iJ/ae111191cd248700358a8d2cfe339ee7/Segmentation.png?w=3840&q=100&fit=fill&fm=avif)
Segment your data and see how different groups of users move through your site
You might also consider scheduling interviews with your users. These one-on-one interactions let you get to the heart of their pain points and understand their goals, so you can build your journey maps with empathy.
3. Define the user journey stages
Outline the typical phases users go through, such as awareness, consideration, and decision, as discussed above.
Briefly discuss the user’s goal in each stage, and some key actions they take. No need to get super detailed quite yet—you’ll work on fleshing your map out in the next step.
4. Identify user journey touchpoints
These are every point of interaction a user has with your company and product during each stage.
You likely won’t know all of these touchpoints on your own, so consider collaborating with different teams, like marketing, sales, and user experience, to identify both pre- and post-purchase touchpoints.
5. Map out the user journey
Organize your identified touchpoints in order, showing how various user personas interact with them.
Start with an overarching journey and then drill down into more specific actions.
Contentsquare's Journey Analysis can automatically capture data from all users to visualize common paths, identify pain points like bottlenecks or looping behavior, and compare journeys across different segments.
![[Screenshot] Journeys - Journey Analysis - insights](http://images.ctfassets.net/gwbpo1m641r7/2FUORqw438kCYsl1M2HViQ/904b78442955cf47962c361e7c82e1e2/journey_insights.png?w=3840&q=100&fit=fill&fm=avif)
See how users move through your site and what they do at each step
6. Analyze and optimize
User journey mapping is an iterative process that requires continuous updates to reflect the evolving needs and behaviors of your users.
What works for a business today may not work tomorrow, as customers are constantly changing their needs and behaviors. This continuous observation and adaptation are essential for improvement.
Here’s why:
Evolving user needs: customers' needs and expectations are constantly shifting
Changing behaviors: users interact with digital platforms in new ways over time and your journey map today may not be relevant next year
Product and digital landscape changes: your website, app, and the broader digital environment are dynamic, requiring maps to reflect current states
Avoiding stagnation: continuously questioning your current digital presence and optimizing it keeps you ahead of the competition
You don’t need to redo the entire journey mapping process every few months. Instead, monitor tools like heatmaps, analytics, and session recordings. If you spot anomalies—such as users taking a new path to convert or the emergence of a new user segment—update your map to reflect these changes.
3 pitfalls to avoid when mapping
Avoiding these pitfalls helps ensure your journey maps are accurate, actionable, and truly reflective of how users interact with your brand.
1. Starting too broad
It can be tempting to map out every touchpoint at once, but casting such a wide net often leads to overwhelm.
Begin with a high-level overview of the core journey, then drill down into specific stages or channels as needed. This phased approach ensures clarity and helps you focus on the most critical interactions first.
2. Overlooking hidden interactions
Not every user touchpoint happens on your website or app.
Private conversations, word-of-mouth recommendations, offline events, and third-party channels all shape perceptions of your brand.
To capture these hidden journeys, engage directly with customers—through interviews, surveys, or social listening—to discover where and how they encounter your brand beyond public funnels.
![[Visual] Capabilities - Survey - Asset — Features — AI - How was your experience](http://images.ctfassets.net/gwbpo1m641r7/6eSUQ1pwzyTNv9GWlrISSV/938c95d2cfbe1319a90e7ebc74b9ff6b/AI_analysis.svg?w=1920&q=100&fit=fill)
Get a direct line to your users by launching on-site surveys
3. Relying on guesswork instead of data
Assumptions about what users do can derail your mapping efforts. Rather than crafting scenarios based solely on intuition, lean on quantitative and qualitative data—analytics reports, heatmaps, session replays, and user feedback—to validate each hypothesis.
A data-informed method uncovers real pain points and keeps your journey maps grounded in actual behavior.
Tips for optimizing the user journey
Understanding your customers' digital journey is vital for enhancing their experience and achieving your business goals.
Here are some key tips to optimize the user journey:
Understand your users and their paths
To effectively optimize the user journey, you first need to visualize and understand the actual paths users take through your site or product. This involves identifying typical flows, as well as recognizing where users might deviate, drop off, or get stuck in loops.
Contentsquare's Journeys automatically captures data from every user to reveal common paths, helping you segment by user group or persona.
For instance, NatWest used Journeys to pinpoint a high exit rate on a product page. Then, using Heatmaps, NatWest noticed that many users weren’t seeing the ‘Apply Now’ button on the product page.
“This is the CTA we really wanted people to click on, and yet on some devices, you couldn’t even see it until you scrolled below the fold, so we were really missing a trick there,” says Ollie Mitchell, Digital Experience Manager at NatWest.
Ollie’s team A/B tested a page without the hero image. They also added benefit-rich copy.
This optimization of content and on-page navigation resulted in an uplift in visitor-to-application completion rate. The new variant also reduced the drop-off of the previous page and helped users continue along their journey.
Listen to what your users tell you
Direct feedback from your users is invaluable for understanding their sentiment and ideas. This qualitative data provides crucial context to your quantitative insights.
Contentsquare's Voice of Customer tool helps you continuously discover new ideas and measure satisfaction.
You can quickly create surveys with the AI-powered survey generator, simply by describing what you want to achieve. Voice of Customer also offers various survey types, including Net Promoter Score® (NPS®) surveys to gauge loyalty.
![[Visual] [Survey Goal AI]](http://images.ctfassets.net/gwbpo1m641r7/30i7uF6gKnbjEYq8uJaYPL/ecc49f753c6e217305bf91426765eca8/Screenshot_2025-02-23_003543.png?w=1920&q=100&fit=fill&fm=avif)
Use AI and templates to quickly whip up useful surveys that get you the answers you need to develop accurate user journey maps
Voice of Customer integrates seamlessly with Contentsquare's Session Replay tool. This allows you to watch exactly what a user was doing when they provided specific feedback, helping you understand their struggles and problem solve more efficiently.
Pinpoint and resolve friction points
Even a seemingly small issue can lead to significant customer frustration and lost conversions. It's crucial to proactively detect and address obstacles, whether they are technical glitches or design-related challenges.
Contentsquare's Experience Monitoring solution helps you identify, quantify, prioritize, and solve these obstacles. This includes tools like Error Analysis so you can spot errors impacting the user journey.
![[Visual] Error analysis](http://images.ctfassets.net/gwbpo1m641r7/6ELBPV051gA5ePLDZOiFEG/8352c504a71e140b84d4b0587b2c446c/eyJwYXRoIjoiY29udGVudHNxdWFyZVwvZmlsZVwvZHVGZlF4bWVzMjU0WGhkNXExOXcucG5nIn0_contentsquare_-5dJe5Xqp6vEwH1Gl8wqmZQXmHHT4auNG_.png?w=3840&q=100&fit=fill&fm=avif)
Error Analysis surfaces technical and non-technical errors impacting users
It also features Speed Analysis to improve web performance, as page loading times directly affect user engagement and bounce rates.
Optimize content and design for engagement
Engaging content and intuitive design are key to keeping users on your site and guiding them towards conversion—you need to understand how users interact with every element on your pages.
Heatmaps provide visual insights into user behavior, showing you where users click, hover, and scroll, and which elements are most attractive or receive the most exposure. This helps you understand if important elements are being seen and interacted with, allowing you to optimize layouts and content placement.
![[Visual] [Website engagement] Heatmaps & Engagements](http://images.ctfassets.net/gwbpo1m641r7/7yxjV5CQn0qKYg1iZP1DeL/5c9d7dc4e777f7ae30952bda221fcd59/Heatmaps___Engagements.png?w=2048&q=100&fit=fill&fm=avif)
View different types of heatmaps to get more context around user behavior
Quantify the business impact of changes
Understanding what to fix is only half the battle; you also need to know what matters most to your business. Prioritizing improvements based on their potential impact on revenue and retention is crucial for effective optimization.
Impact Quantification tool translates user issues and site performance directly into tangible revenue impact.
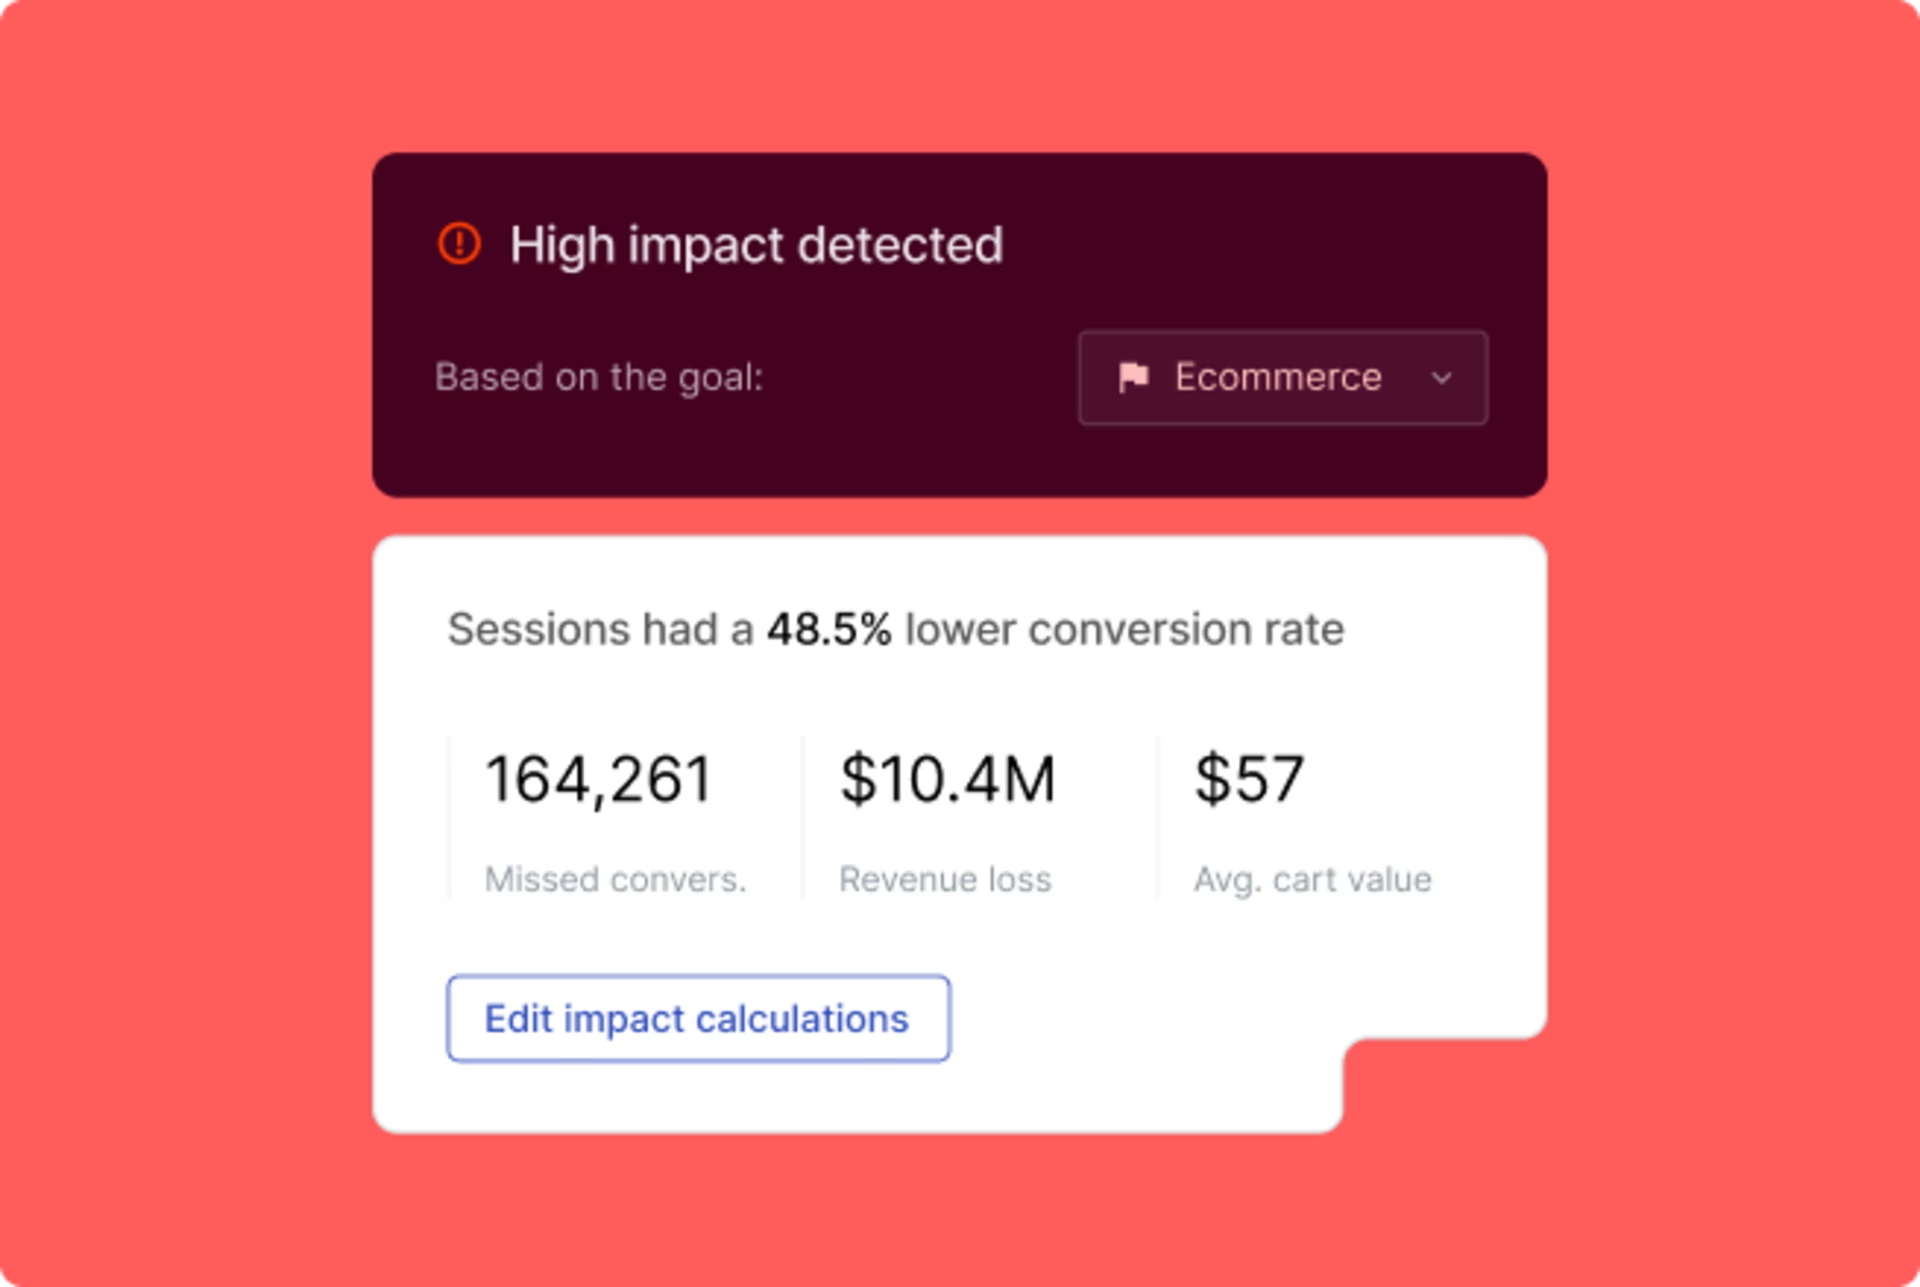
Tie a dollar amount to your site’s performance and prioritize which areas need refinement
By segmenting behaviors and quantifying where users struggle, you can prioritize improvements that deliver the greatest lift to conversions and retention. This helps align teams around common business goals and ensure that resources are invested in the most impactful optimizations.
Foster a data-driven culture
For continuous improvement, insights need to be accessible and actionable for everyone across your organization, not just a few analytics experts.
Contentsquare democratizes data by providing a single source of truth and user-friendly visualizations that make complex data easy to digest—no matter the team or role.
The continuous journey of improvement
Understanding the user journey is fundamental to business success, allowing you to unlock higher conversions, identify points of friction, and enhance the overall user experience. It means gaining deep insights into your buyers, anticipating their needs, and removing barriers to conversion.
To begin optimizing your digital experiences, start mapping your user journeys. By setting clear goals, understanding your customer segments, defining journey stages, identifying touchpoints, and leveraging powerful analytics tools like Contentsquare, you can gain invaluable insights.
Remember, user journey mapping is not a one-time task but an ongoing process for continuous improvement. As products evolve and user behaviors shift, regularly reviewing and refining your journey maps will ensure you stay ahead of the competition and consistently deliver experiences that customers love.
FAQs about user journeys
While often used interchangeably, "user journey" and "customer journey" refer to distinct concepts with different scopes and objectives. The key differences lie in their focus, context, and the goals they aim to achieve.
User journey:
Focus: A user journey is centered on a person's interactions with a specific product or service, typically within a digital environment. It's about the steps a user takes to complete a particular task or achieve a goal.
Scope: It is a narrow view of a user's experience. For example, a user journey would map the path a user takes to sign up for a newsletter on a website, purchase an item in a mobile app, or find a specific piece of information.
Context: It focuses on the usability and efficiency of the product's interface. It concerns understanding what users see, what they do, and what they feel as they navigate a specific system.
Objective: The primary goal is to optimize the user experience (UX) and ensure the product is intuitive and easy to use. Success metrics often relate to task completion rates, user satisfaction, and identifying points of friction within the product.
Customer Journey
Focus: A customer journey is a holistic view of the entire relationship a person has with a brand. It encompasses all interactions, both online and offline, from initial awareness to post-purchase loyalty and advocacy.
Scope: It is a broad, end-to-end perspective. It includes a user's experience with a product, but also interactions with marketing campaigns, customer service, sales teams, social media, and even word-of-mouth.
Context: It considers the customer as a whole, including their thoughts, emotions, and motivations across all touchpoints with the company.
Objective: The goal is to enhance the overall customer experience (CX) to build strong customer relationships, increase satisfaction, and foster long-term loyalty. Success is measured by metrics such as customer satisfaction, retention, and brand advocacy.
Net Promoter, Net Promoter System, Net Promoter Score, NPS, and the NPS-related emoticons are registered trademarks of Bain & Company, Inc., Fred Reichheld, and Satmetrix Systems, Inc

![[Visual] Contentsquare's Content Team](http://images.ctfassets.net/gwbpo1m641r7/3IVEUbRzFIoC9mf5EJ2qHY/f25ccd2131dfd63f5c63b5b92cc4ba20/Copy_of_Copy_of_BLOG-icp-8117438.jpeg?w=1920&q=100&fit=fill&fm=avif)