![[Visual] Frustration Stock image](http://images.ctfassets.net/gwbpo1m641r7/11k60xS0jdvC5YUIGri69k/cb9c99860c58d5459fd2d9d00f5f167a/Defensiveness__one_of_the_greatest_inhibitors_to_true_collaboration.png?w=3840&q=100&fit=fill&fm=avif)
For digital retailers, the reality of dwindling website traffic and stagnating conversions looms large.
In a world where customer journeys are rarely linear and expectations are high, a seamless and engaging experience is paramount.
This guide delves into the current benchmark data on user frustration in the retail landscape and outlines actionable ways Contentsquare’s platform can be used to deliver an engaging and friction-free experience.
Key data on the current state of user frustration on retail sites
According to Contentsquare’s 2026 Digital Experience Benchmarks report:
Experience quality improved meaningfully across retail. Frustration fell -6% year over year, as brands continued to remove obvious sources of friction from sessions
However, improvements are not evenly distributed across sub-industries, highlighting opportunities for some retail sub-industries
Specifically, JavaScript errors caused frustration in 17.8% of retail sessions
Load time frustration was the second most prevalent frustration factor in retail sessions in 2025, impacting 11.6% of sessions. Both have decreased compared to the previous year
Rage clicks were observed in 5.3% of retail sessions for 2025
![[Screenshot] Retail benchmarks frustration](http://images.ctfassets.net/gwbpo1m641r7/3bq74Nd6RU19DBurX6FOPH/de97dd614f54b9afc49fc63093a3afcf/contentsquare__sessions-with-frustration---by-factor_retail.png?w=3840&q=100&fit=fill&fm=avif)
Source: Contentsquare’s 2026 Digital Experience Benchmarks report (filtered by ‘Retail’)
5 strategies for reducing friction and improving user experience
Frustration happens when users encounter friction points on your site, whether from technical errors like slow page loads and Javascript errors or poor user experience (UX).
Here’s how Contentsquare’s experience intelligence platform can help you quickly identify, quantify, and resolve the causes of user frustration on your site.
1. Monitor errors and performance issues
JavaScript errors and slow page loads are common sources of frustration, impacting 36% of all sessions on retail sites, according to Contentsquare’s Benchmarks report.
Reduce technical frictions by tracking site performance in real time with Contentsquare’s Speed Analysis and Error Analysis capabilities.
Speed Analysis lets you track page speed by analyzing relevant metrics like page weight and other Core Web Vital indicators.
![[Visual] Speed Analysis & Improvements](http://images.ctfassets.net/gwbpo1m641r7/3jmq50umWVasSMqnBb56fk/a22722e210677f5530f79dbce1f37434/Speed_Analysis___Improvements__2_.png?w=3840&q=100&fit=fill&fm=avif)
Error Analysis highlights pages and sessions with errors, then lets you dive deeper into their cause and how to fix them.
![[Product screenshot] Error analysis - Mobile](http://images.ctfassets.net/gwbpo1m641r7/FHE26l0YrkilHY2qWhz4T/7432bc03e679fe499f47fa8f3eeb23bb/-Product_screenshot-_Error_analysis_-_Mobile.png?w=3840&q=100&fit=fill&fm=avif)
Andrew Taylor, VP of Product at Contentsquare, says the platform not only flags these technical errors, but also combines them with behavioral data to show the impact on customer experience.
“We’ve taken technical data that’s often a very complex subject, and combined that with visual data…making it easy to digest,” he says.
💡Pro tip: error and speed issues usually have different causes depending on the user’s device. Filter your analysis by device to spot how many sessions are impacted before prioritizing which issues to resolve first.
2. Prioritize fixes that matter most
Not all friction points have the same impact. Contentsquare's Impact Quantification capability and frustration score feature help you identify which pain points are impacting conversions or revenue the most.
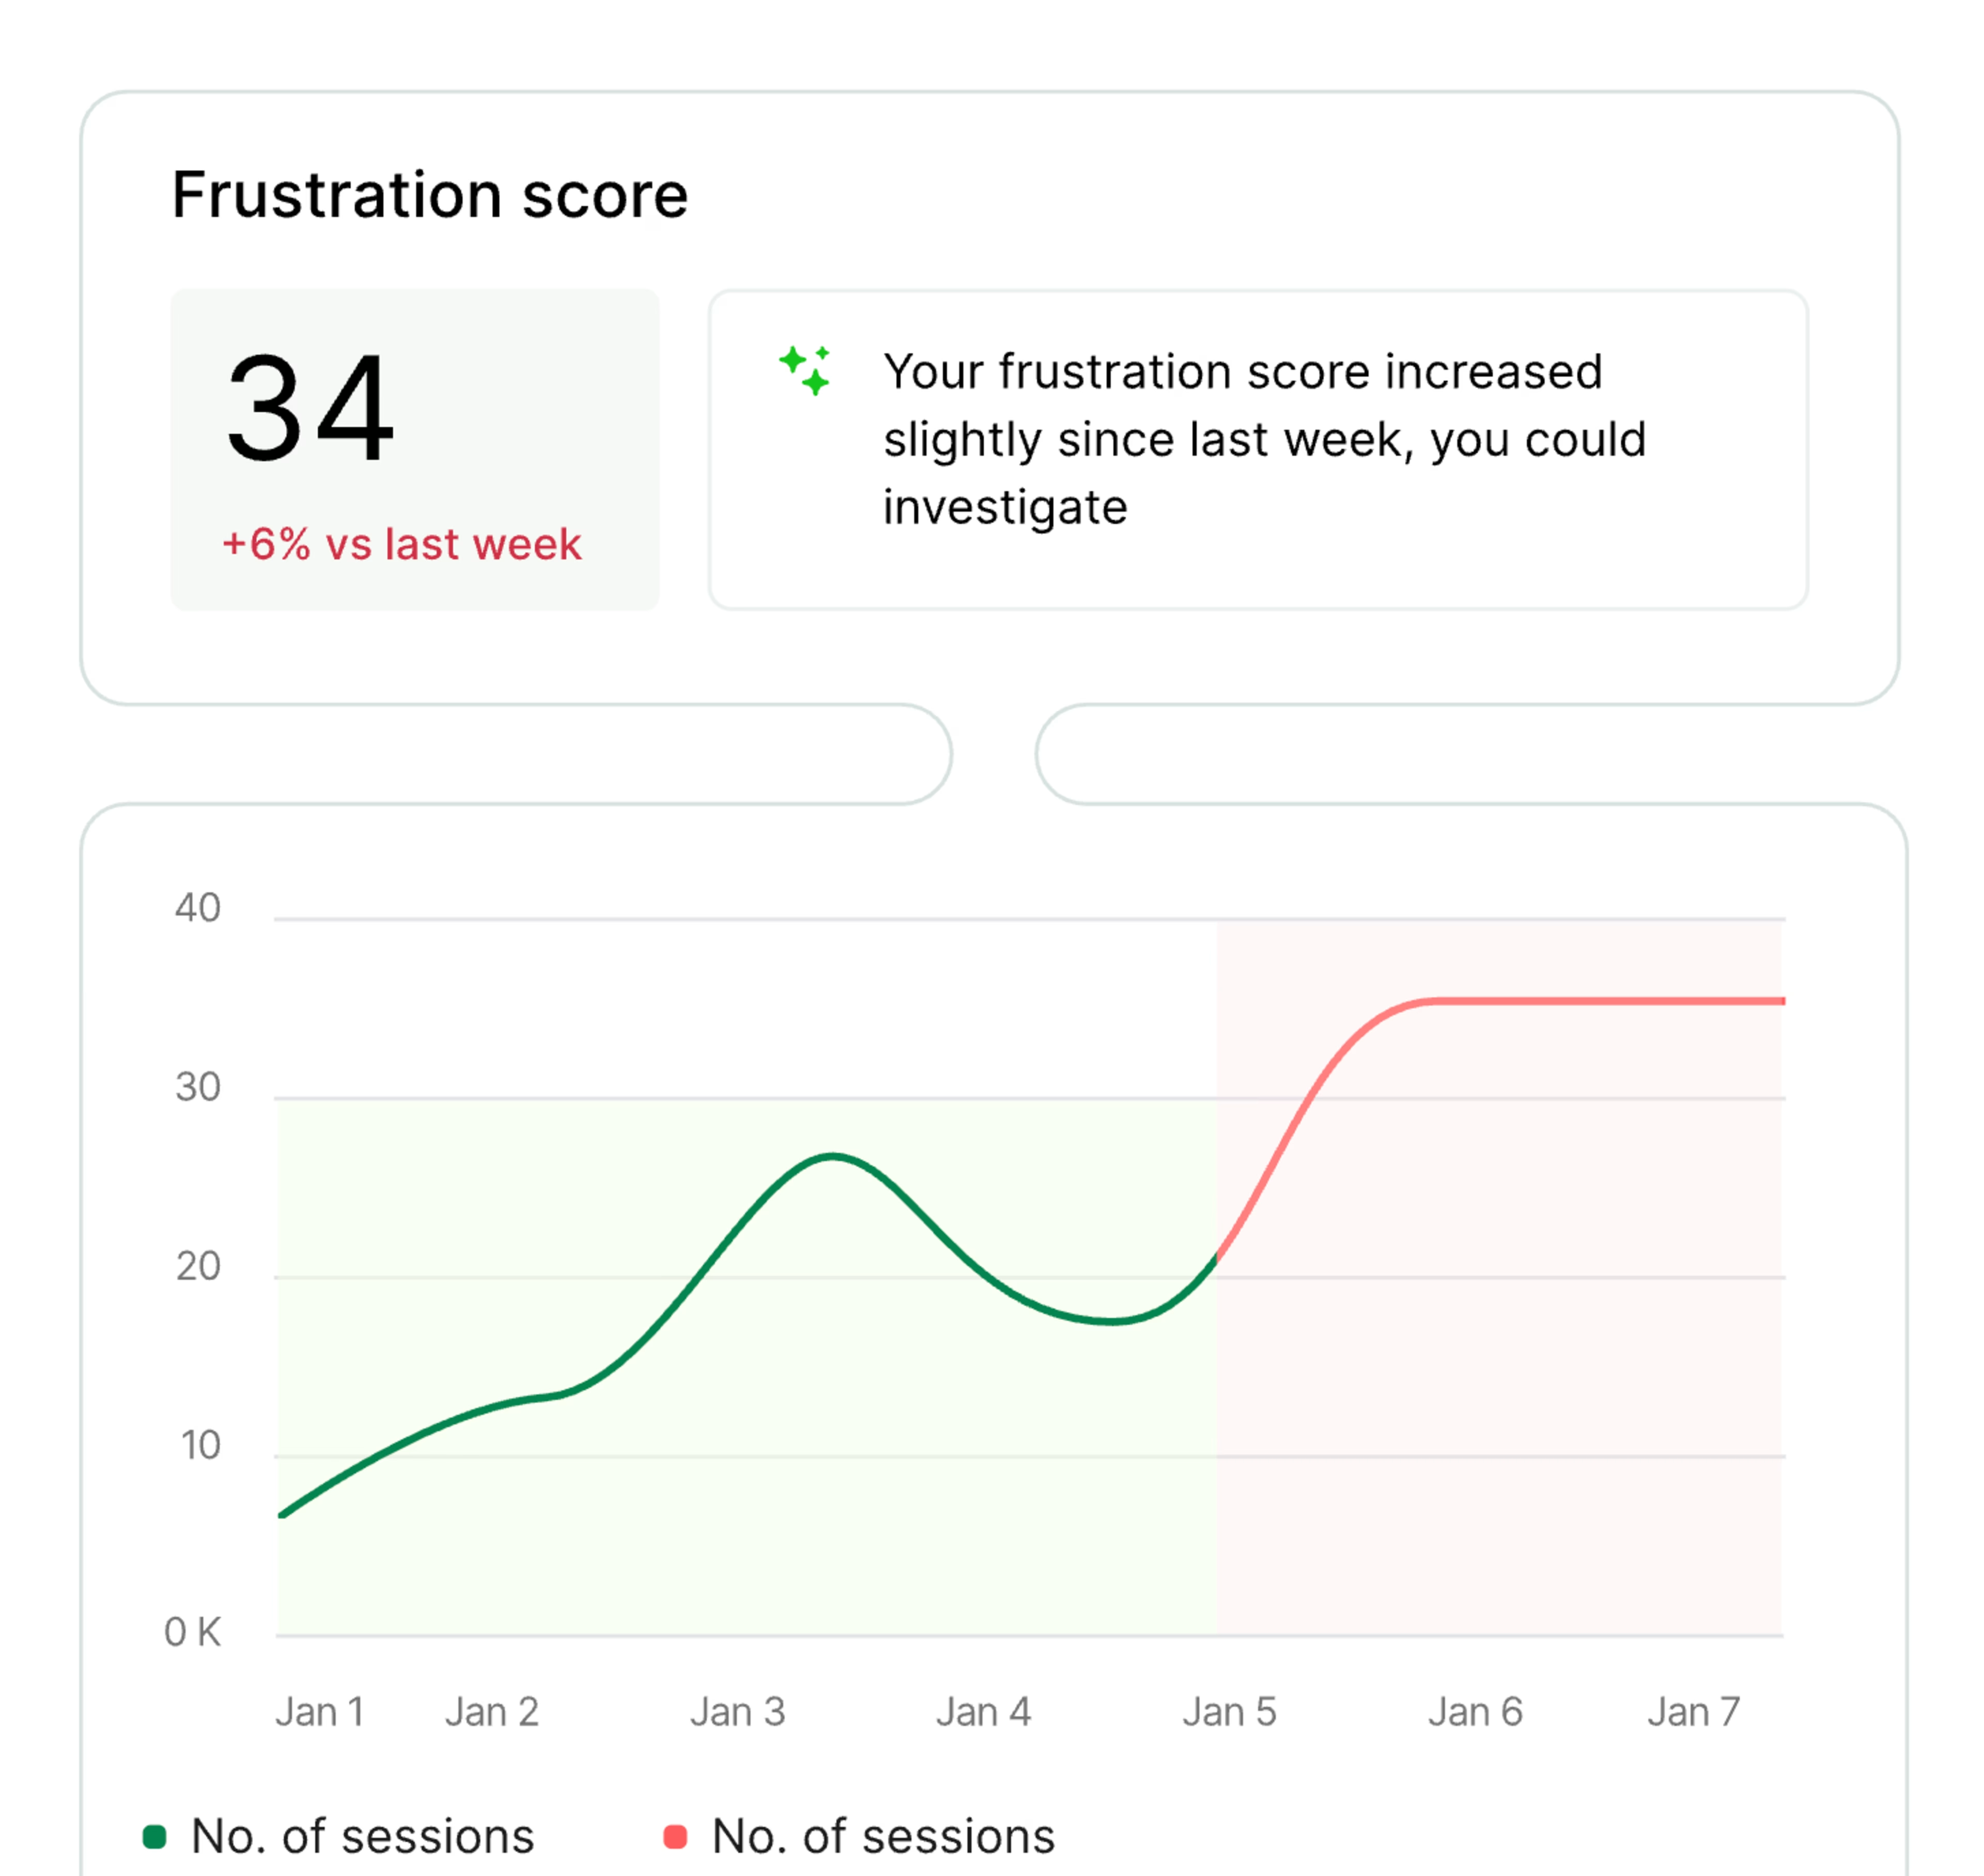
A frustration score indicates the level of difficulty a user encounters during their browsing, either at a pageview or session level, and provides you with a list of the most impactful sources of frustration. With Impact Quantification, this list can then be ranked in terms of business impact.
![[Visual] [Frustration Analysis]](http://images.ctfassets.net/gwbpo1m641r7/5agv9YiPjuvi8pGaX4HiPx/3699c3bd8989b95bb4b8ace90cd8d120/Screenshot_2024-11-08_at_10.24.09.png?w=3840&q=100&fit=fill&fm=avif)
You can also monitor the frustration score on specific pages or page groups and get AI-powered alerts when it varies too greatly or reaches a threshold you’ve predetermined.
💡Pro tip: want to see what a specific issue translates to in terms of user experience? With Contentsquare’s Session Replay capability, you can watch back sessions of users who encountered the issue to see how it impacted them.
![[Product screenshot] Error analysis - Sesion Replay and Impact Quantification](http://images.ctfassets.net/gwbpo1m641r7/1GhEhGHkZH5297eTQ4epfP/0b514d641a7021b278eebcefca856ec8/-Product_screenshot-_Error_analysis_-_Sesion_Replay_and_Impact_Quantification.png?w=3840&q=100&fit=fill&fm=avif)
However, technical issues aren’t always easy to understand. That’s where Contentsquare’s Error Summaries capability comes into play.
Generate an error summary report with a single click to get an explanation of errors and their impact on user experience in clear, non-technical terms.
![[Product screenshot] Error analysis - Error summary - Details](http://images.ctfassets.net/gwbpo1m641r7/3vOnXBPSaqZyKPakDUi0fN/12c4cfc64f7fc49958a8deccccc6ee55/-Product_screenshot-_Error_analysis_-_Error_summary_-_Details.png?w=3840&q=100&fit=fill&fm=avif)
Better yet, each summary includes recommendations to improve your site’s performance.
![[Visual] speed-analysis-tips](http://images.ctfassets.net/gwbpo1m641r7/4aPfDbjzJqjaib32ybyOIb/4a9c0f240bde72b9230b2973a5dc1e9e/speed-analysis-tips.png?w=3840&q=100&fit=fill&fm=avif)
3. See the struggle for yourself
Contentsquare’s Session Replay capability lets you see exactly what your user experienced, from their perspective. You can filter replays by error type, behavioral signals like rage clicks, or frustration score to uncover recurring issues and diagnose their root causes.
Sort sessions by frustration score to prioritize your focus on fixing issues that’ll have the biggest impact.
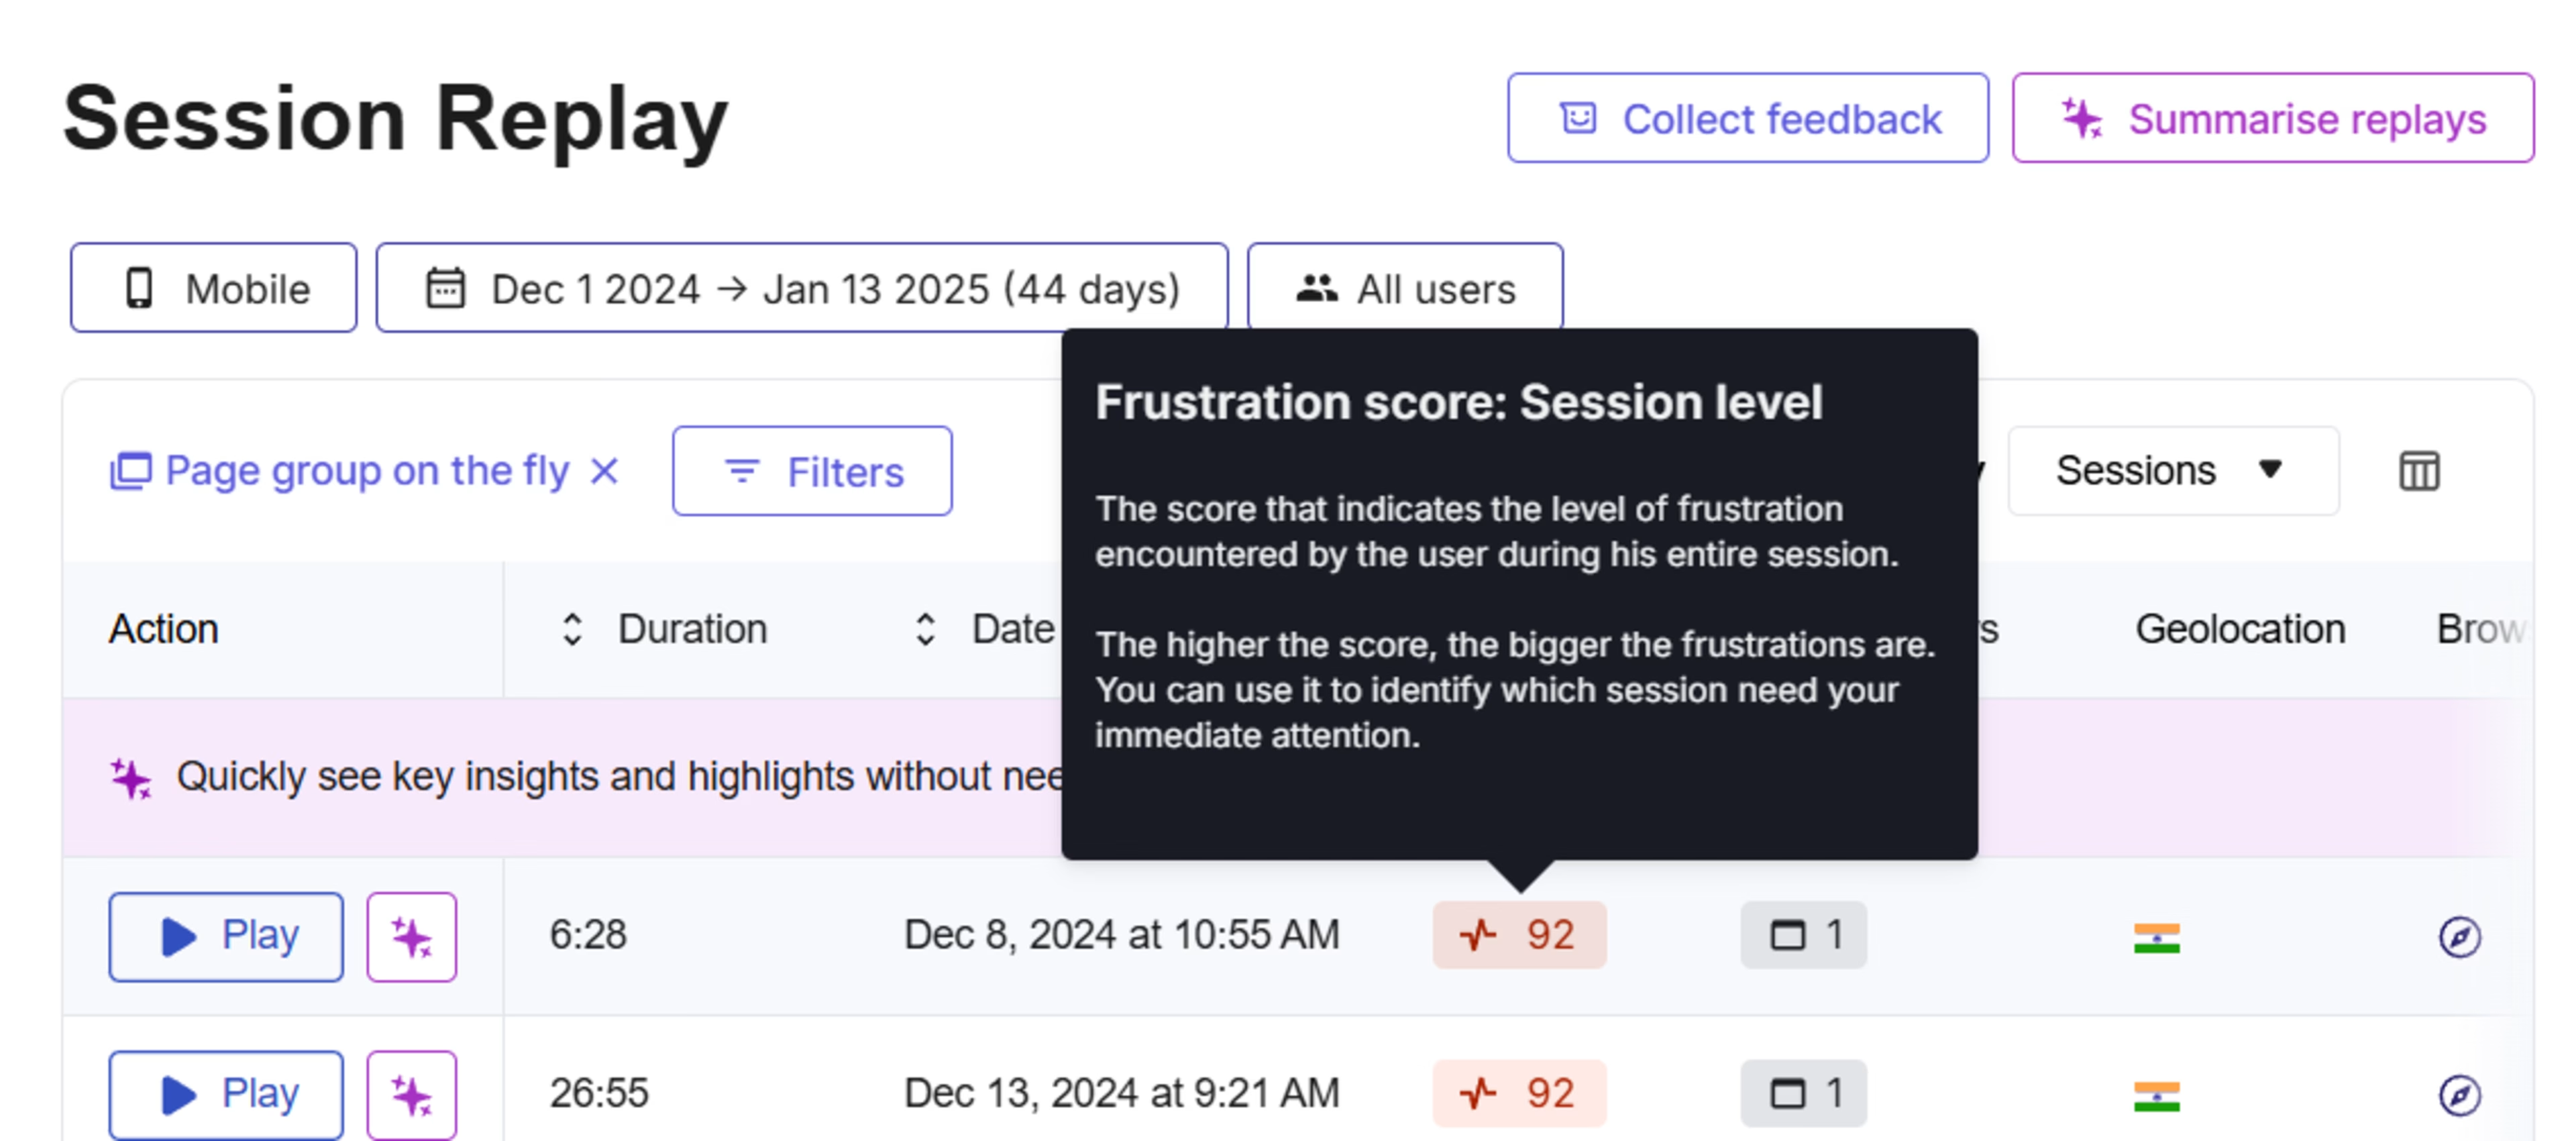
Use the summary feature, powered by Contentsquare’s AI, Sense, to get key insights and better understand the type of errors users experienced during their sessions.
![[Product screenshot] Session Replay summary – Sense AI](http://images.ctfassets.net/gwbpo1m641r7/nlg5vootccUxdOYItZBXE/f6b8b7e42ce62f2f8f283fefa64eaae8/Platform___Session_Replay___AI_summary.png?w=3840&q=100&fit=fill&fm=avif)
🚀Success story: how Orvis increased cart conversion by +5% by fixing issues in its checkout journey
Wanting to know what was causing friction on their site, multi-channel retailer Orvis turned to Contentsquare.
Using Session Replay, the team discovered a segment of customers were clicking on the cart icon to checkout and being led to an empty screen with no messaging or direction for the user.
By finding this error, the team was able to fix the issue and recover conversions that would have otherwise been lost.
Read the full case study here
🚀 Success story: How Hotel Chocolat reduced their ‘missed opportunity’ score
Using Contentsquare's frustration score, U.K.’s premier luxury chocolate brand Hotel Chocolat spotted a high number of rage clicks on their add-to-basket call to action (CTA).
Diving deeper with Session Replay, they discovered the product detail page (PDP) was forcing customers to select a color before other elements on the page were clickable.
By making the PDP preselect the color based on where the user had come from, they made the CTA clickable and completely reduced rage clicks.
Read the full case study here
4. Watch out for seasonal spikes in frustration
During peak season, when traffic surges and expectations are high, frustration can suddenly spike. Visitors eager to make a saving can experience heightened frustration from slow-loading pages or malfunctioning promo codes, especially when faced with limited-time offers.
At competitive times of the year, when customers have plenty of alternative options for making those savings elsewhere, it’s crucial for retailers to provide a seamless and friction-free experience.
Contentsquare helps you stay ahead of traffic and error spikes with real-time alerts. For example, set a specific number for each metric of interest and Contentsquare will trigger an alert when that number’s reached.
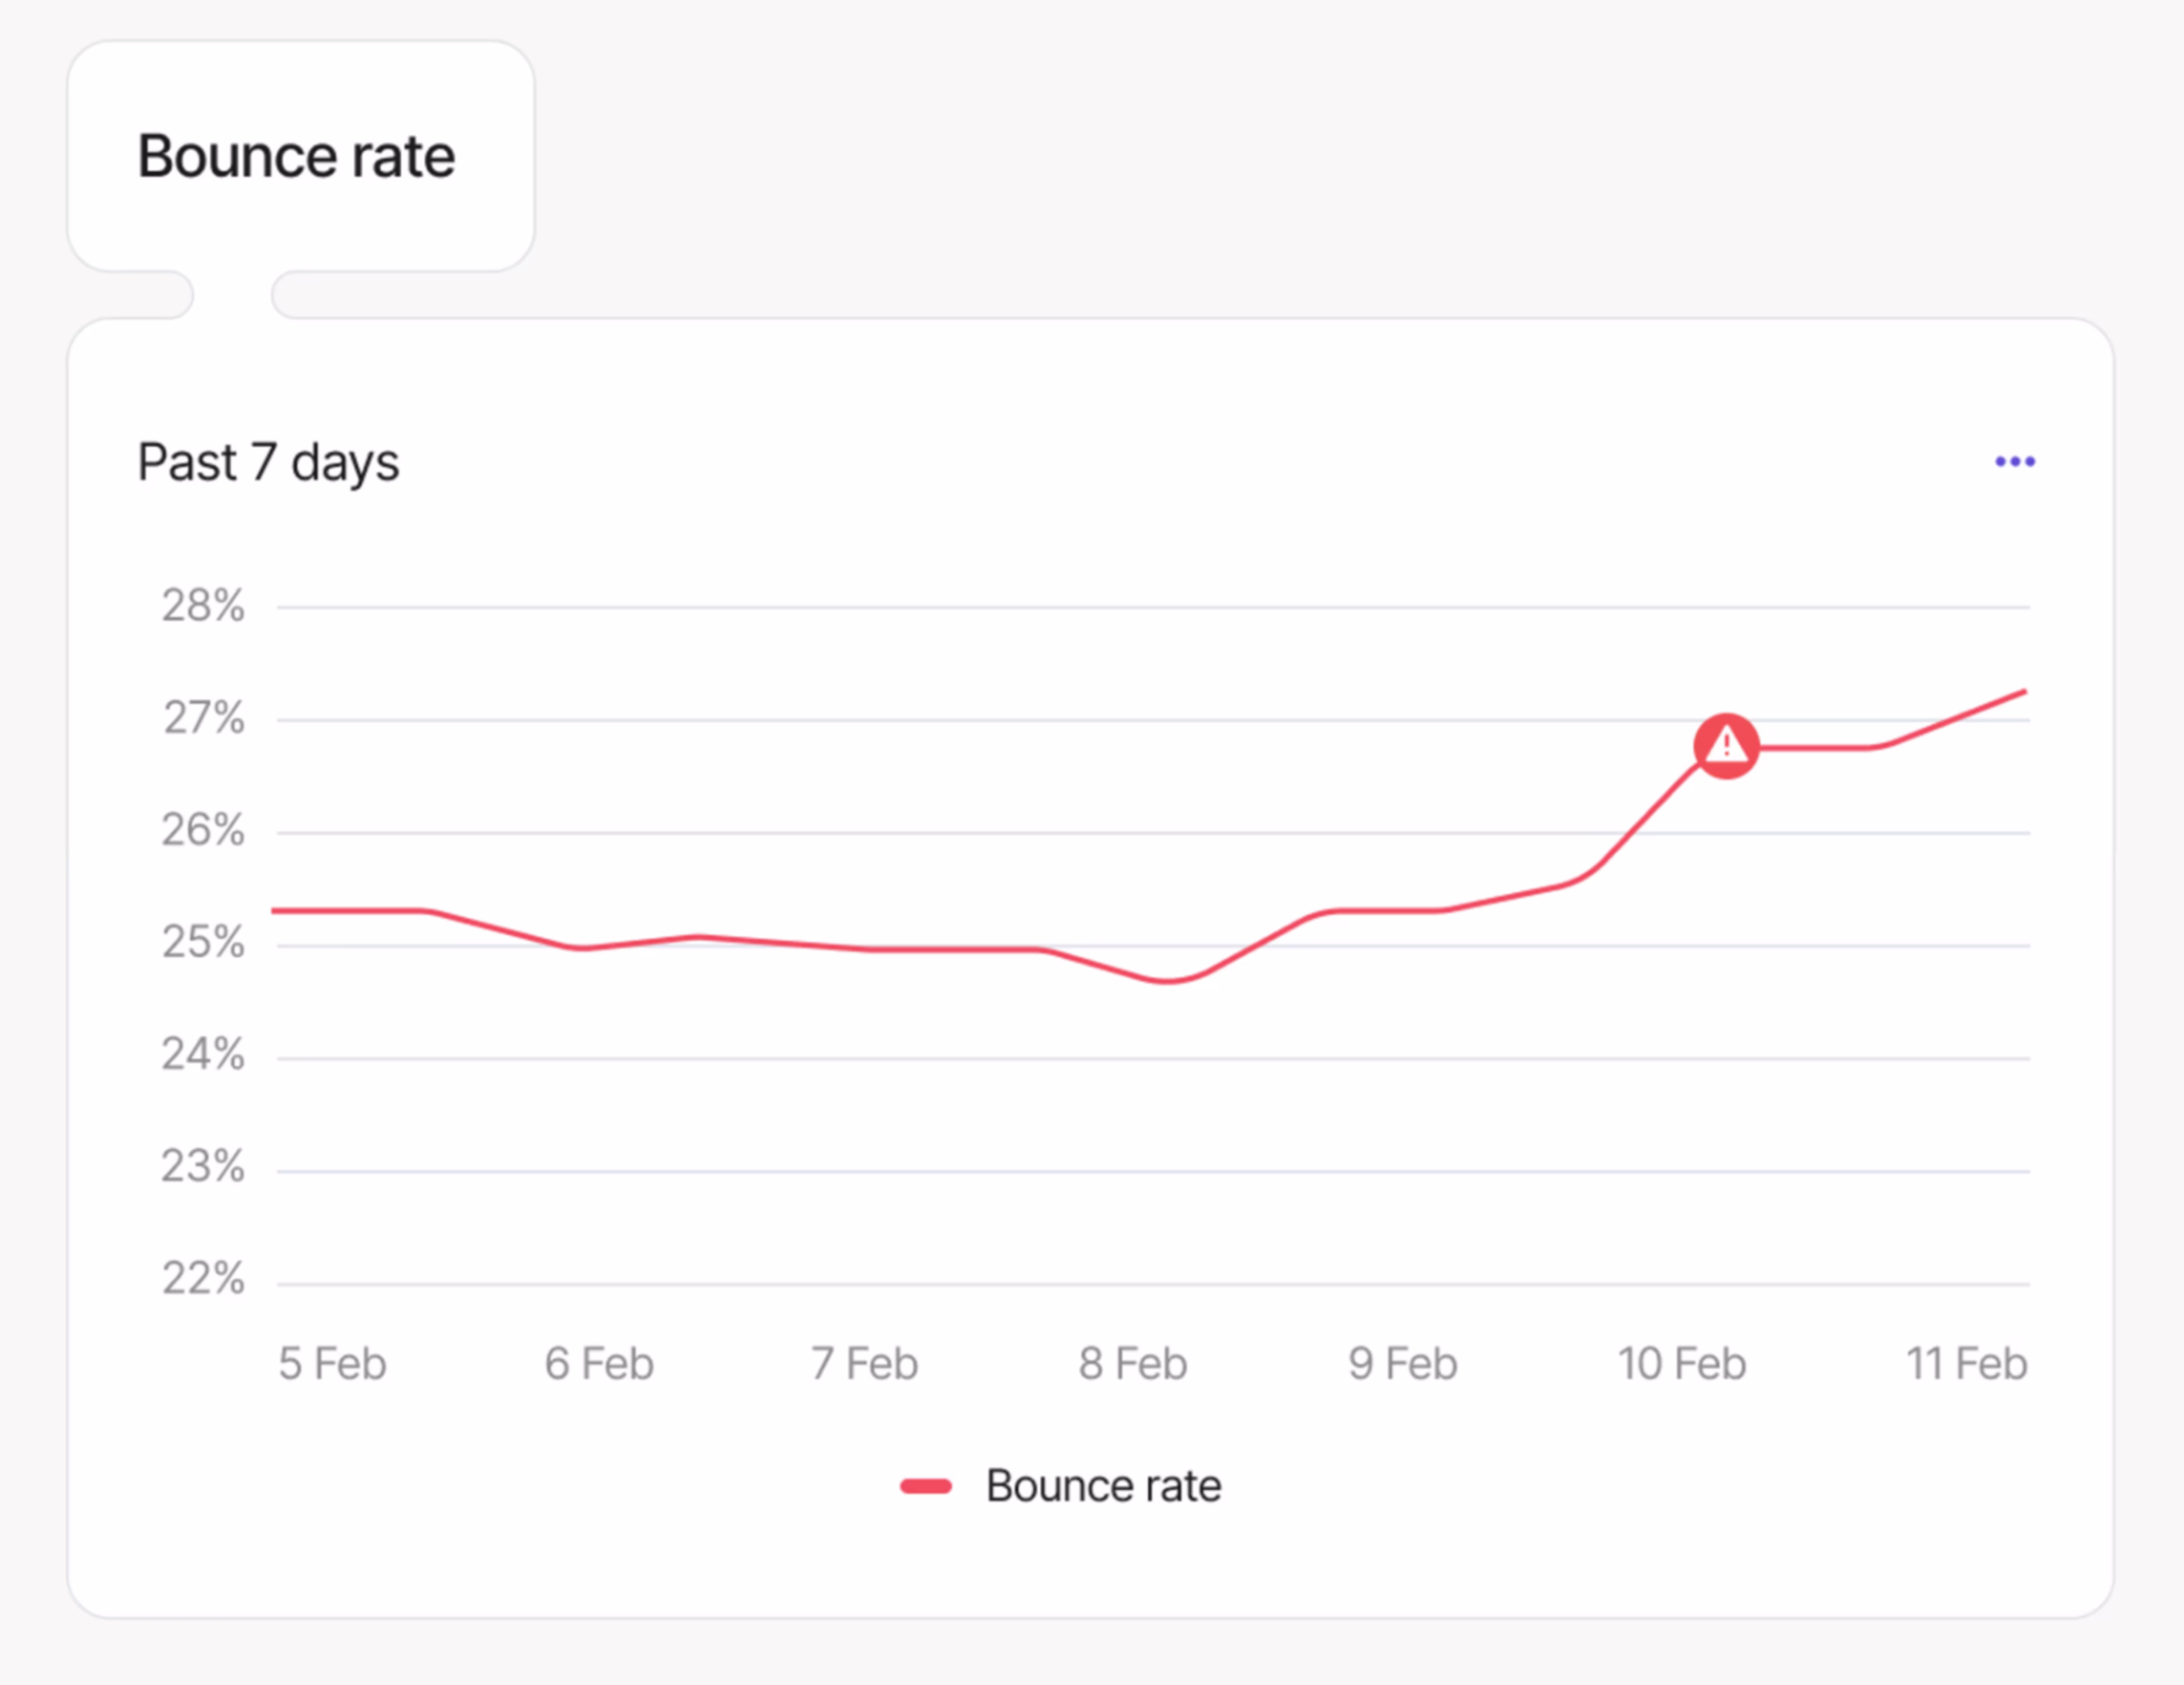
An alert can be sent whenever your metrics reach a certain point, helping you take action fast.
With Contentsquare’s AI Alert, you don’t even need to define a manual threshold: Sense takes care of spotting variations in the metric you’re tracking depending on the sensitivity level you’ve selected.
![[Product screenshot] Alerts - Real-time - AI](http://images.ctfassets.net/gwbpo1m641r7/20jpSFAvj3dZREssZXxll6/4b91eb5717e71ba8c2c43c912198be8e/-Product_screenshot-_Alerts_-_real-time___AI_.png?w=3840&q=100&fit=fill&fm=avif)
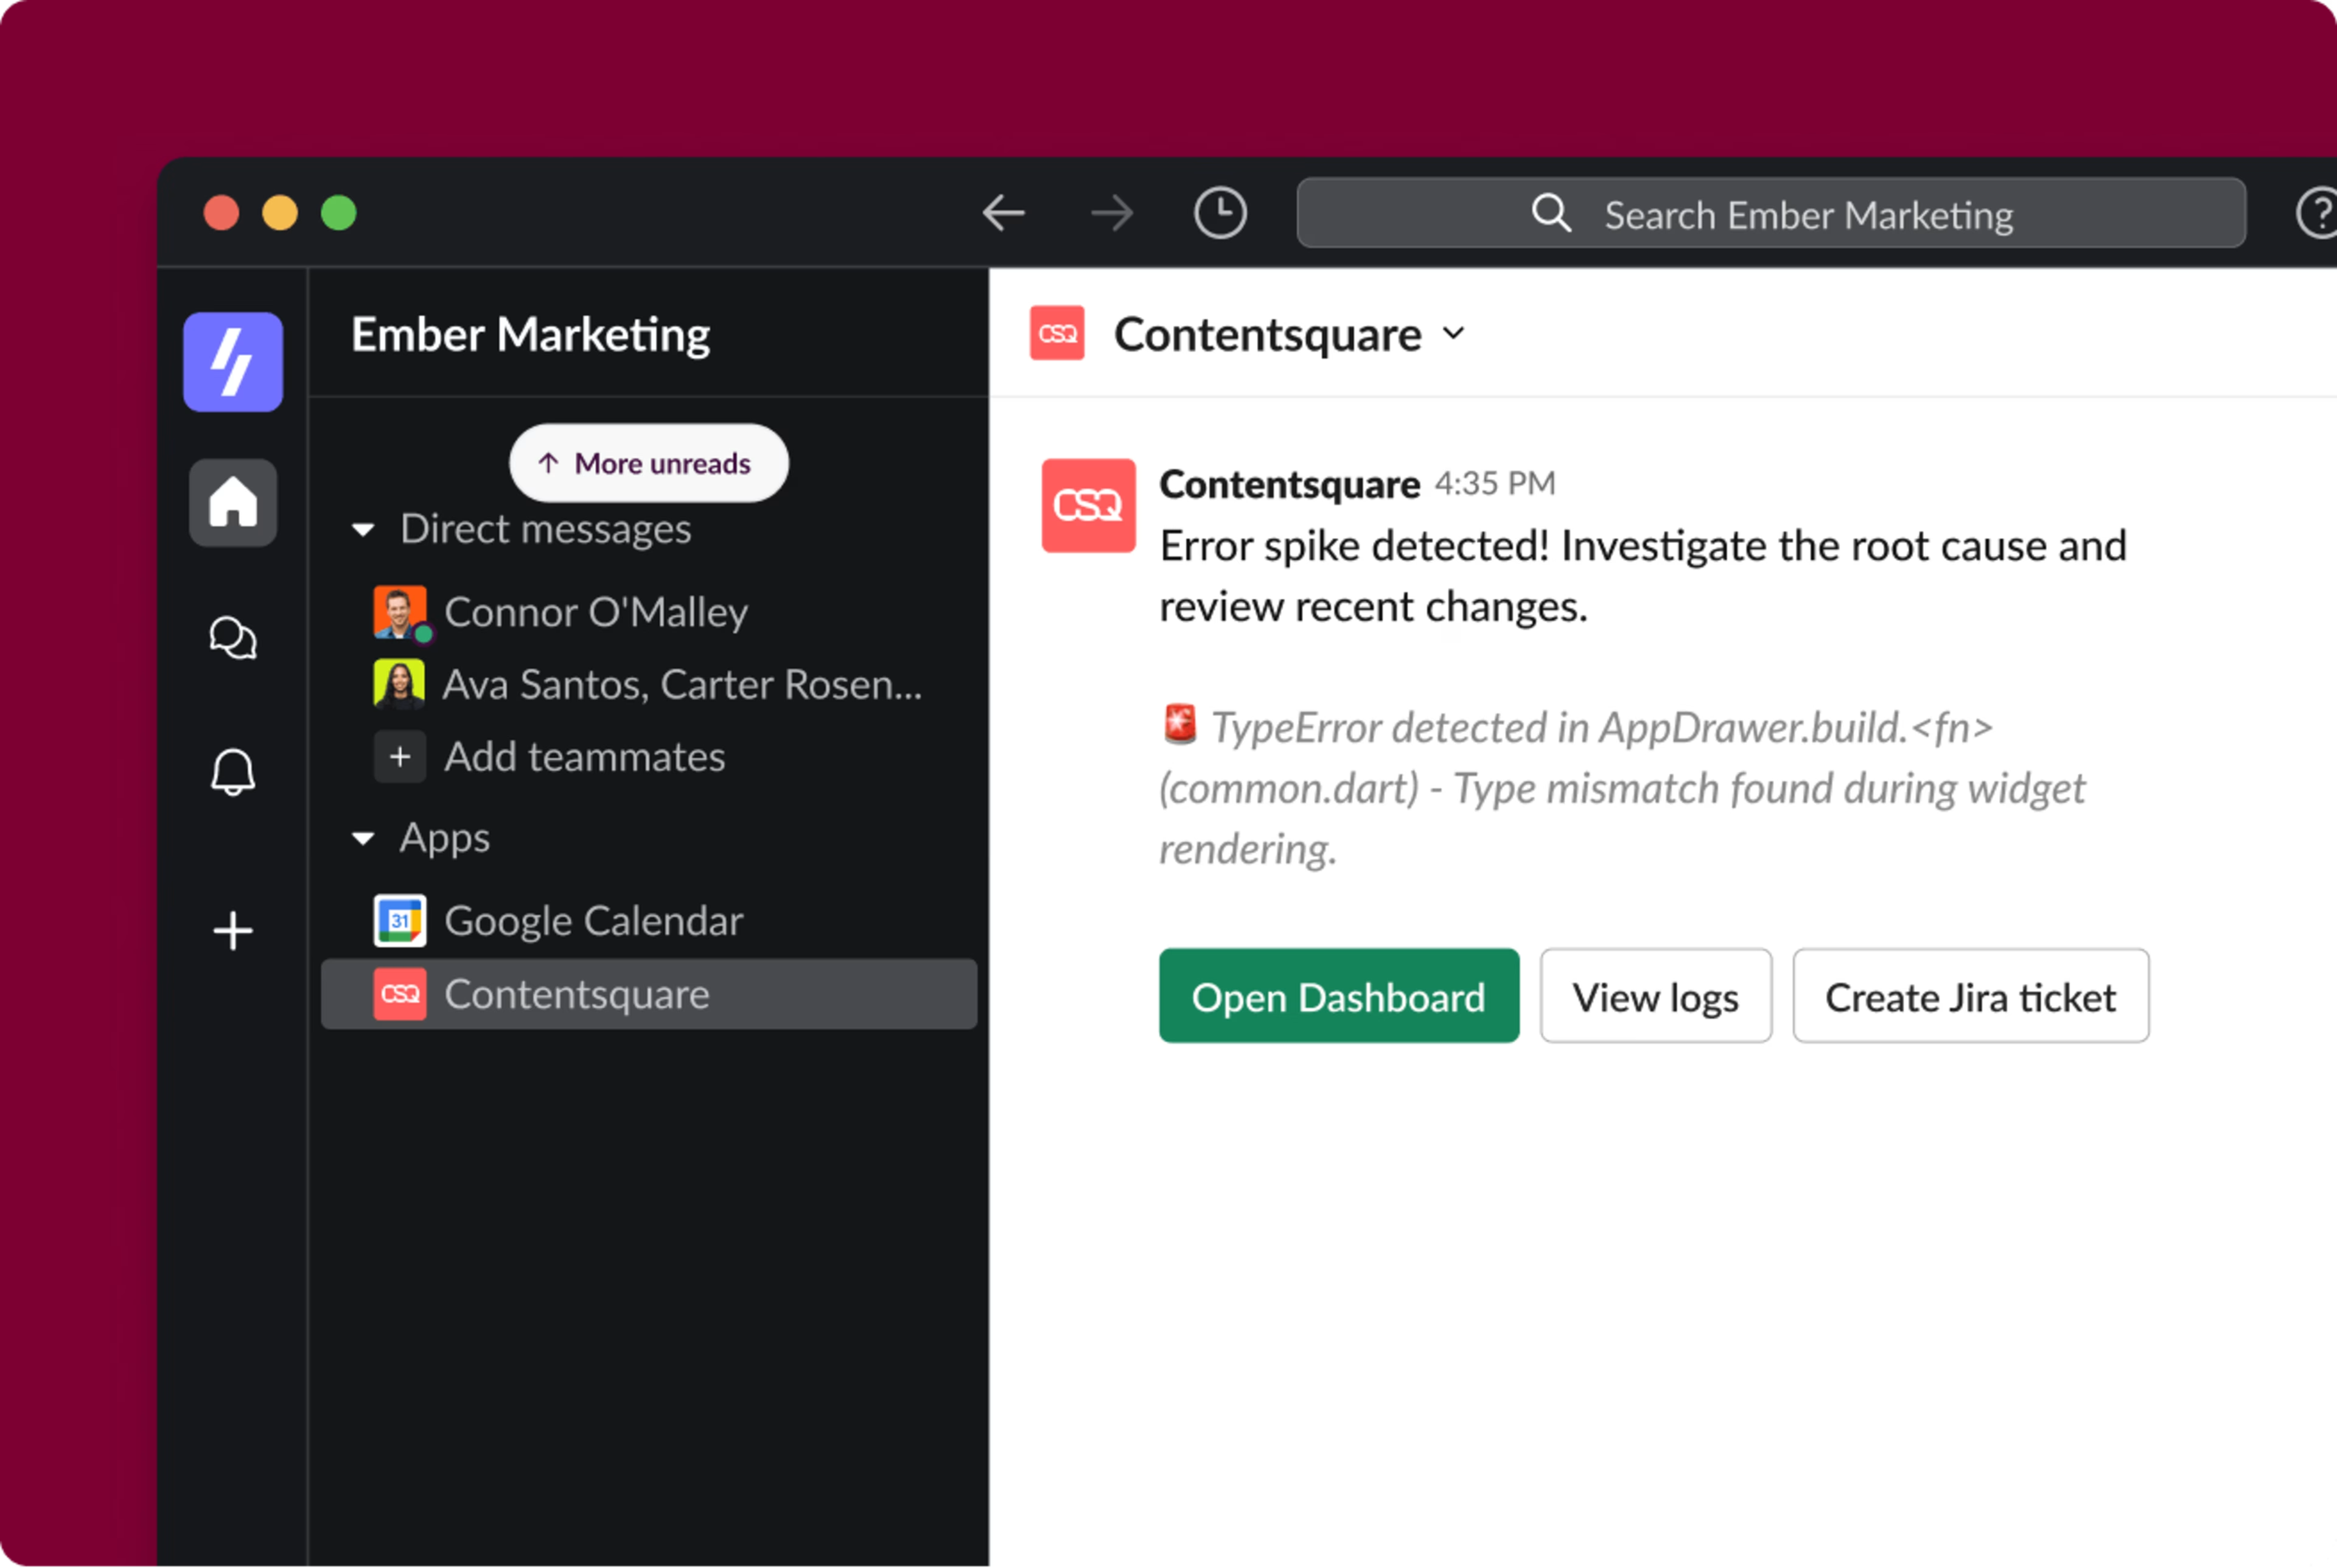
Integrate real-time alerts into your team’s workflow tools (like Slack or Jira), or set up email notifications within the platform, so you can act fast.
5. Ask for feedback and respond rapidly
Use Contentsquare’s Voice-of-Customer (VoC) product to gather user feedback and send surveys to get to know your users, and their frustration points.
Invite users to share their thoughts or frustrations with a simple feedback widget that’s always visible on any pages you want to track. Integrate this in-the-moment feedback with Slack so you can be alerted immediately and take action.
![[Visual] Feedback widget](http://images.ctfassets.net/gwbpo1m641r7/5jr4CTsauawIcy5FxzmqcT/752f0588983de225c36d2ff9d1d0f2e0/Feedback_Widget.png?w=1920&q=100&fit=fill&fm=avif)
Do some of your pages have higher bounce rates than others? Use exit-intent surveys to ask users why they’re leaving specific pages so you can fix the issues fast before they have real business impact.
![[Visual] Exit-intent survey](http://images.ctfassets.net/gwbpo1m641r7/70LxdbnLg3vHHjjMfZjfmb/ae68013aad3713169bfcac7b7ab1c795/image3.png?w=1920&q=100&fit=fill&fm=avif)
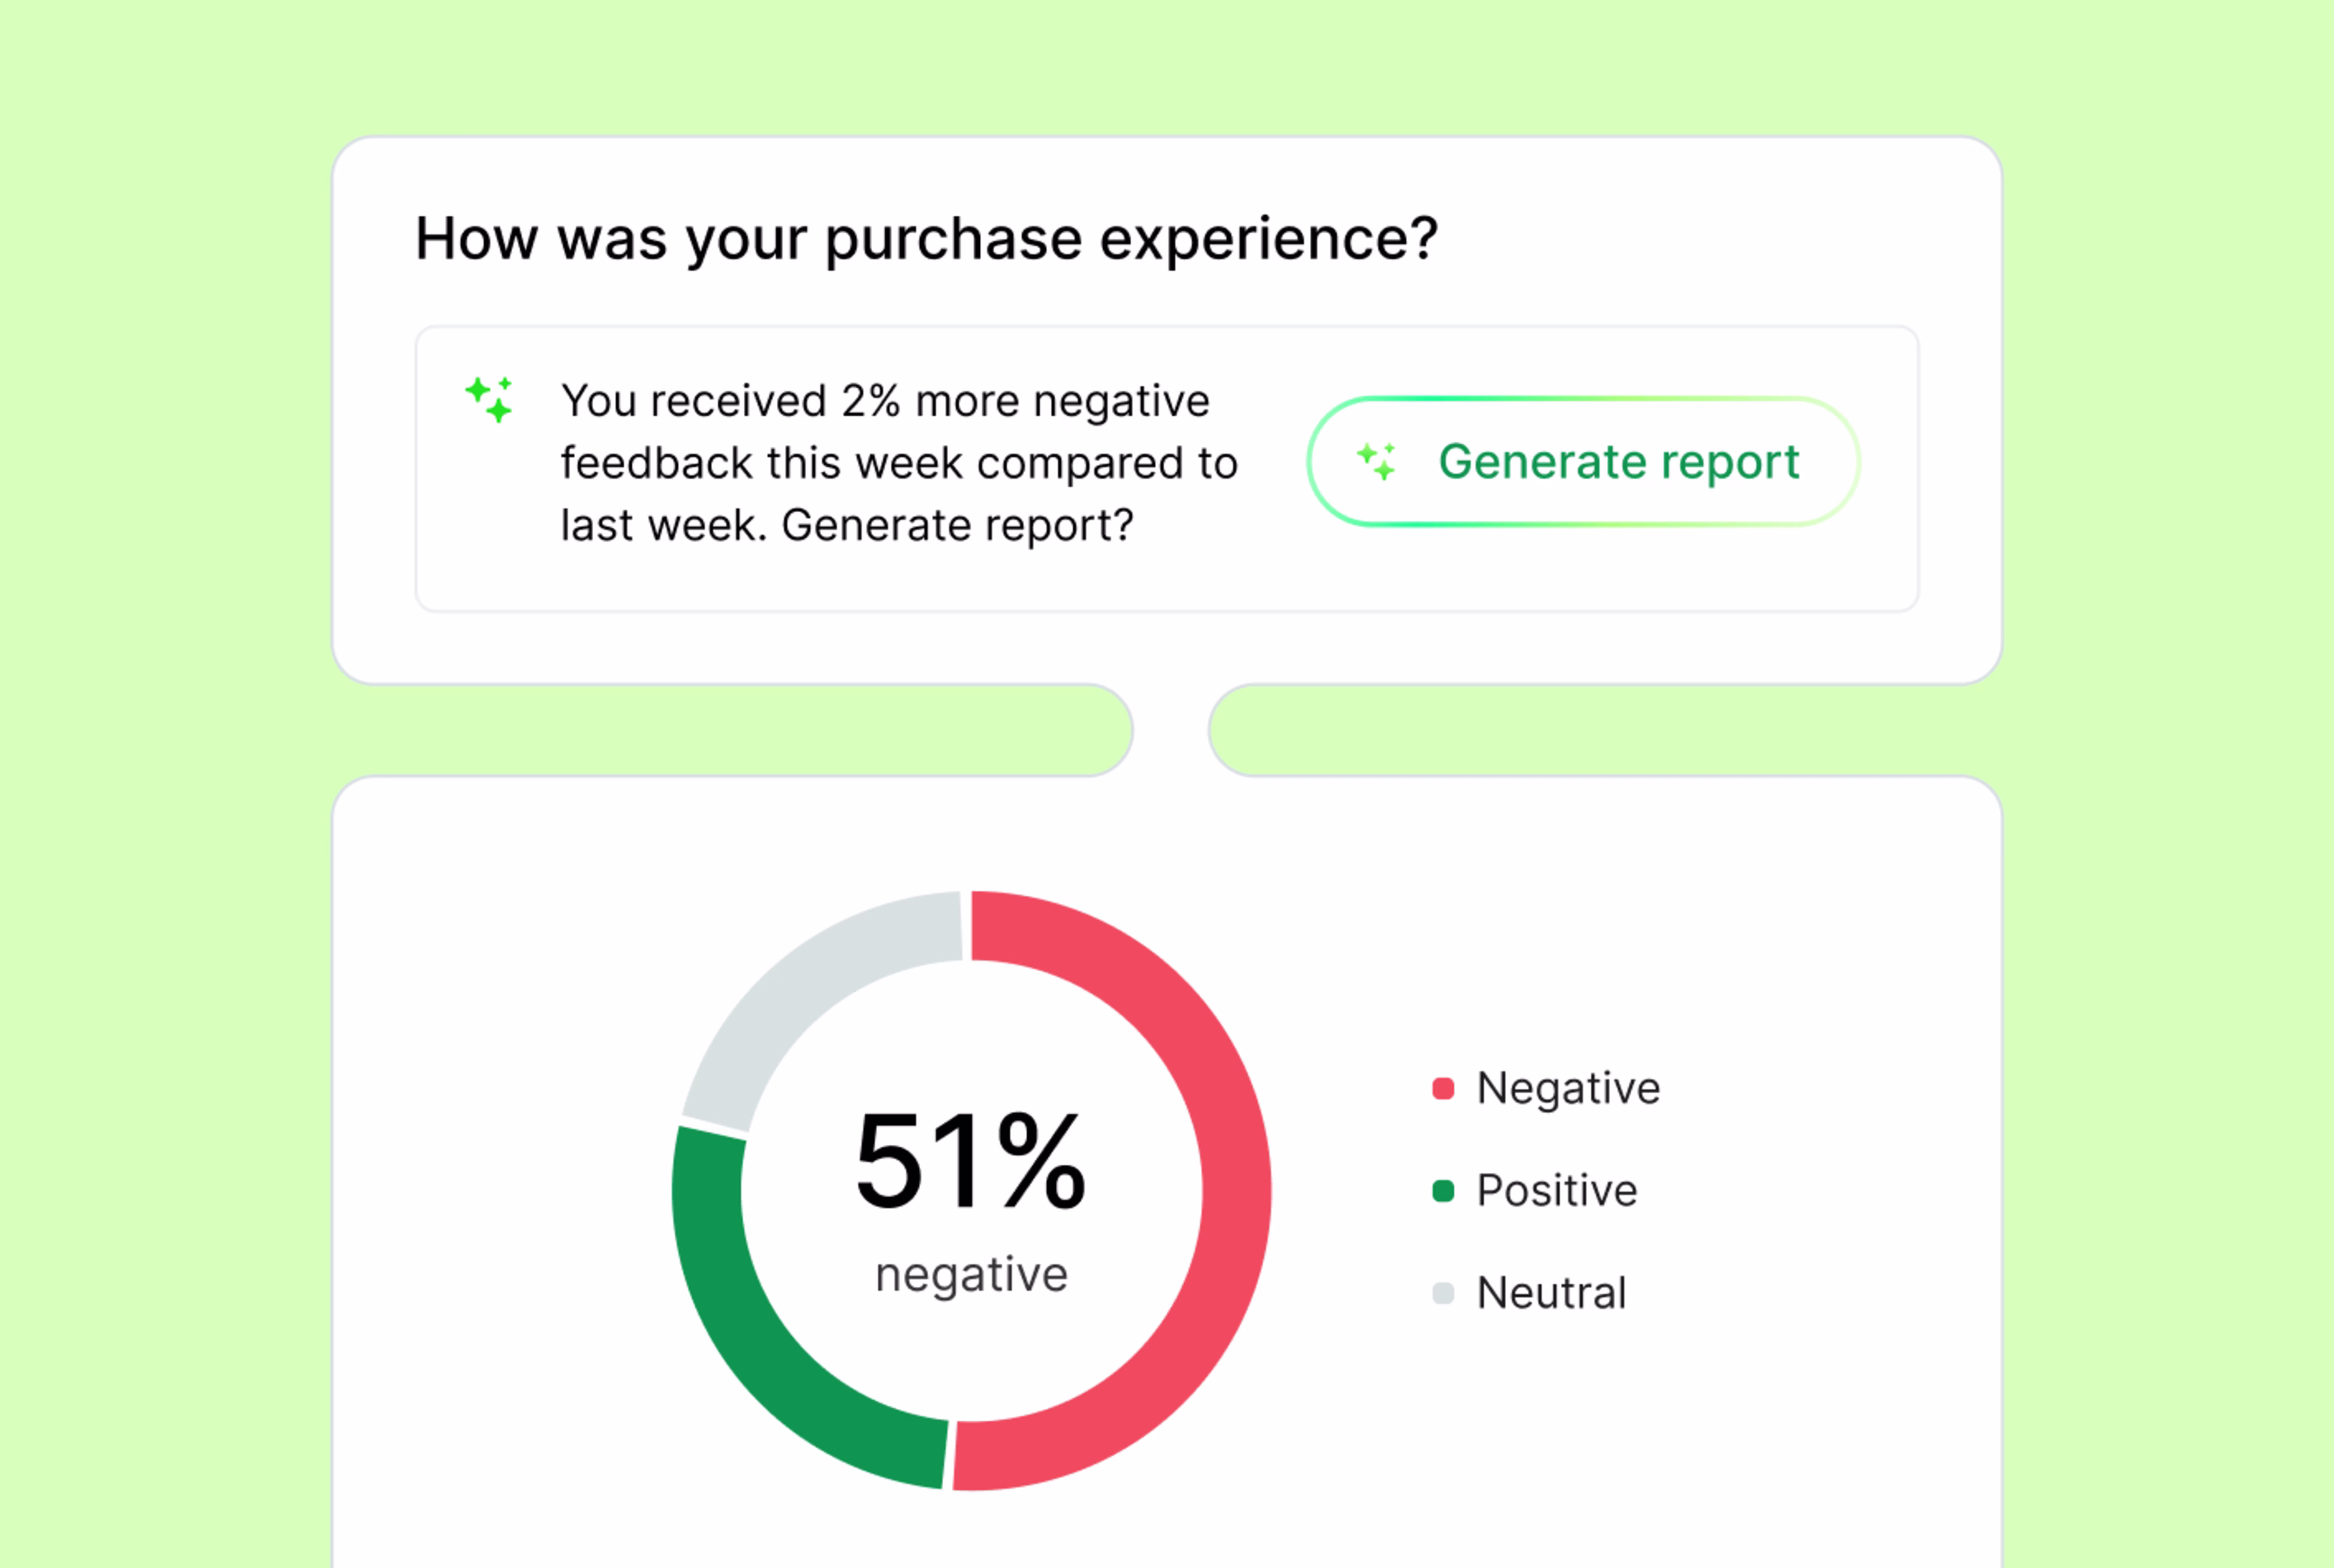
Sorting through and summarizing qualitative VoC data can be a tedious process. With Contentquare, you can simply let Sense do all the work. The AI performs a sentiment analysis by categorizing feedback responses based on sentiment, helping you uncover how people feel. You can then jump directly from a survey response to the corresponding session replay to understand the full context of the issue.
For example, you could launch a survey on key pages where users are churning instead of converting to identify pain points.
Contentsquare’s VoC seamlessly integrates with the platform’s Experience Analytics product to help bridge the gap between what users say and what they do.
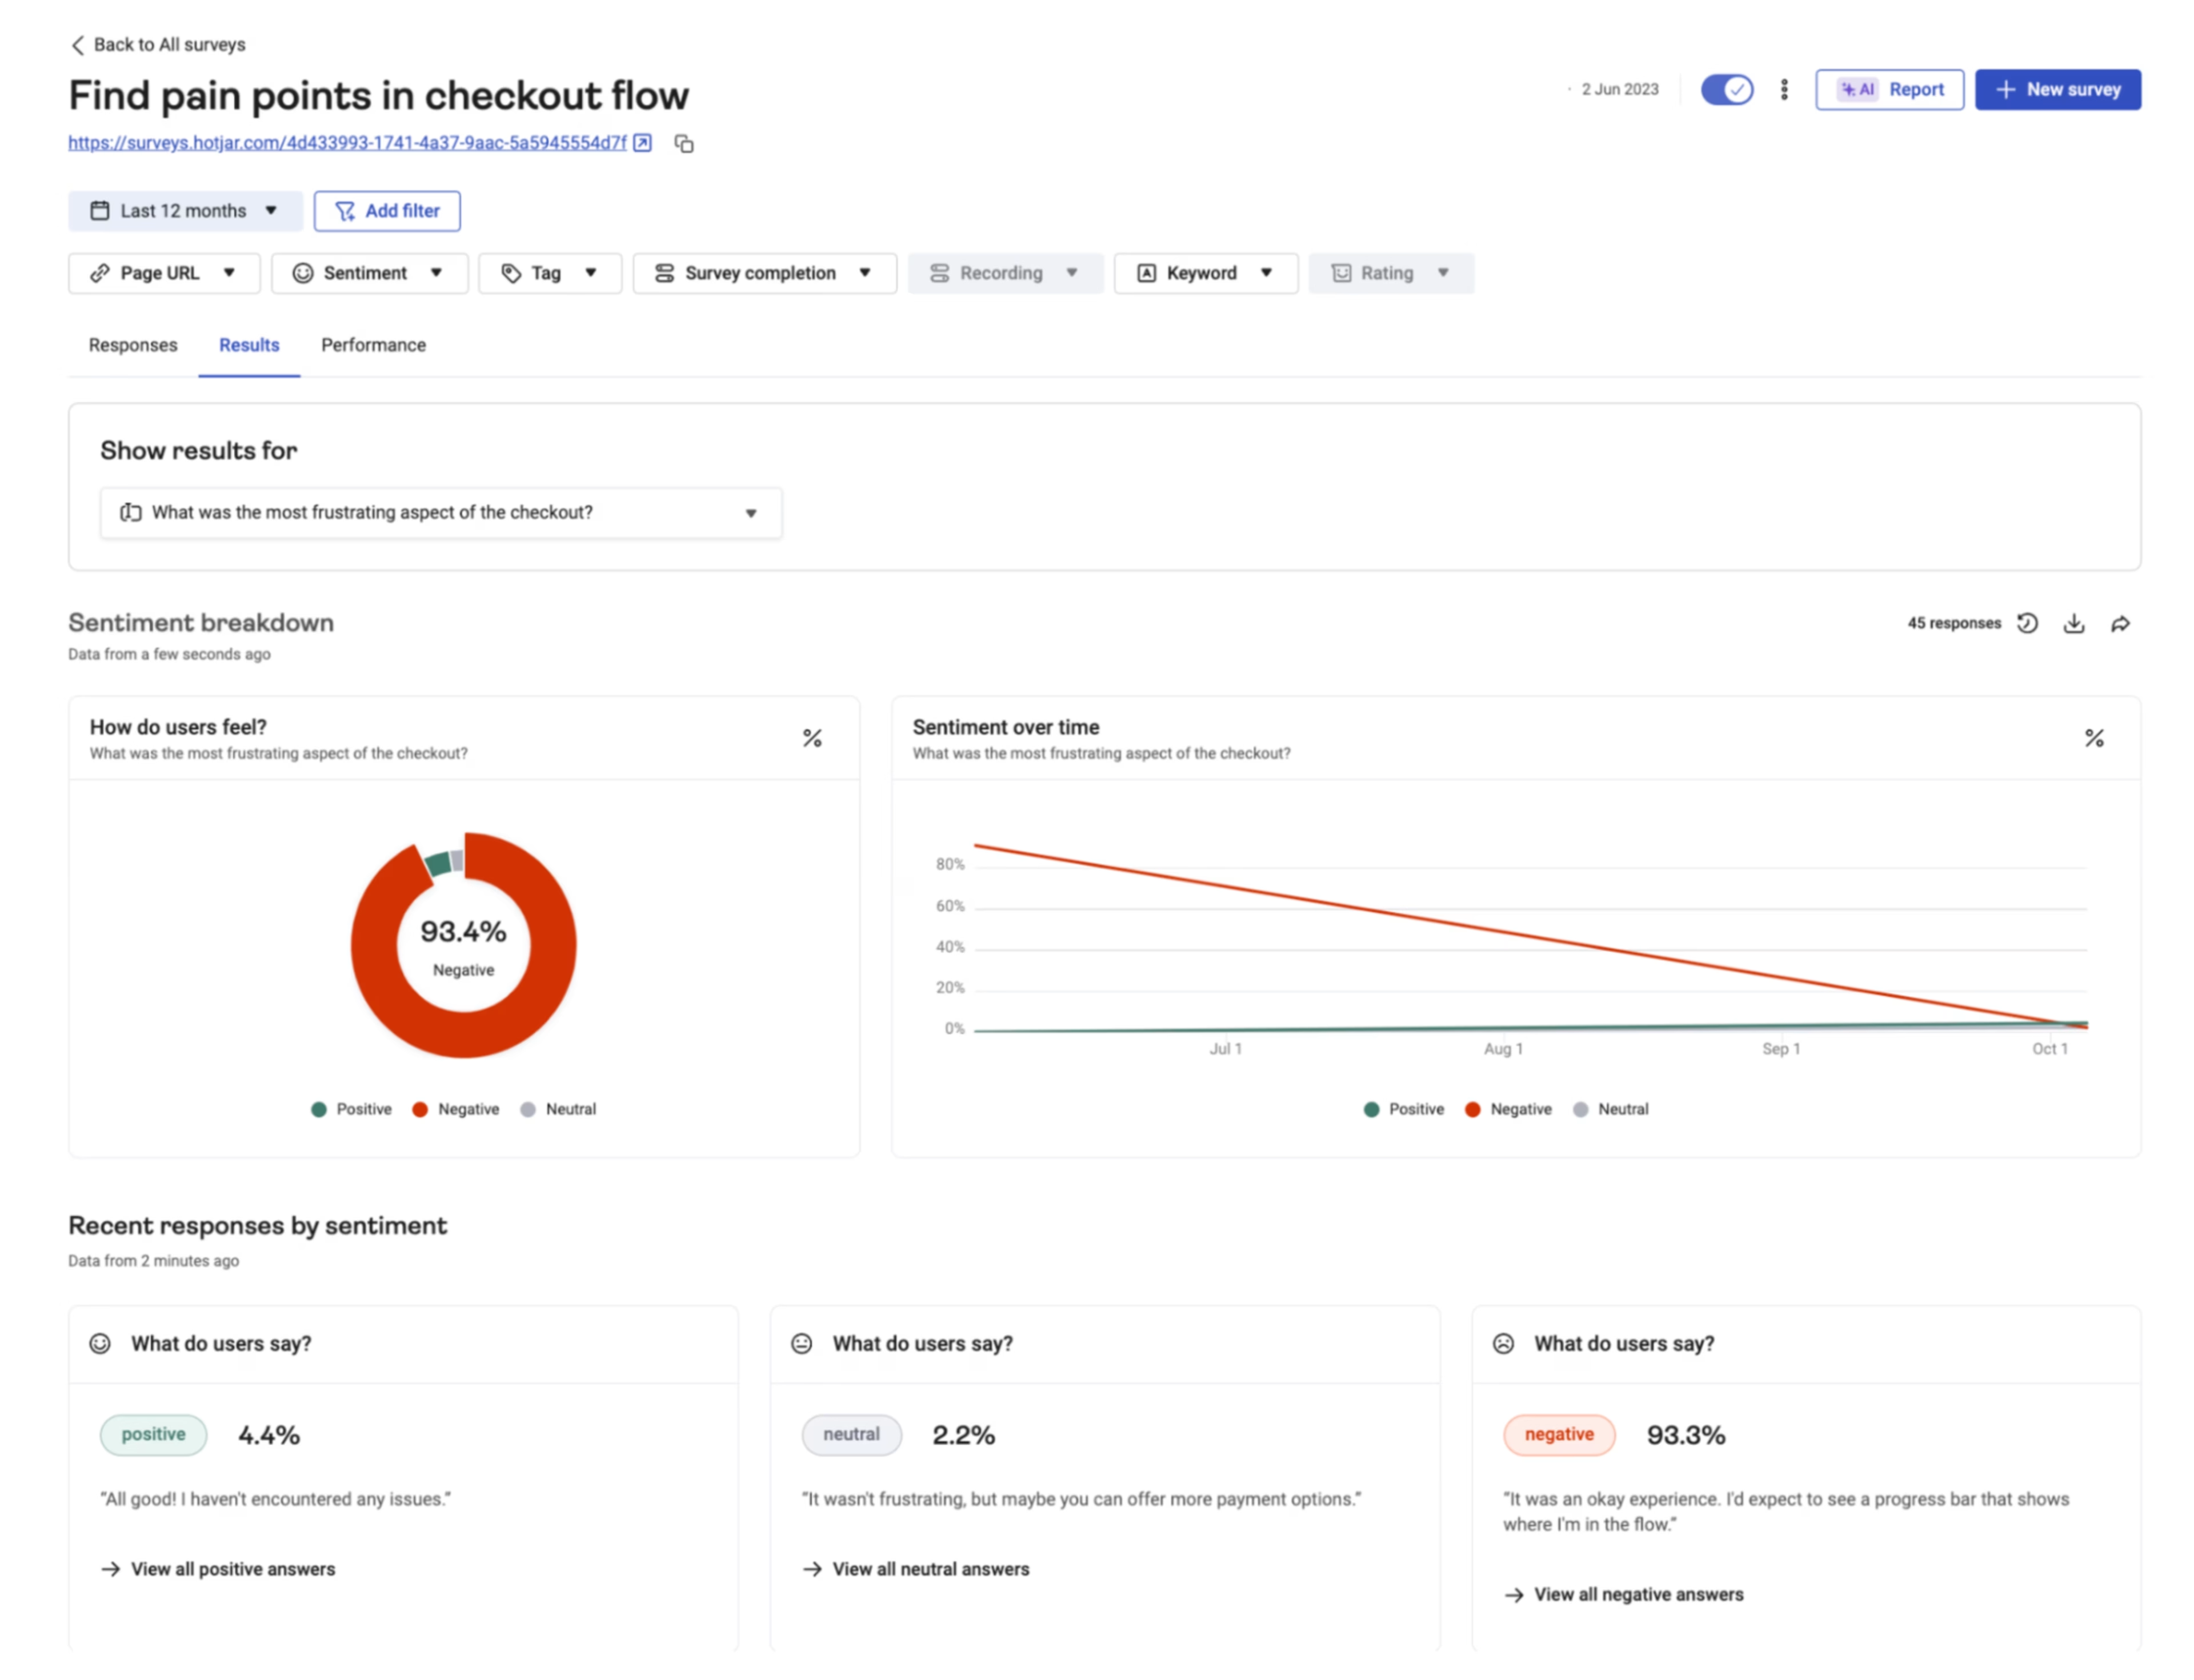
With Sense, you can get comprehensive AI-powered reports on your surveys, including summaries of the main insights, along with actual customer quotes and recommendations on addressing this feedback.
![[Visual] Surveys - AI summary](http://images.ctfassets.net/gwbpo1m641r7/3NZ7jqMcoLw9ysBhnHOr2i/e9210dd62d4aed1a0e597ed710942b21/VoC_-_AI_summary__1_.png?w=3840&q=100&fit=fill&fm=avif)
Katie Boba, Digital Experience and Testing Coordinator at B&Q, says having direct VoC customer data is invaluable for improving the customer experience.
Being able to have a deeper understanding of what our customers are saying in that area would mean that we could hit more of our strategic goals in terms of updating our experience and really focusing on the bits that are important to the customers.
Try Contentsquare to improve digital experiences on your retail site
Contentsquare’s experience intelligence platform provides a comprehensive view of customer behavior, helping identify frustrations and their sources to help you connect the dots between actions and business outcomes.
By incorporating these powerful and AI-driven strategies, retailers can consistently improve their digital experiences, turning casual browsers into loyal customers.
![[Visual] Contentsquare's Content Team](http://images.ctfassets.net/gwbpo1m641r7/3IVEUbRzFIoC9mf5EJ2qHY/f25ccd2131dfd63f5c63b5b92cc4ba20/Copy_of_Copy_of_BLOG-icp-8117438.jpeg?w=1920&q=100&fit=fill&fm=avif)