
Product analytics are a powerful way to understand how users engage with your digital product or service. Building an advanced product analytics strategy ensures you leverage that data to the fullest to create happy users and business growth.
But knowing what goes into a product analytics strategy isn’t always clear. You need to determine the right combination of tools, metrics, and tactics to ensure your plan’s success.
Here’s an easy-to-follow, step-by-step approach to creating and implementing an advanced product analytics strategy. You’ll walk away with a framework and best practices you can apply right away to analyze product usage, improve your product, and create positive user experiences.
5 steps to building an effective advanced product analytics strategy
Product analytics tools reveal insights about user behavior across sessions and over time so you can diagnose problems and optimize performance for your users.
Building an effective product analytics strategy ensures you get the most from your product analytics platform—and the insights you need to build a better digital experience and propel your business forward.
Here are 5 steps to get you started.
1. Define your objectives
Once you’ve gathered data on the user journey, determine the objectives of your product analytics strategy. These objectives will guide your analytics efforts, helping you improve your decision-making to achieve your product goals.
Start by examining your company’s broader business goals and understanding how your product contributes to them.
For example, say your ecommerce company aims to increase revenue by improving user engagement and conversion rates. One of your product analytics objectives might be to increase user sign-ups for your app by 17% within the next quarter.
Ensure that your objectives are SMART:
Specific: setting a clear target
Measurable: using your product analytics platform
Achievable: based on past data or industry benchmarks
Relevant: to the company’s strategic focus
Time-bound: with a clear timeframe for tracking progress
💡 Pro tip: gather input from key stakeholders—like product managers, marketers, customer support, and your C-suite—to ensure your objectives reflect diverse perspectives and priorities. Surveys are perfect for this!
2. Choose your success metrics
To measure the success of your product analytics strategy, you need to select product metrics to monitor. You’ll likely choose one ‘north star’ or focus metric to track that closely aligns with your main objective, but you need to identify other supporting indicators, too.
Your key performance indicators (KPIs) will vary depending on your industry, business size, and organizational maturity.
Companies mainly turn toward these types of metrics:
User acquisition metrics, like new user sign-ups, cost per acquisition (CPA), or traffic sources (for example, organic search or paid ads)
User engagement metrics, like the number of active users or average session duration
Product performance metrics, such as load time or error rates
Conversion metrics, such as conversion rate—the percentage of users who complete a desired action, like making a purchase—or average order value (AOV)
Customer satisfaction and loyalty metrics, like your customer satisfaction score (CSAT) survey results or customer lifetime value (CLV), the amount of money a single customer generates over their relationship with your product
Retention metrics, like churn rate, the percentage of users who stop using your product within a certain period, or retention rate, its inverse
No matter which metrics you choose, you’ll need a way to organize them that makes sense for your company’s goals. With Contentsquare’s product analytics tools, you can start from a template to easily create custom dashboards.
For instance, if you want to focus on boosting retention, you could create a new retention dashboard with multiple key metrics like the ratio of daily to monthly users (DAU/MAU) or the session frequency of repeat users.
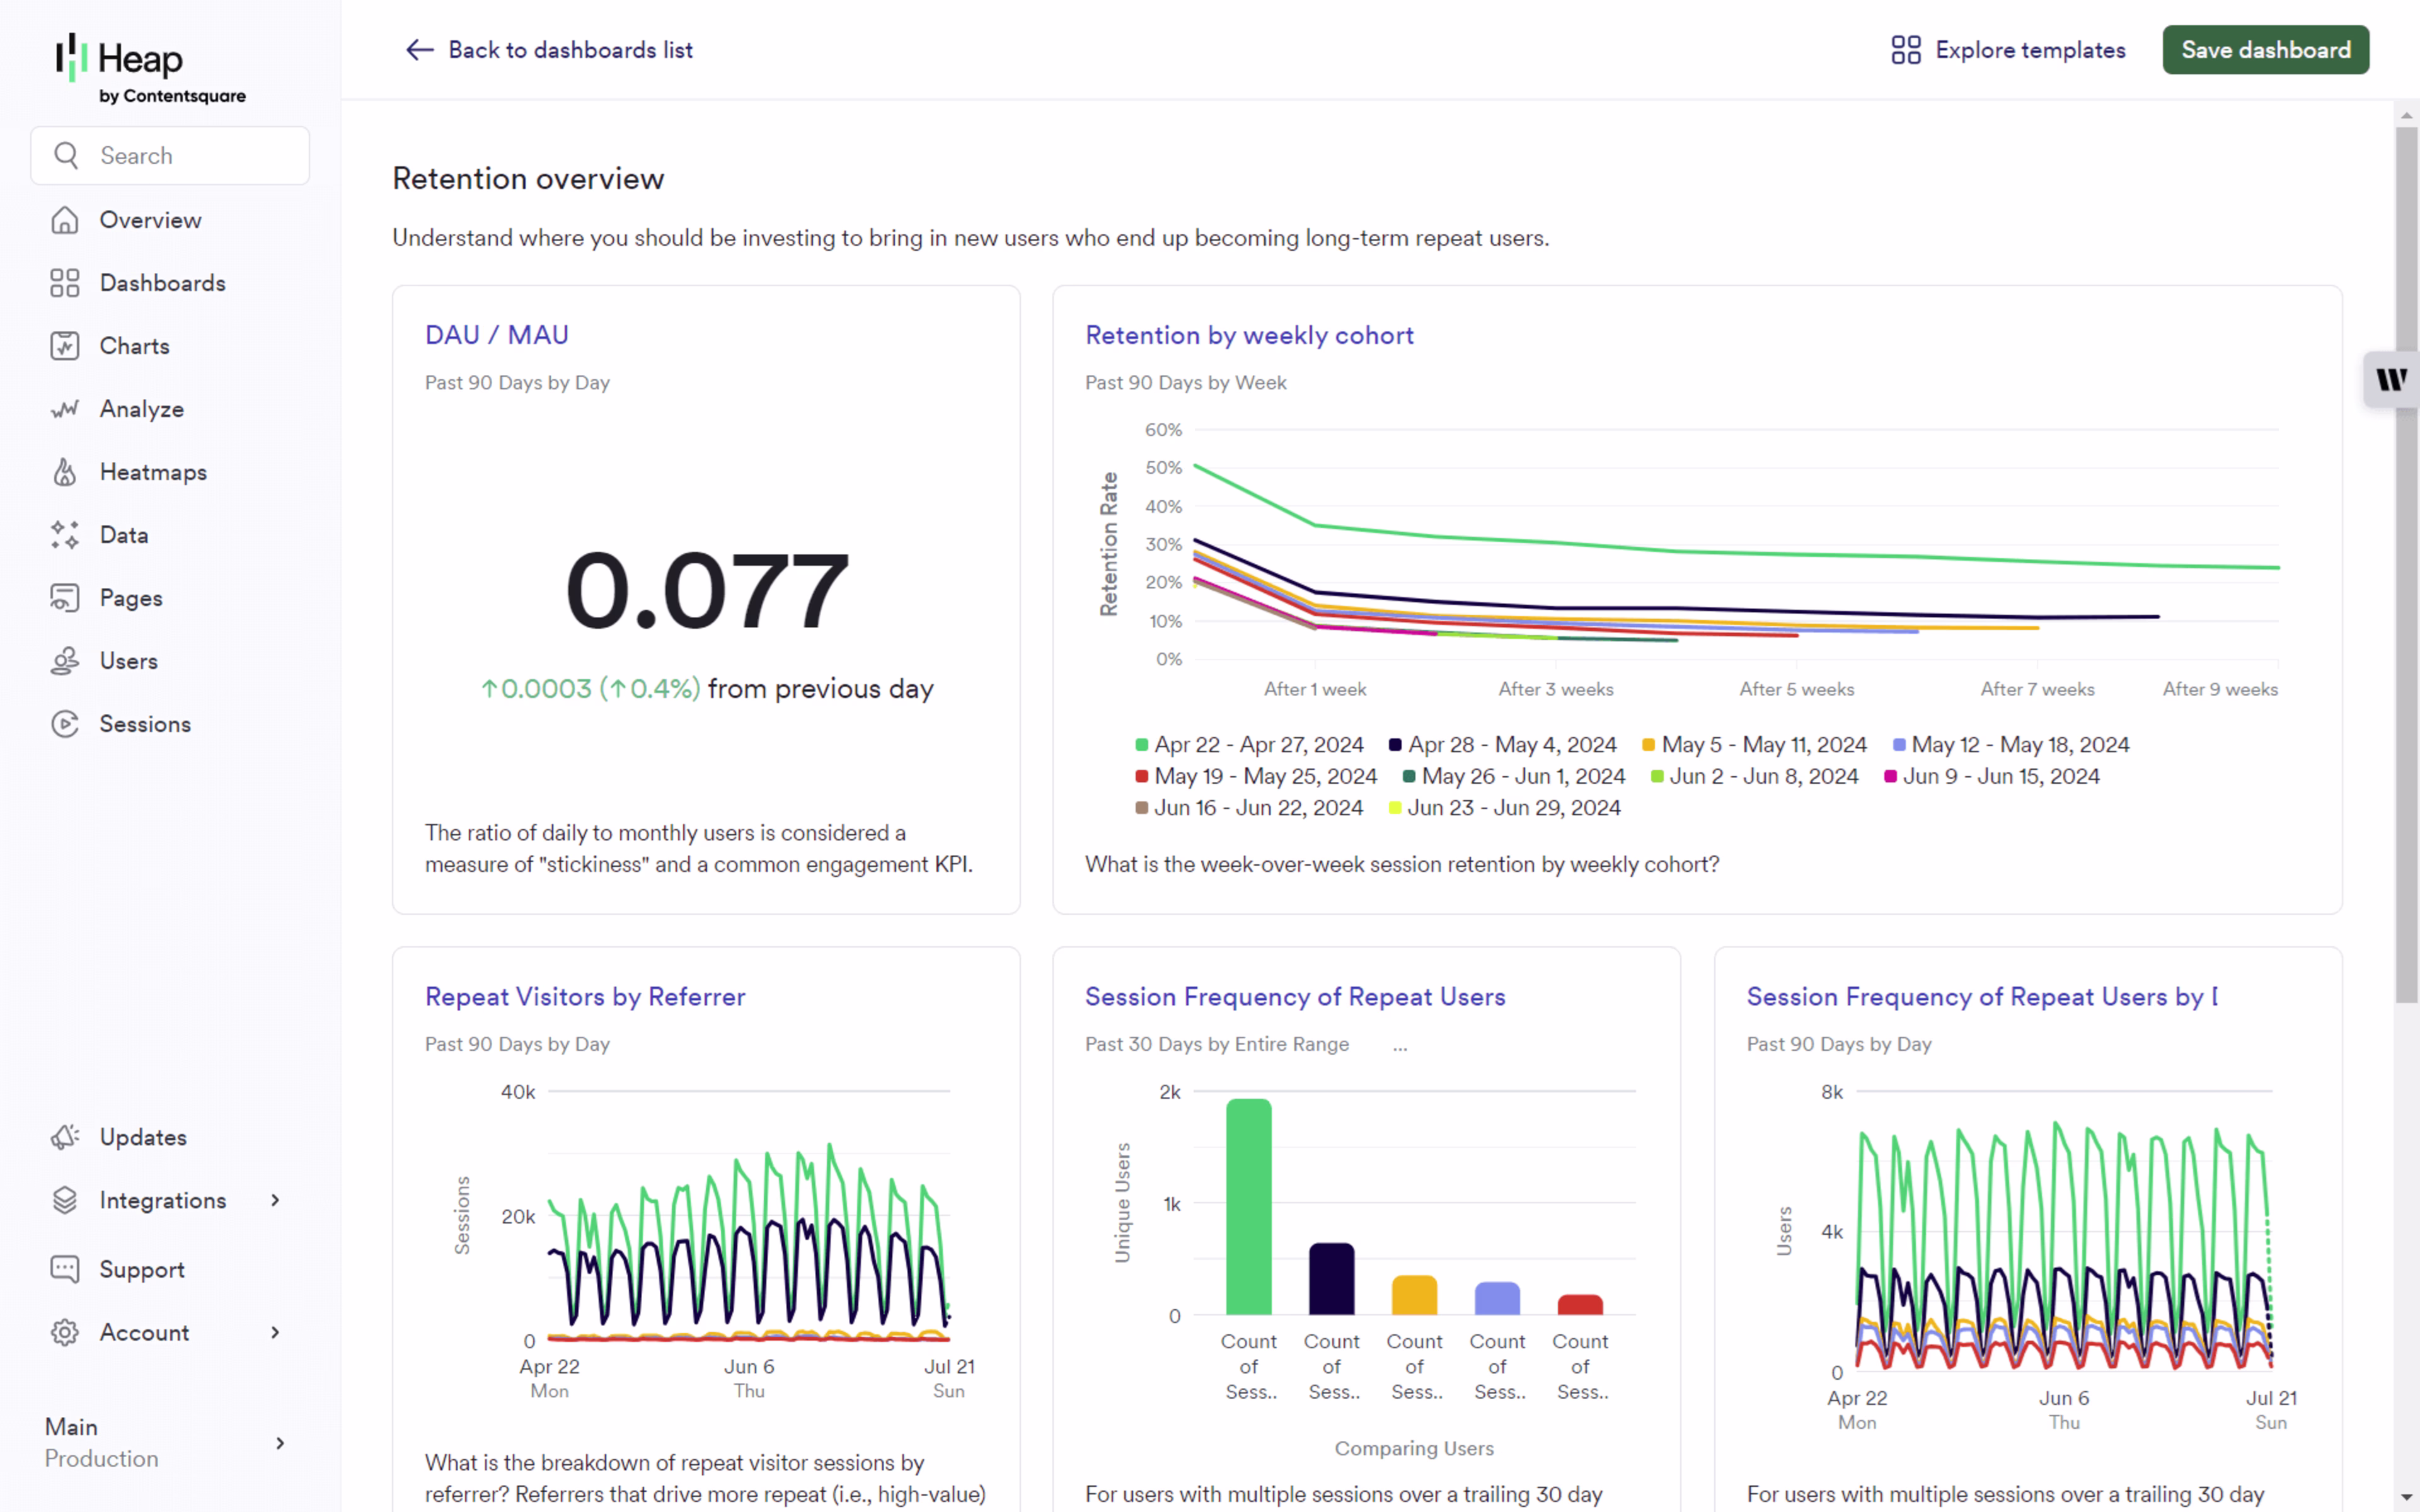
An example retention dashboard showing DAU/MAU and retention metrics by weekly cohort in Contentsquare
👉Track metrics that matter to see results that impress
International financial services group Admiral sees quality assurance (QA) as a key element of their customer-first digital strategy. The team turned to Contentsquare’s Session Replay to monitor sessions and ensure a satisfying journey for their users.
The Admiral QA team focused on session outcome scores as their success metric. Then, using the Contentsquare platform, they monitored more than 1,000 sessions monthly and found and fixed issues important to their users.
As a result, their session outcome scores increased by +15%. This means that the majority of their customers leave the site satisfied—showing the Admiral team that their strategy is working.
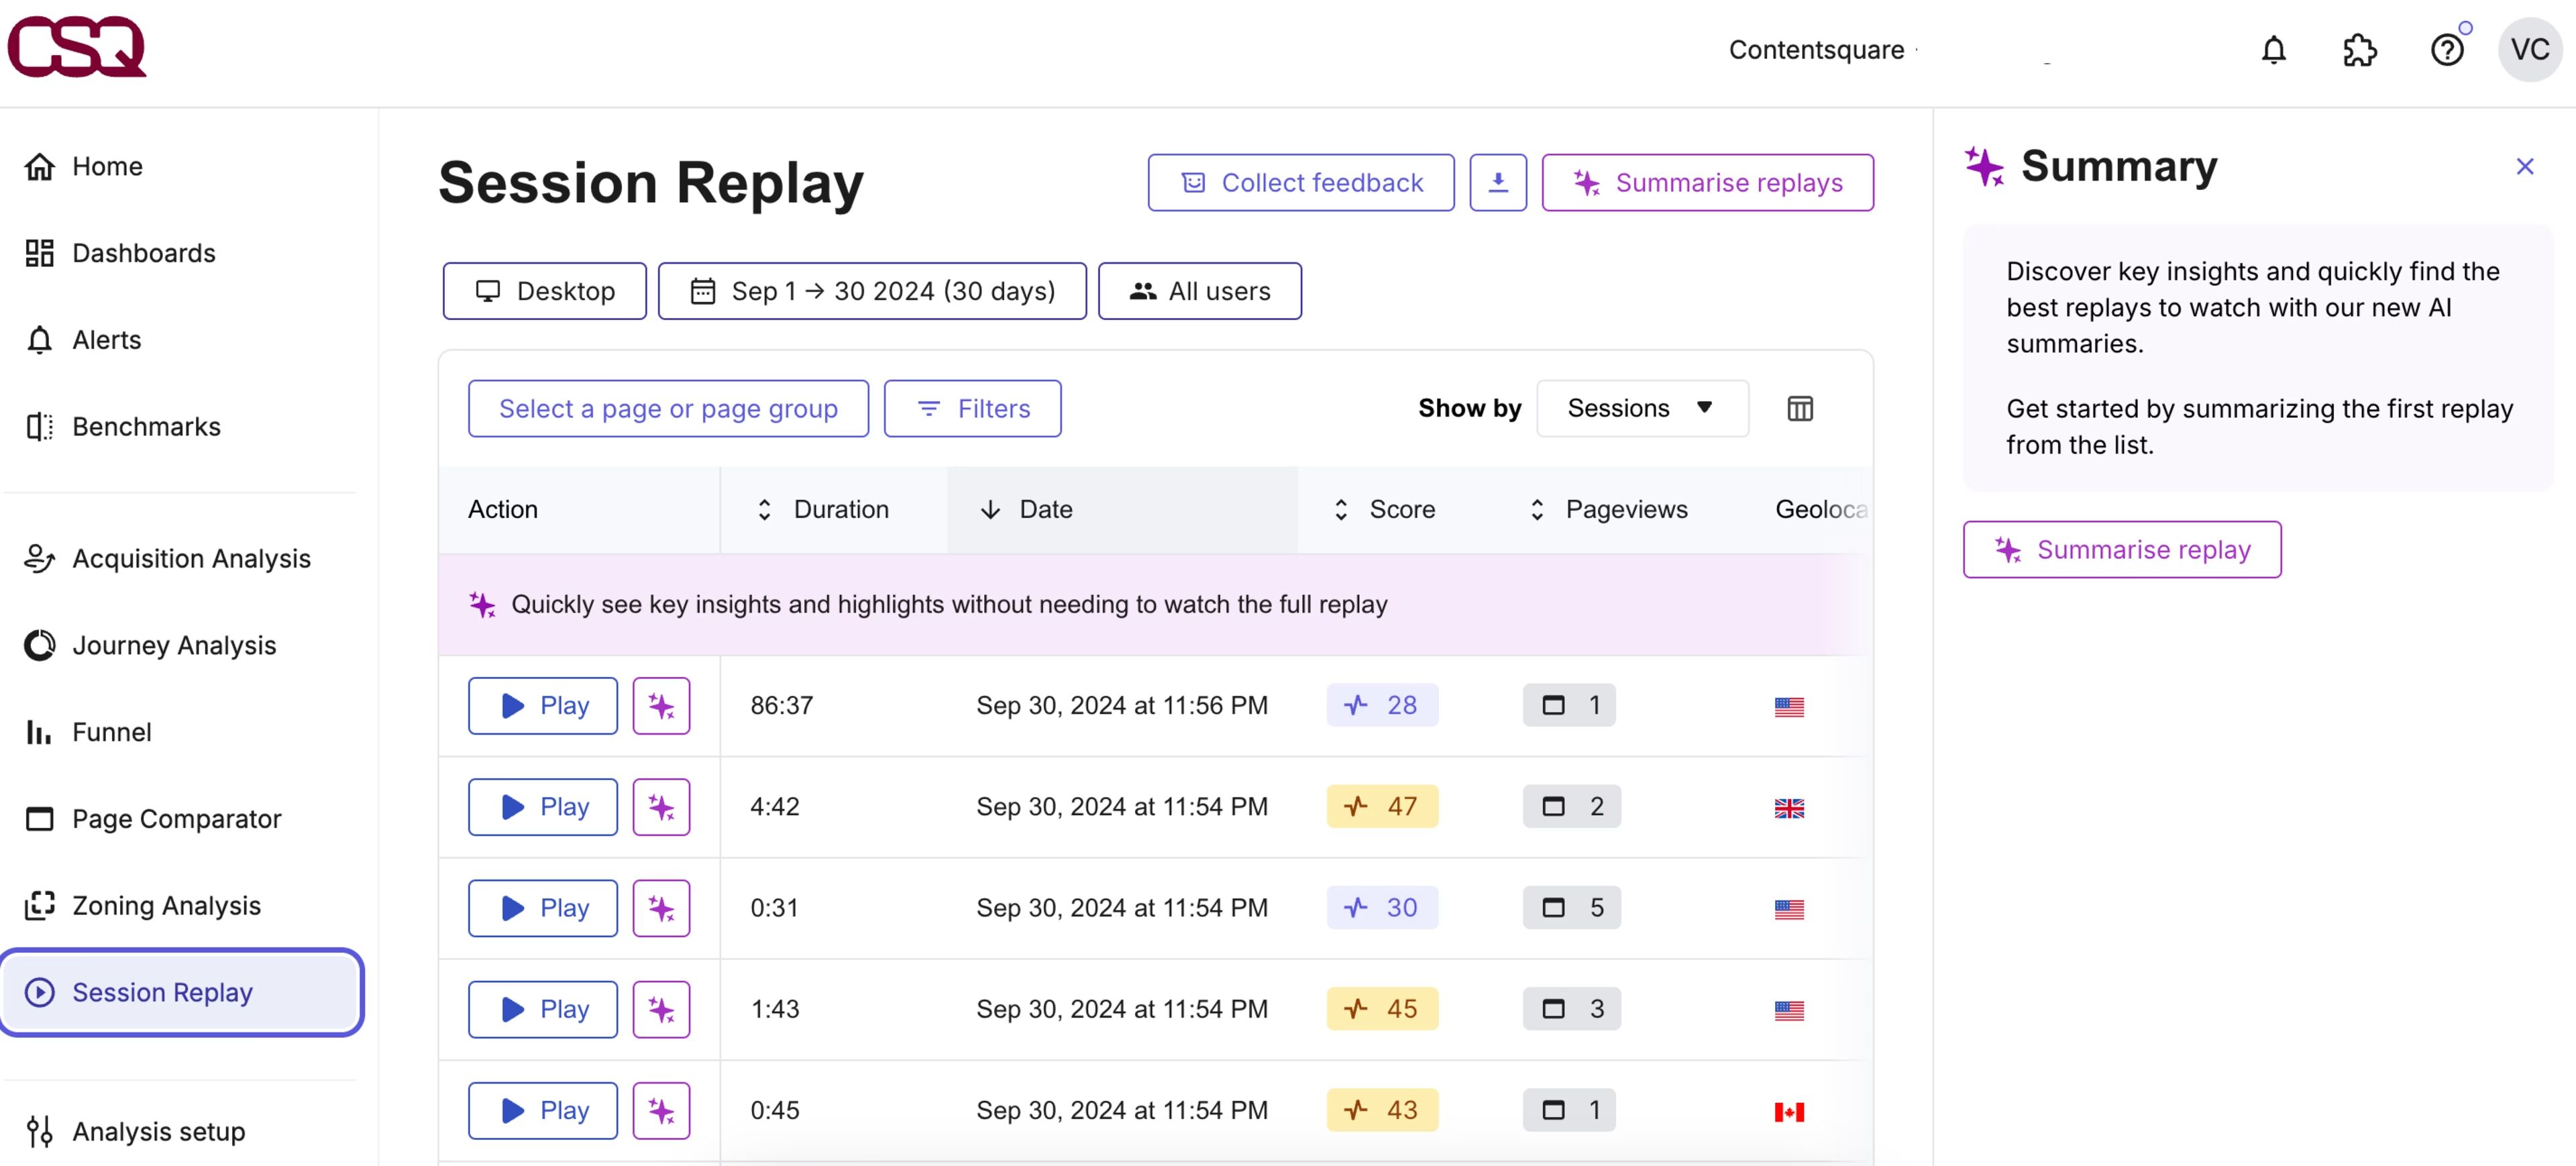
Contentsquare’s Session Replay lets you find and watch relevant recordings of users interacting with your site
3. Select a product analytics platform
To track metrics, you need the right technology. But with so many options on the market, it can be hard to choose.
Brainstorm what capabilities your organization needs to accomplish the objectives you set now—and what additional ones you might want as you scale.
Then, look for a product analytics platform with features that make it easier to carry out your product analytics strategy. A solution like Contentsquare, for example, offers a complete suite of product analytics features, powered by Heap.
Contentsquare’s Product Analytics platform offers features like
Engagement analysis: see your product’s most adopted features and their usage frequency
User segmentation: group users by shared characteristics, like high-value users or customers in the US, to increase CLV
Retention analysis: chart retention over time by user segment and see which features drive loyalty
Funnel analysis: track conversions as users go through a workflow and see what might be causing drop-off
Journey analysis: lets you compare conversion paths across devices so you can optimize those user journeys and provide personalization
Conversion analysis: see conversion metrics and charts, such as how conversions vary by device type
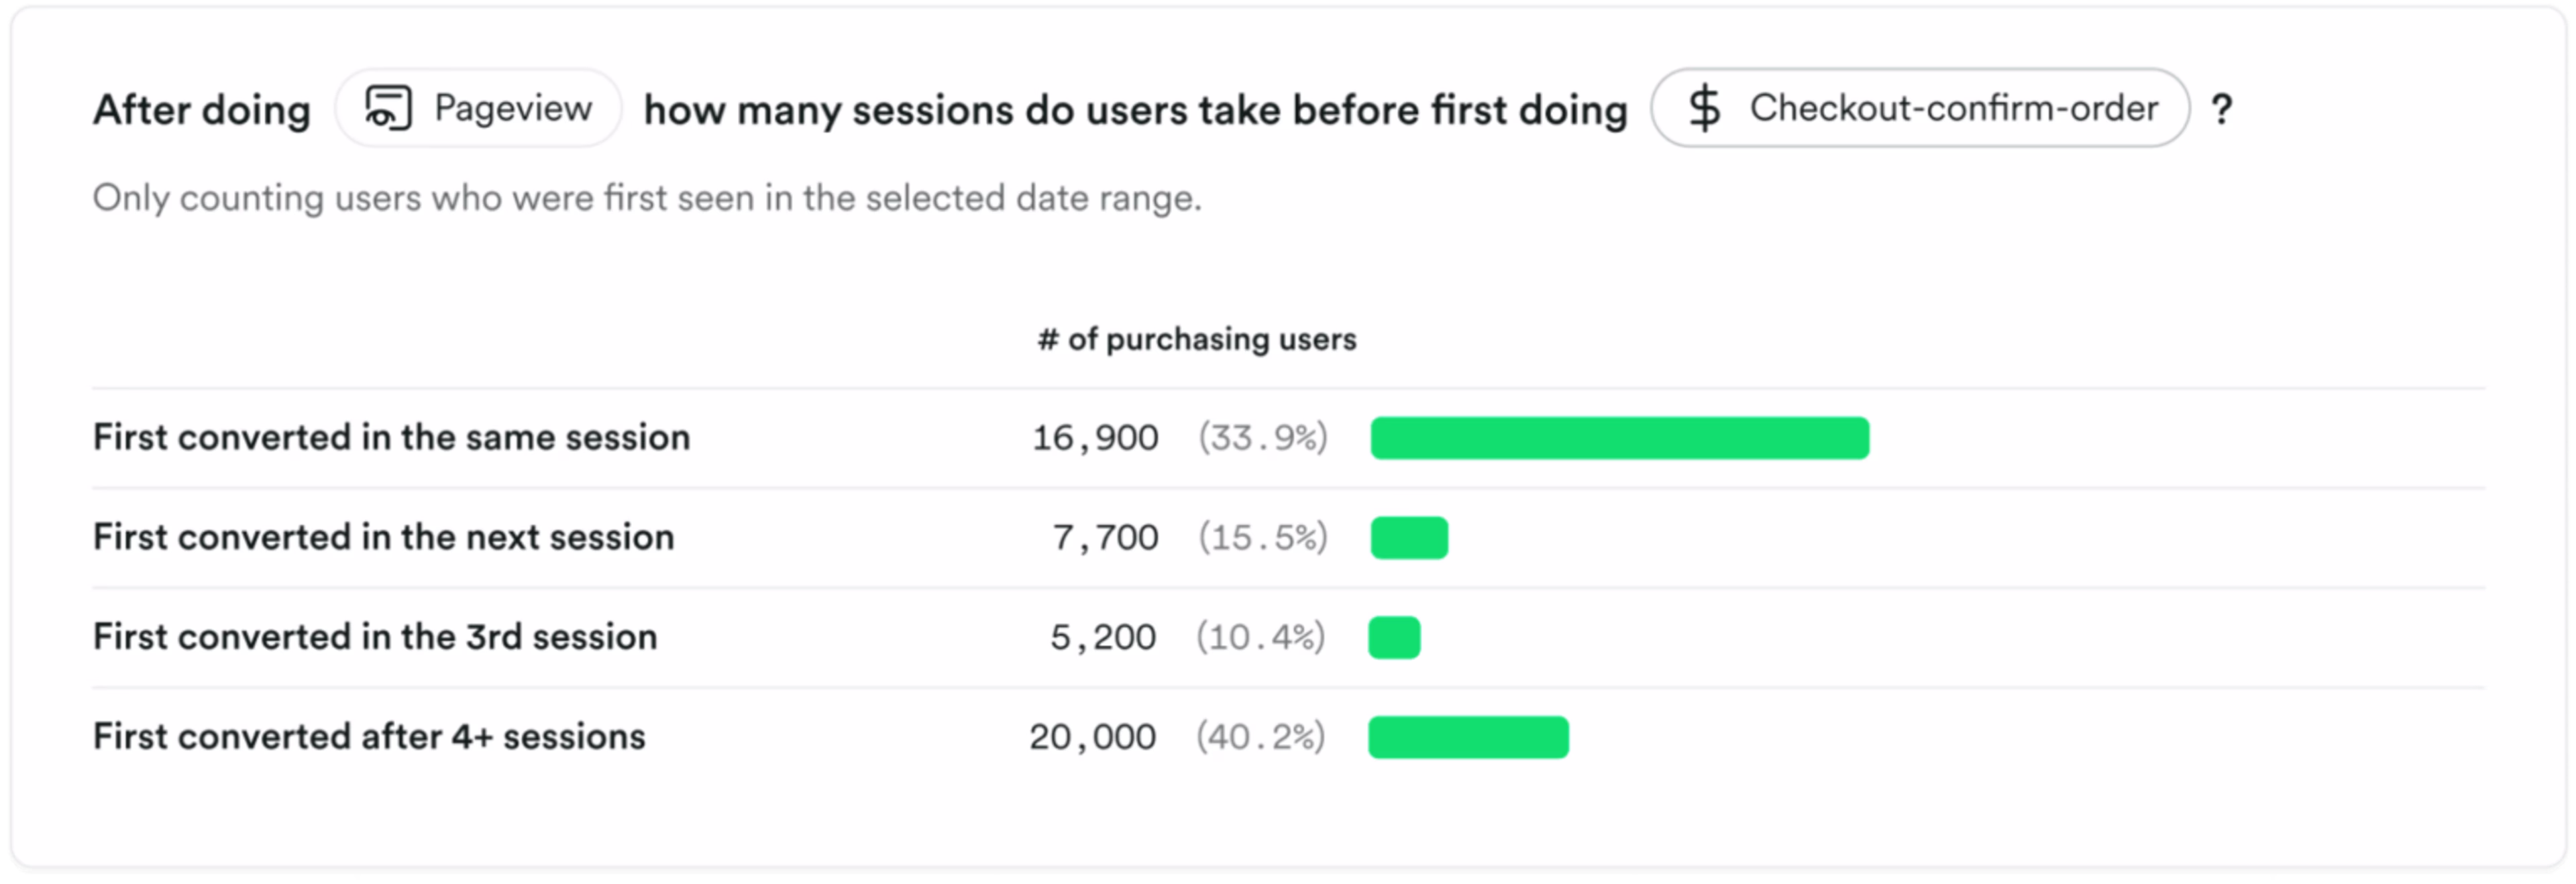
Contentsquare’s Product Analytics tool shows you multi-session conversion metrics
In addition to ensuring your platform has the essential features, it’s also important to choose product analytics software that integrates with other tools and apps and offers a simple user interface (UI). This ensures an easier path to adoption—allowing you to work toward true data democratization. 👏
I love Contentsquare because it makes it easy to increase data engagement across teams because nobody’s scared away by massive tables or complicated tracking.
4. Layer in other tools
Product analytics data is essential—but it’s not the whole story.
Adding digital experience analytics and voice-of-customer insights helps you understand the ‘how’ and ‘why’ behind user behavior, so you base your product decisions on well-rounded data instead of gut feelings.
You need to put your product analytics data in the greater context of your end-to-end user journey. That way, you understand your customers more deeply and visualize the paths users take while using your product. This helps you reduce churn, increase adoption rates, and learn new ways to delight your customers.
Using an all-in-one platform like Contentsquare makes this part much easier. After you analyze metrics using its product analytics features, you can shift seamlessly to its digital experience analytics to get a holistic view of your product’s users with tools like
Journey Analysis to see how users or segments progress through your site in an easy-to-read, color-coded visual. This helps you understand where they’re coming from (literally!) so you can learn ways to personalize and improve the customer experience.
Heatmaps to visualize where your users scroll, hover, and tap or click on your website. Learn what engages them—and what doesn’t.
Session Replay to watch real-time recordings of how users experience your mobile site or app. Discover what frustrates them and find resolutions to these issues.
If you spot issues at a touchpoint, use Voice of Customer tools to hear from users directly about their product experience. Launch surveys in seconds by starting with a template or asking Contentsquare’s AI assistant to generate one for you.
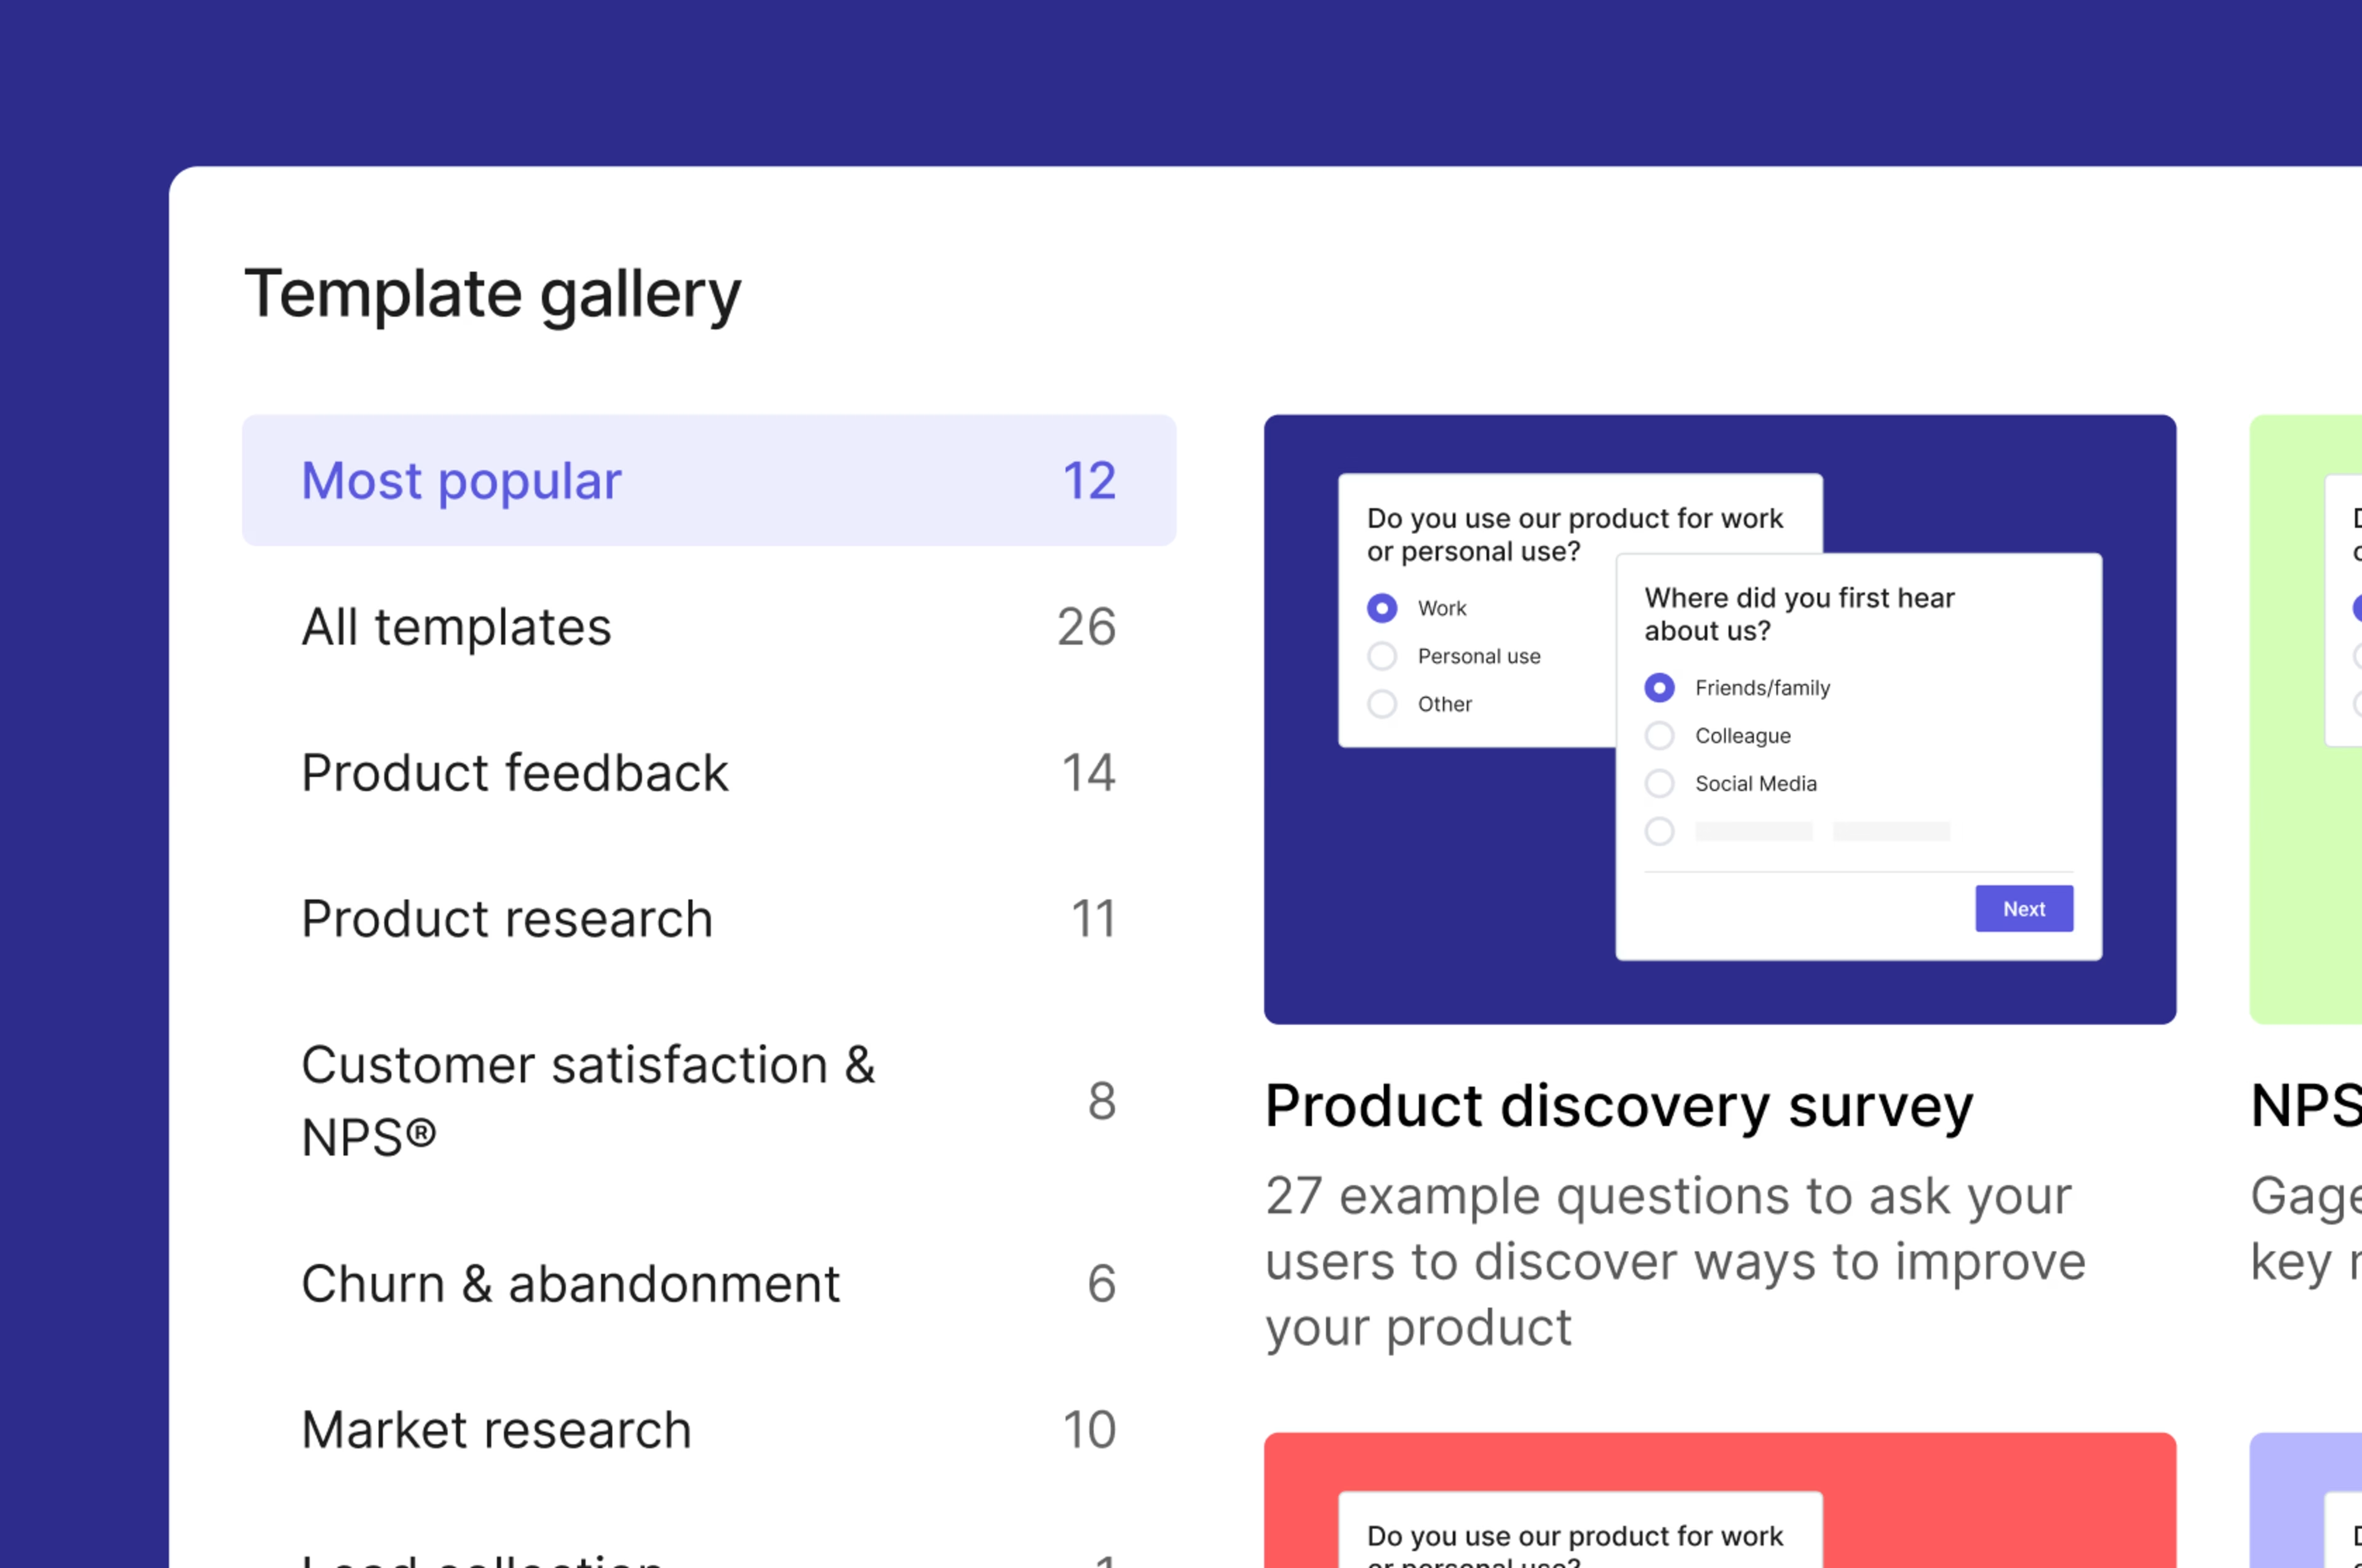
Contentsquare makes it easy to create surveys from a template or with AI
5. Analyze, optimize, and iterate
Based on the data you collect from your product analytics solution, digital experience tools, and VoC, you can easily spot problems like high bounce rates, funnel drop-off points, or underutilized product features.
Then, based on what you see, you can hypothesize improvements and run A/B tests to compare versions and learn what works best for your users. You can do most of this work within a single platform.
At UK-based bank NatWest, the CRO team partnered with the product team to help them personalize and improve their digital customer journeys. Using Contentsquare, they could
Monitor their KPIs and find ways to improve the customer journey
Analyze the data from Zone-Based Heatmaps, Session Replay, and Customer Journey Analysis tools to surface issues
Customize dashboards to monitor their A/B tests and analyze results
For example, after noticing a high exit rate on NatWest’s mobile app savings hub, they hypothesized that the design lacked key information visitors wanted. They tested a variant—and saw a significant uplift in their visitor-to-application completion rate.
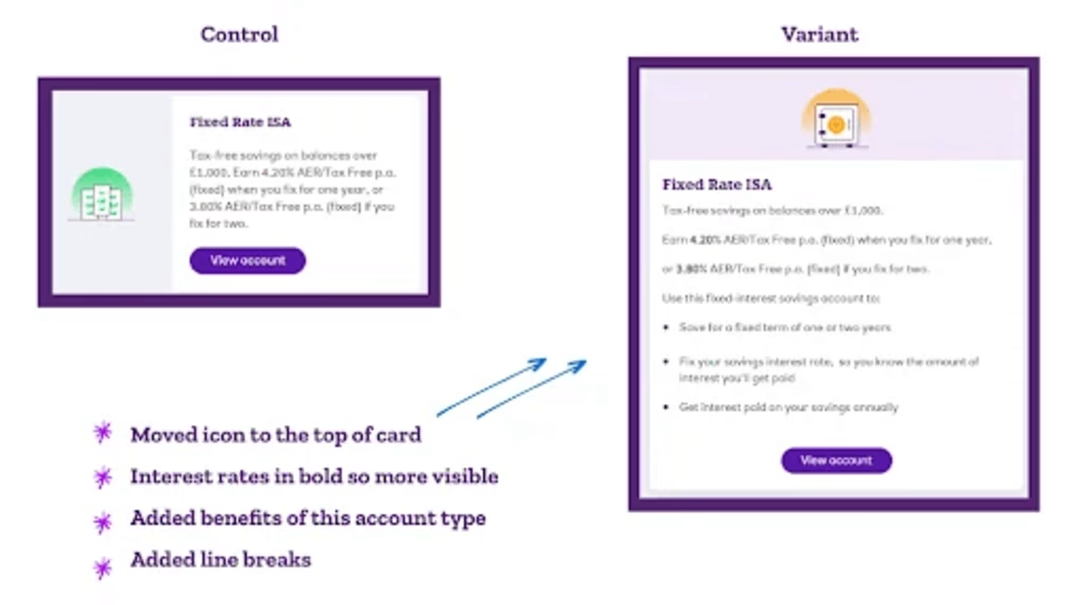
NatWest used insights from Contentsquare to inform a new variant of their mobile app savings hub
💡 Pro tip: create a data-driven culture to create sustainable growth in your organization.
Clear communication goes a long way to ensure the long-term success of your product analytics strategy. Make sure you
Explain your product analytics strategy to team members through live or asynchronous presentations or by sharing a slide deck or document
Clarify why your company chose the tools it did
Emphasize how each function might benefit from the strategy and tools
Then, provide training and support as necessary. As team members implement the strategy, recognize their contributions and wins to provide encouragement and motivation.
Get started with your product analytics strategy
We’ll be honest: building and implementing an advanced product analytics strategy takes work. You need to align your goals with the company’s, choose your focus metrics, find tools to monitor those metrics, and take action based on your insights.
But the effort you put in is worth it if you want to understand the complete customer journey—and ensure users keep coming back.
FAQs about an advanced product analytics strategy
An advanced product analytics strategy is a plan to collect and analyze usage and behavioral data to improve your product. The goal is to guide your teams to optimize the user experience, develop new features and capabilities, and make data-driven decisions.
![[Visual] Contentsquare's Content Team](http://images.ctfassets.net/gwbpo1m641r7/3IVEUbRzFIoC9mf5EJ2qHY/f25ccd2131dfd63f5c63b5b92cc4ba20/Copy_of_Copy_of_BLOG-icp-8117438.jpeg?w=1920&q=100&fit=fill&fm=avif)