![[Visual] stock woman with 2 computer screens](http://images.ctfassets.net/gwbpo1m641r7/6vPvGMnUXFrEYOQUzrQhiW/43c9f93a0d1772ff652e6e427ce1af2c/AdobeStock_899206281.png?w=3840&q=100&fit=fill&fm=avif)
Whether you’re trying to measure how effectively you’re acquiring users or make sense of in-product user journeys, funnels are a great starting point.
Mixpanel’s Funnels lets you track how people move through your website or digital product, measuring their progress at each step to help you make informed decisions that improve your users’ experience while increasing your conversion rates.
The best way to build better products faster is to track metrics and understand your users' behavior across each stage of their journey. Mixpanel’s Funnels empowers you to do just that—and so much more.
This article shows you how to use Mixpanel to analyze user flows and make data-informed decisions that drive results. Here’s what we’ll cover:
What is Mixpanel’s Funnels?
The benefits of using Mixpanel’s Funnels
Types of Mixpanel’s Funnels controls
Types of charts in Mixpanel’s Funnels
3 ways to use Mixpanel’s Funnels to improve conversions
What is Mixpanel’s Funnels?
Mixpanel’s Funnels is a key report that lets you examine how users convert or drop off through a series of steps they take as they engage with your product, app, or website.
Let’s say you have a habit-tracking web app that allows users to log their activities, and you want to find out how many people are accessing the app, creating accounts, and subscribing.
Mixpanel’s Funnels uses an event-based data model to analyze the actions users take—from accessing the website to setting up an account—that propel them to reach the final goal of your product (like purchasing a subscription). This tells you how many users convert across each step of your funnel so you can discover the key drivers of conversion and optimize funnel performance.
![[Visual] Mixpanel funnels example](http://images.ctfassets.net/gwbpo1m641r7/5OXNqtJi8nAaT3W75bfIF7/cd8888acd7d6f69bbf5a7673b1ec9a06/Mixpanel-Funnels__1_.png?w=1920&q=100&fit=fill&fm=avif)
Mixpanel’s Funnels calculates and displays the number of users who complete a series of events within a particular date range
The benefits of using Mixpanel’s Funnels
Mixpanel’s Funnels is an amazing tool to help you gain customer insights and boost conversion rates. Here are a few reasons to add it to your tech stack:
Build funnels and track user journeys with no analytics experience: Mixpanel’s Funnels is a fast and flexible analytics tool for teams that have fairly high data maturity but might not have the time or skills to run Structured Query Language (SQL) queries every time they want an answer to a pressing question like “Are people using the right features?”, “Are they following the right steps to see the added value of your product?”, “Do they come back? And if the answer’s ‘no’, why not?”.
Dive deep into user behavior to measure product performance: each Mixpanel event or step is an interaction with your product. Collectively, they can answer questions about what users are doing and how things have changed over time—with no ambiguity or guesswork. For example, you can learn which features are popular, who your power users are, and the behaviors tied to long-term retention.
See where you lose users and what’s preventing them from converting: identifying where there are drops in the conversion funnel is crucial to the success of early-stage start-ups, but it can also have an impact on established companies. As you understand how your conversion rate varies by user attributes or behavior, you figure out which users are more likely to convert and what causes them to drop off, helping you improve funnel performance.
5 types of Mixpanel Funnels controls
Depending on your product’s intricacy or the question you’re trying to answer, a funnel can be incredibly simple or highly complex.
Maybe you’re looking for more granular information on your habit-tracking web app users, like what activities are being logged. This type of data helps you build a more valuable digital product and tells you who fits into your target market.
To unlock the full potential of your funnel analysis, you need to ensure you’re answering the right questions about your users and their experience. Use these 5 Funnels controls to fine-tune your data and customize your funnel:
Counting method: count users who entered your funnel as ‘Totals’ or ‘Uniques’. Uniques counts all actions by the same user as one, while Totals counts each action separately. This is useful for calculating repeat conversion, like in a sales funnel.
Conversion window: this is the amount of time a user has, after entering the funnel, to be counted as a conversion. Depending on your conversion funnel, this can be altered from seconds to months.
Conversion ordering: reorder the sequence of user actions that define a conversion. ‘Specific order’ allows users to complete each funnel step in the exact order you define, while ‘Any order’ shows the conversion rate for all users in your funnel—regardless of the sequence of steps they take.
Exclusion steps: disregard actions that aren’t relevant to your funnels. Users who take these actions are excluded from your funnel.
Constant properties: holding a property constant in a funnel ensures conversions are only counted for users who maintain a given property or attribute (like a page URL or a device ID) throughout each step of the funnel
![[Visual] Mixpanel funnel analysis](http://images.ctfassets.net/gwbpo1m641r7/1aJoLEU2SgoxKjBN5Bs6Wt/2d7f8f30eaa4dddc68760c19dbeb8a36/Mixpanel-Funnels-controls__1_.png?w=1920&q=100&fit=fill&fm=avif)
Mixpanel Funnels controls empower you to correctly define a funnel and get accurate insights from your analysis
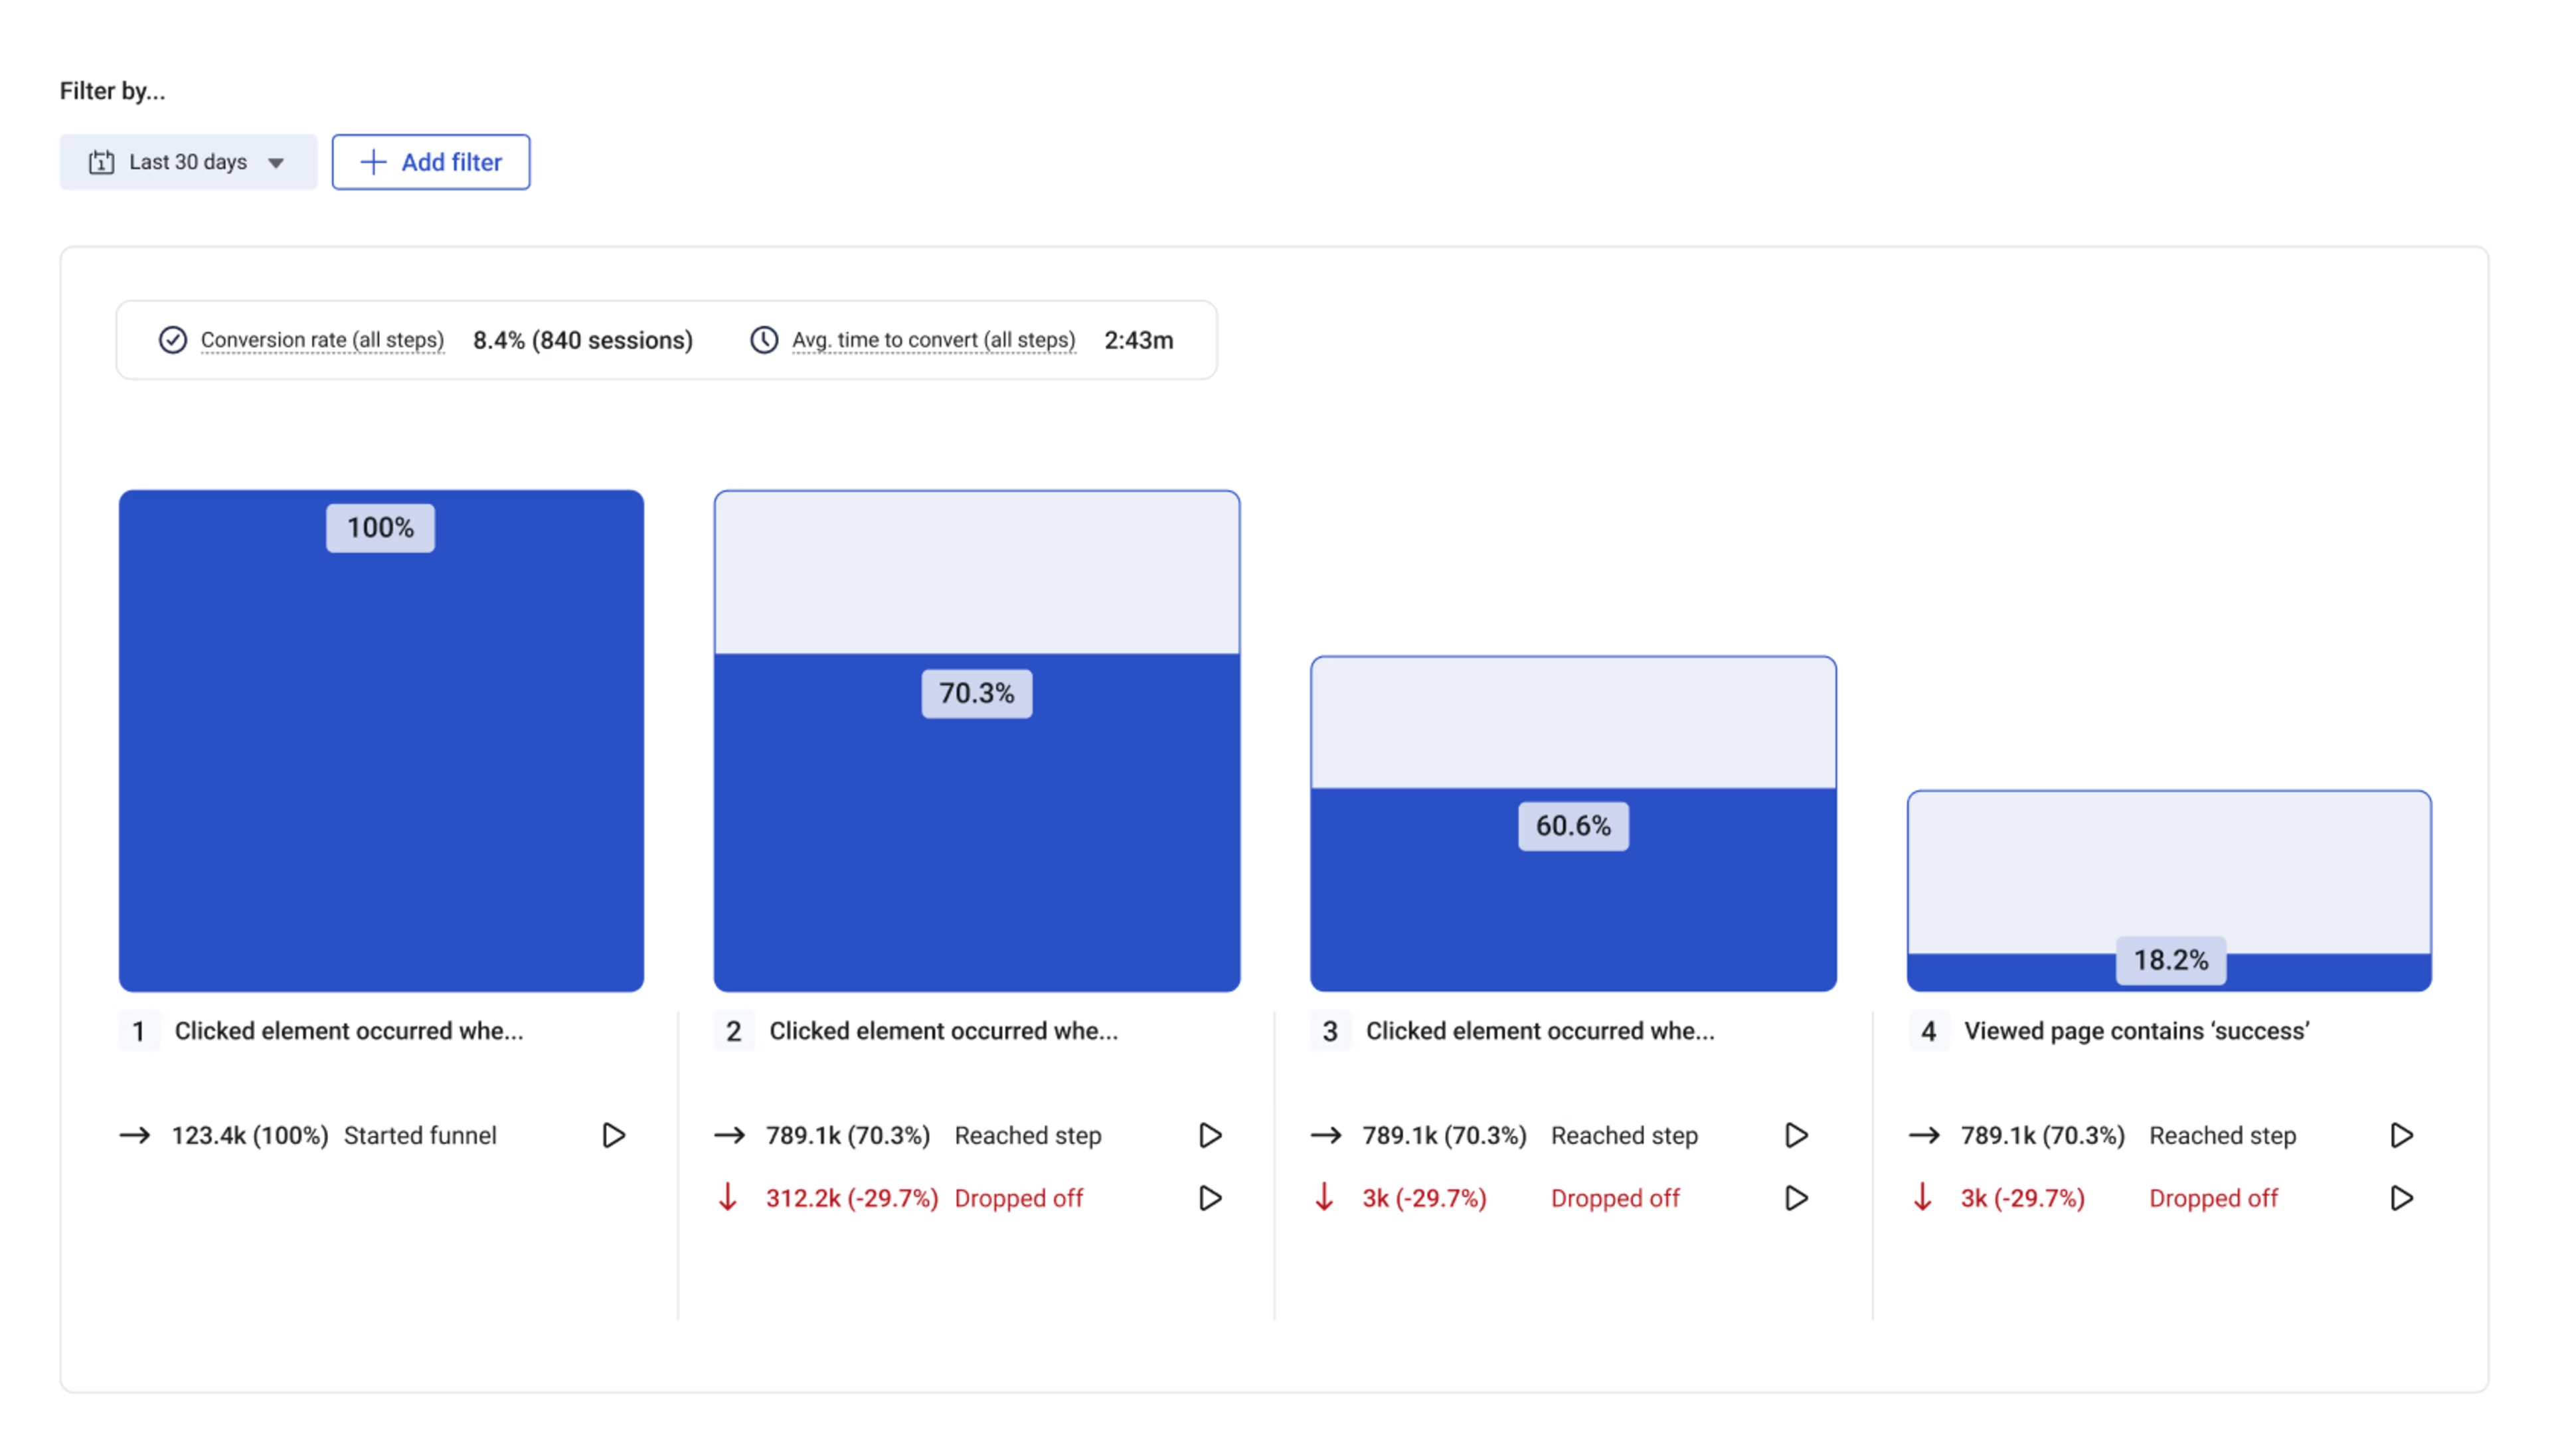
4 types of charts in Mixpanel’s Funnels
Mixpanel gives you several choices to explore your user data, with multiple visualizations and chart options to help you view the results of your query and gain additional insights:
Funnel Steps: displays the percentage of users who advanced to each subsequent step of the funnel
Funnel Trend: visualize changes in your conversion rate, time to conversion, and users entering and exiting your website or product over time
Time to Convert: view a distribution of the time it takes users to convert through the funnel
Frequency: indicates the number of times users complete any step before converting or dropping off
![[Visual] Mixpanel funnel steps chart](http://images.ctfassets.net/gwbpo1m641r7/56cZxkFysFnSfJ03bW4gEn/62c8ba013e2412bd9b62ae993cd6eb7f/Mixpanel-Funnels-charts__1_.png?w=1920&q=100&fit=fill&fm=avif)
The Funnel Steps chart automatically displays the UTM medium with the highest overall conversion rate
3 ways to use Mixpanel’s Funnels to improve conversions
Analyzing Mixpanel’s Funnels gives you insights and hypotheses about how many users—and which ones—complete, or don’t complete, specific actions. Boosting your conversion rates requires you to act on these insights.
Here are some practical examples of how you can use Mixpanel’s Funnels to improve your digital product, app, or website and increase conversions.
1. Map a realistic customer journey—and improve it
Each user has a different way of interacting with your product or site. You might be expecting users to go through a series of steps but the reality might look a bit different.
A customer journey map helps you understand how people interact with and experience your website, products, or business across multiple touchpoints, like interacting with your homepage, using a new feature, or clicking on a call-to-action (CTA) button. Equipped with the knowledge of your users’ behavior, you can eliminate confusing steps and guide them more easily to the next step.
As you use Mixpanel’s Funnels to analyze common paths people take, focus your time on optimizing the parts of your user experience that matter most.
For example, you can use onboarding funnels and in-product behavior analysis to understand where people drop off before converting from free trial users to paid customers, or product-qualified leads (PQLs). These insights help you quickly remove friction from your digital experience and increase conversions.
💡Pro tip: use Contentsquare to observe user behavior and collect feedback on strategic pages to find out what users really need and where they’re struggling.
Metrics only give you half of the story, telling you what’s happening on your website—you need complementary behavior analytics software (like Contentsquare👋) to successfully connect the what to the why.
Use the Contentsquare-Mixpanel integration to access qualitative and quantitative insights and get a different perspective on your user’s experience. For example, an exit-intent survey helps you discover why people are leaving pages with high drop-off rates, and what you can do about it.
If you’re stuck for ideas of what to ask, take a look at our best website survey questions list.

Contentsquare’s Surveys helps you gather useful insights about your users, beyond the high-level usage data in Mixpanel
2. Identify and create cohorts to see where drop-offs happen
Cohorts is another Mixpanel feature that lets you organize your users into groups based on their behavior or attributes, such as ‘new’, ‘active’, or ‘power users’.
You can then take a closer look at those users—like the ones who drop off at a specific point in your habit-tracking app’s onboarding funnel—and dig deeper into the user experience by tracking this cohort throughout your other Mixpanel reports.
Let’s say the data suggests there’s an issue between steps 1 and 2 of your funnel that doesn’t apply equally to all users. In this case, breaking down your data by cohorts provides more detail as to why certain users didn’t complete a step.
Try segmenting by different users or event properties you’d previously set up, and look for any discrepancies in your website conversion rate. By taking a closer look at a particular group of users who drop off, you can understand the flaws in your customer journey that need to be prioritized and addressed.
💡Pro tip: use Contentsquare’s Funnel Analysis capability to pinpoint exactly where users are dropping off in your conversion process.
Then, leverage Contentsquare’s Journey Analysis capability to visualize the paths users take before and after these critical points. By comparing behaviors of different segments—like converters vs. non-converters—you can uncover patterns such as repeat page visits or back-and-forth navigation that may indicate confusion or obstacles.
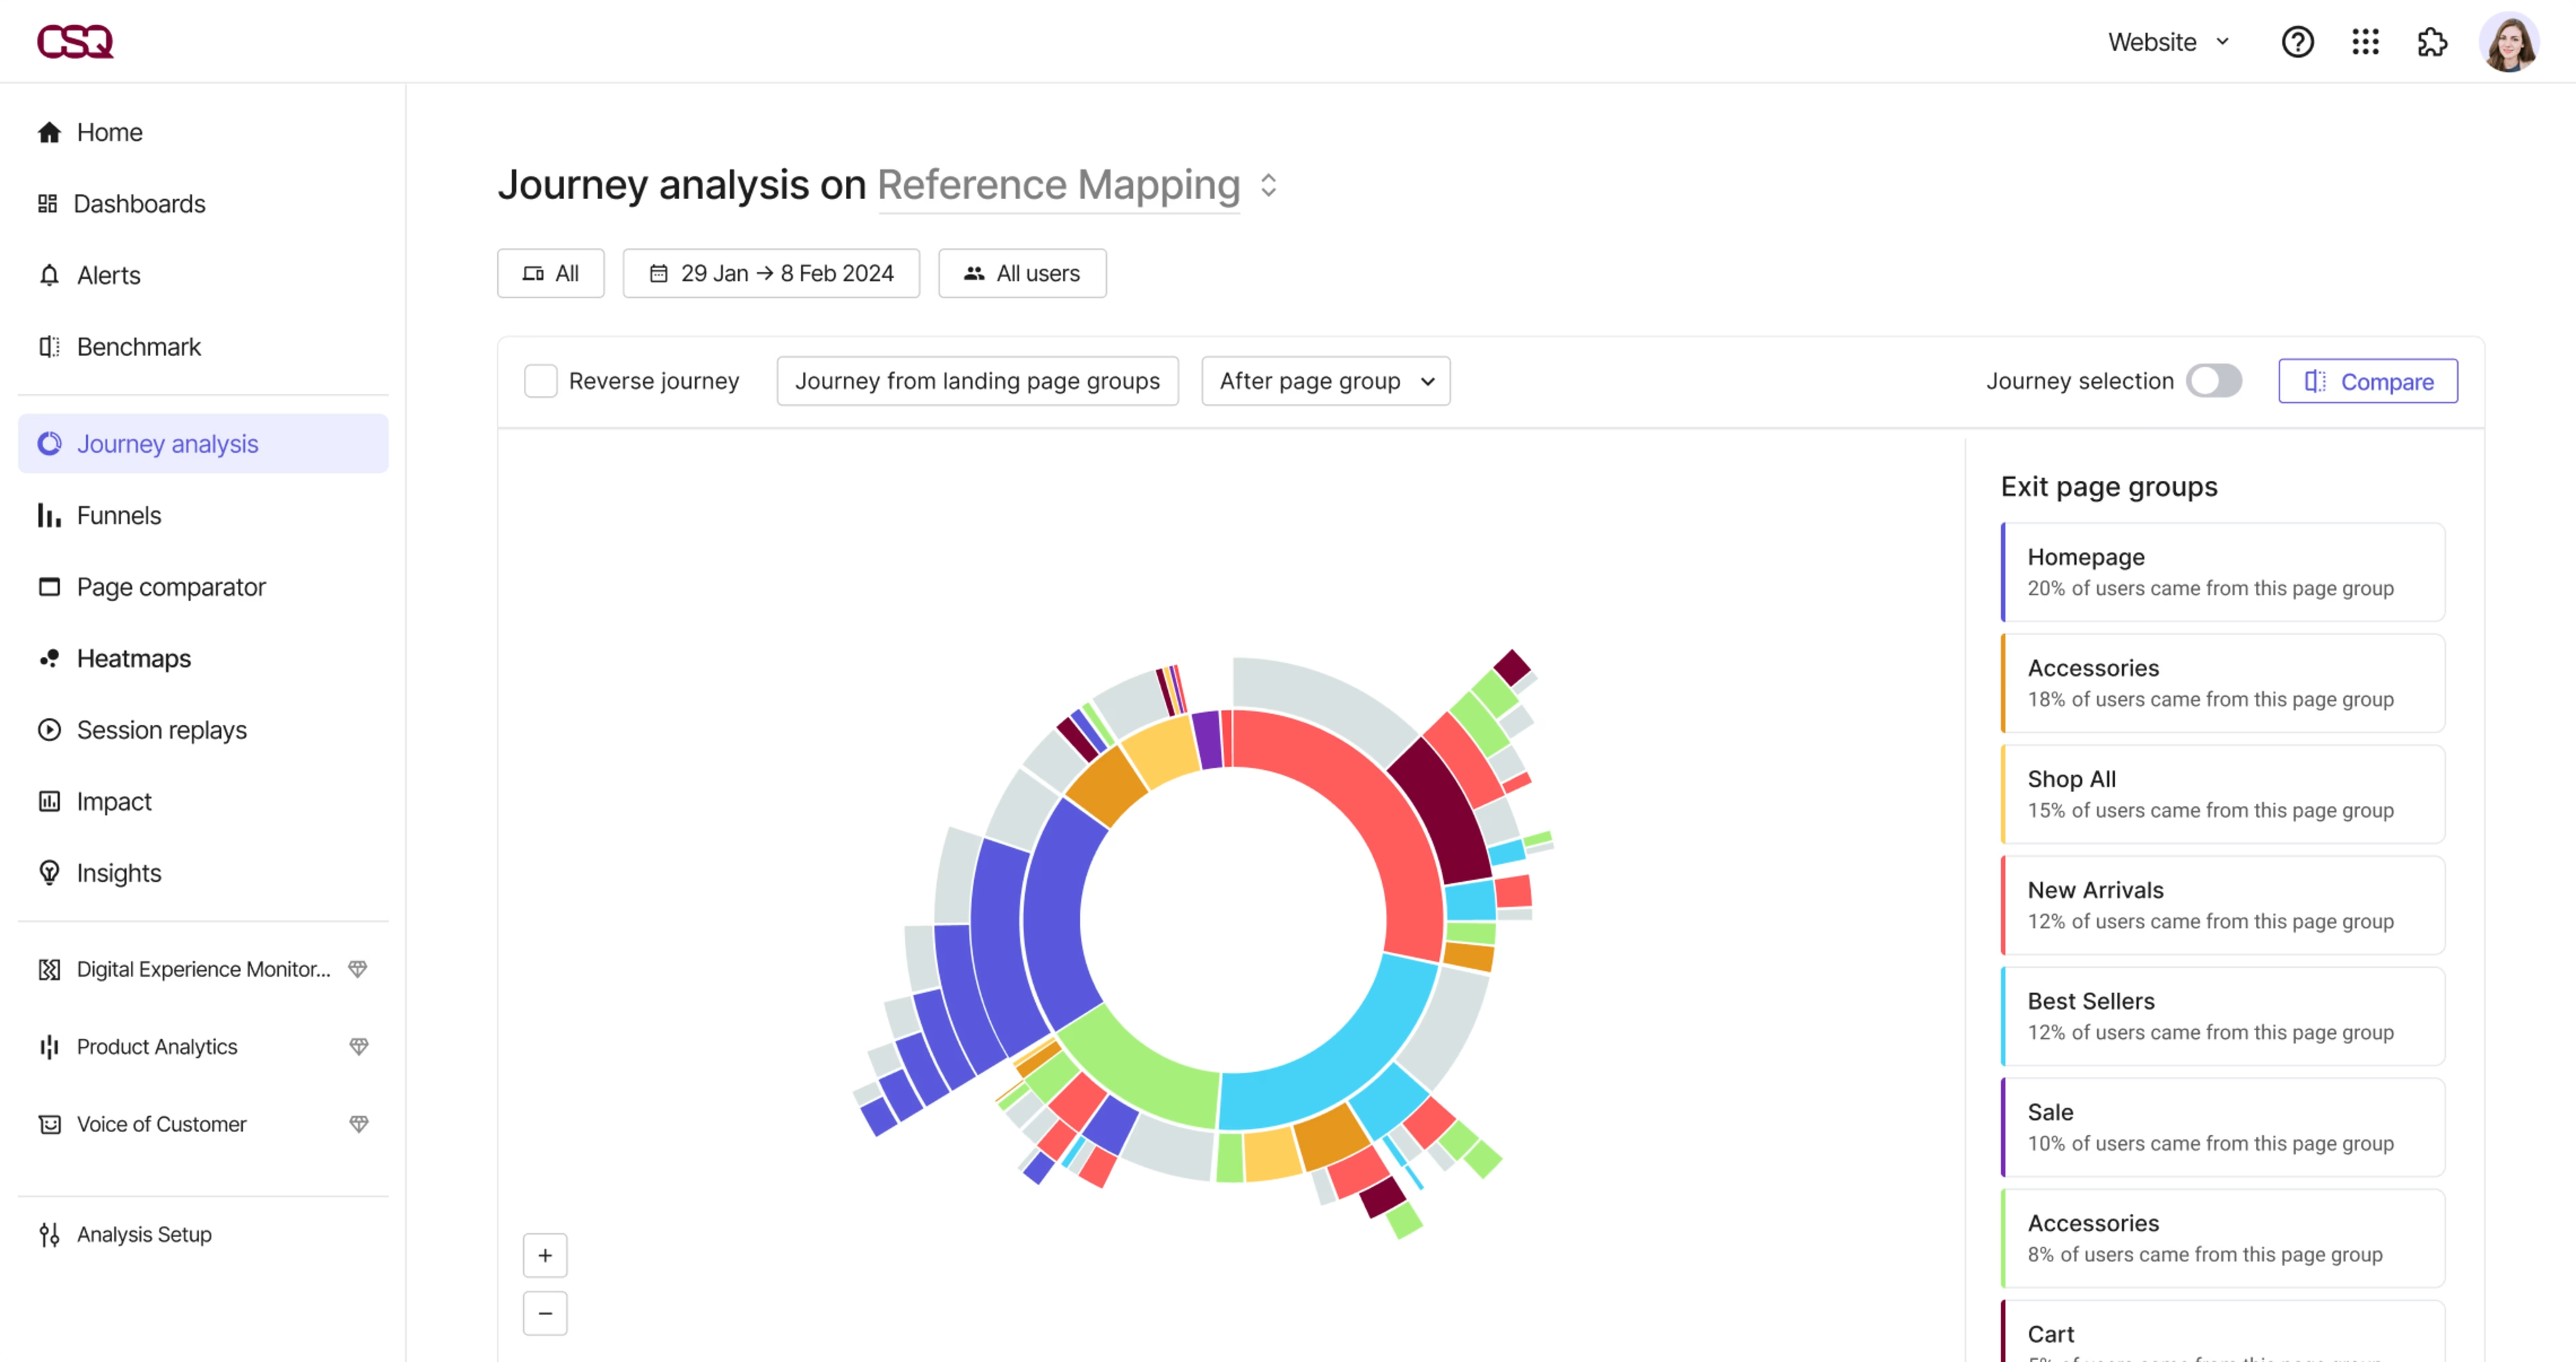
See where users drop off and how they got there with Contentsquare’s Journey Analysis
3. Run A/B tests to optimize conversion funnels
Make your funnel data actionable by running experiments in Mixpanel to validate which changes have the biggest impact on conversions.
The entire idea behind using Mixpanel’s Funnels is to figure out where and why you’re losing customers—then optimize those areas to increase your conversion rate. Mixpanel’s built-in experimentation feature helps you do just that by letting you run A/B tests directly from the platform.
Conducting A/B testing or split-testing—a method of comparing variations of web pages, app interfaces, ads, or emails—on your entire user base is great. But Mixpanel’s Funnels data lets you deploy segmented tests—like only addressing users that complete certain steps in your funnel—to hone your product faster.
These tests provide more actionable data, allowing teams to make informed decisions to optimize sales funnels and acquisition strategies. There’s a reason why a majority of companies that systematically use A/B testing report conversion rate improvements of over 10%.
Note: this functionality is limited to mobile apps, so you'll need another A/B testing tool to run tests across websites or web apps.
💡Pro tip: A/B tests tell you which version of your product converts better, but they don't provide insight into why that’s the case.
Contentsquare is designed to give you actionable user data so you can spot common areas of friction in the user experience on your website or web app (Mixpanel can only A/B test mobile apps), get ideas for improvements, and find out if, and why, your fixes are working. Here’s how:
Use Heatmaps to identify elements that convert or frustrate users: see where visitors click, scroll, and move their mouse on individual pages; analyze how users are interacting with a new feature; and prioritize bug fixes that improve UX
Use Session Replay to find out why people are dropping off: spot opportunities to reduce bounce rates and keep people engaged by watching session replays from users who left without converting. Look for patterns of user behavior—did they navigate erratically? Did they miss an important link? Did they encounter a bug? Answer these questions and you’ll know what needs improving.
![[Visual] AB Testing and session replay](http://images.ctfassets.net/gwbpo1m641r7/3pyi6K866dXK51H98XtJnd/fa1e174cb7560d0cd9e565aca3fb9019/Experience_Analytics_-_AB_Test__1_.png?w=3840&q=100&fit=fill&fm=avif)
Supercharge your A/B tests with Contentsquare’s Session Replay capability
Next steps to using Mixpanel
Setting up Mixpanel and building and analyzing funnels are just the first steps to understanding the value you deliver to your users.
Combining these insights with qualitative data from a digital experience platform like Contentsquare helps you go beyond the surface-level data you get from Mixpanel’s Funnels—giving you a deeper understanding of key user flows and behaviors in your digital product, website, or web app, so you know exactly what’s driving your numbers.
Take a look at these following chapters for more opportunities to guide your users through your product's value and deepen engagement:
Mixpanel Events: what events to track in Mixpanel—and why
Mixpanel Reports: how to build relevant reports in Mixpanel
Mixpanel Cohorts: how to segment your audience using cohorts
FAQs about Mixpanel’s Funnels
Setting up Mixpanel’s Funnels is an easy step-by-step process:
From the dashboard, find ‘Funnels’ under the ‘Reports’ dropdown menu
Create a new ‘Funnel report’
From the left panel, add ‘Steps’ that are part of your funnel cycle
A chart will be created with the select attributes, with more details below the chart

![[visual] Discover what funnels are, the different types, and how you can use funnels to boost conversions.](http://images.ctfassets.net/gwbpo1m641r7/5OKDYOttrNvFtweel6pFGy/41991916af32d75f8ce005cfba337e53/Discover_what_funnels_are__the_different_types__and_how_you_can_use_funnels_to_boost_conversions..jpg?w=1920&q=100&fit=fill&fm=avif)
![[visual]Here’s how funnel analysis can help identify traffic sources and spot high-exit pages to increase conversion rates.](http://images.ctfassets.net/gwbpo1m641r7/2DtfGgUNINRSWoSZeNxjWk/b75299ebf5c517d5419328e3f6338226/AdobeStock_559727472.jpg?w=1920&q=100&fit=fill&fm=avif)