![[Visual] [Guide] [Marketers] Issues](http://images.ctfassets.net/gwbpo1m641r7/5ApgG8j60bWEavpEyyIg1h/ebad9a0937c0294cd91a15013ffa895d/pexels-mutecevvil-20447502.jpg?w=3840&q=100&fit=fill&fm=avif)
You’ve spent hours putting together your latest marketing campaign, paid for ads, and designed pixel-perfect landing pages—but all it takes is a few pesky little bugs to annoy visitors and send them running to your competitors. The solution? Learn how to spot and fix website issues before they impact your success.
This guide shows you how to use tools to find, monitor, and solve website issues—including both technical errors and UX problems—without having to retrain as a developer. Use these insights to create better user experiences and improve the success of your campaigns.
How to find issues when launching something new
Launching something new or rolling out updates introduces plenty of opportunity for error. Here are some things to consider before and after sending changes live to make sure everything works as it should.
Before launch
Before you press ‘publish’, run the following manual and automated tests on your website to ensure its technical and UX aspects are up to scratch.
Perform cross-browser testing
Testing your new site page(s) across multiple browsers and devices to see how they render and perform at different resolutions helps you spot design and usability problems before they affect real users.
Tools like BrowserStack make it easy to simulate different browser environments and interact with your site on each to make sure everything looks correct before launch.
💡 Pro tip: look at your analytics data to identify and quantify the most popular technologies your target customers rely on. Use this insight to prioritize the most impactful browsers, screen resolutions, and devices to test your designs on before launch.
To do this, use a tool like Contentsquare Dashboards. To see which operating systems your visitors use, open up the Dashboards tab of your Contentsquare account, select ‘Create a new dashboard’, and click on the blue button that says ‘+ Add a widget’.
For the ‘Metric’ field, click on ‘Number of sessions’, and for the ‘Group by’ field, click on ‘OS’. This will bring up a widget that shows how many sessions your site gets from users on each operating system.
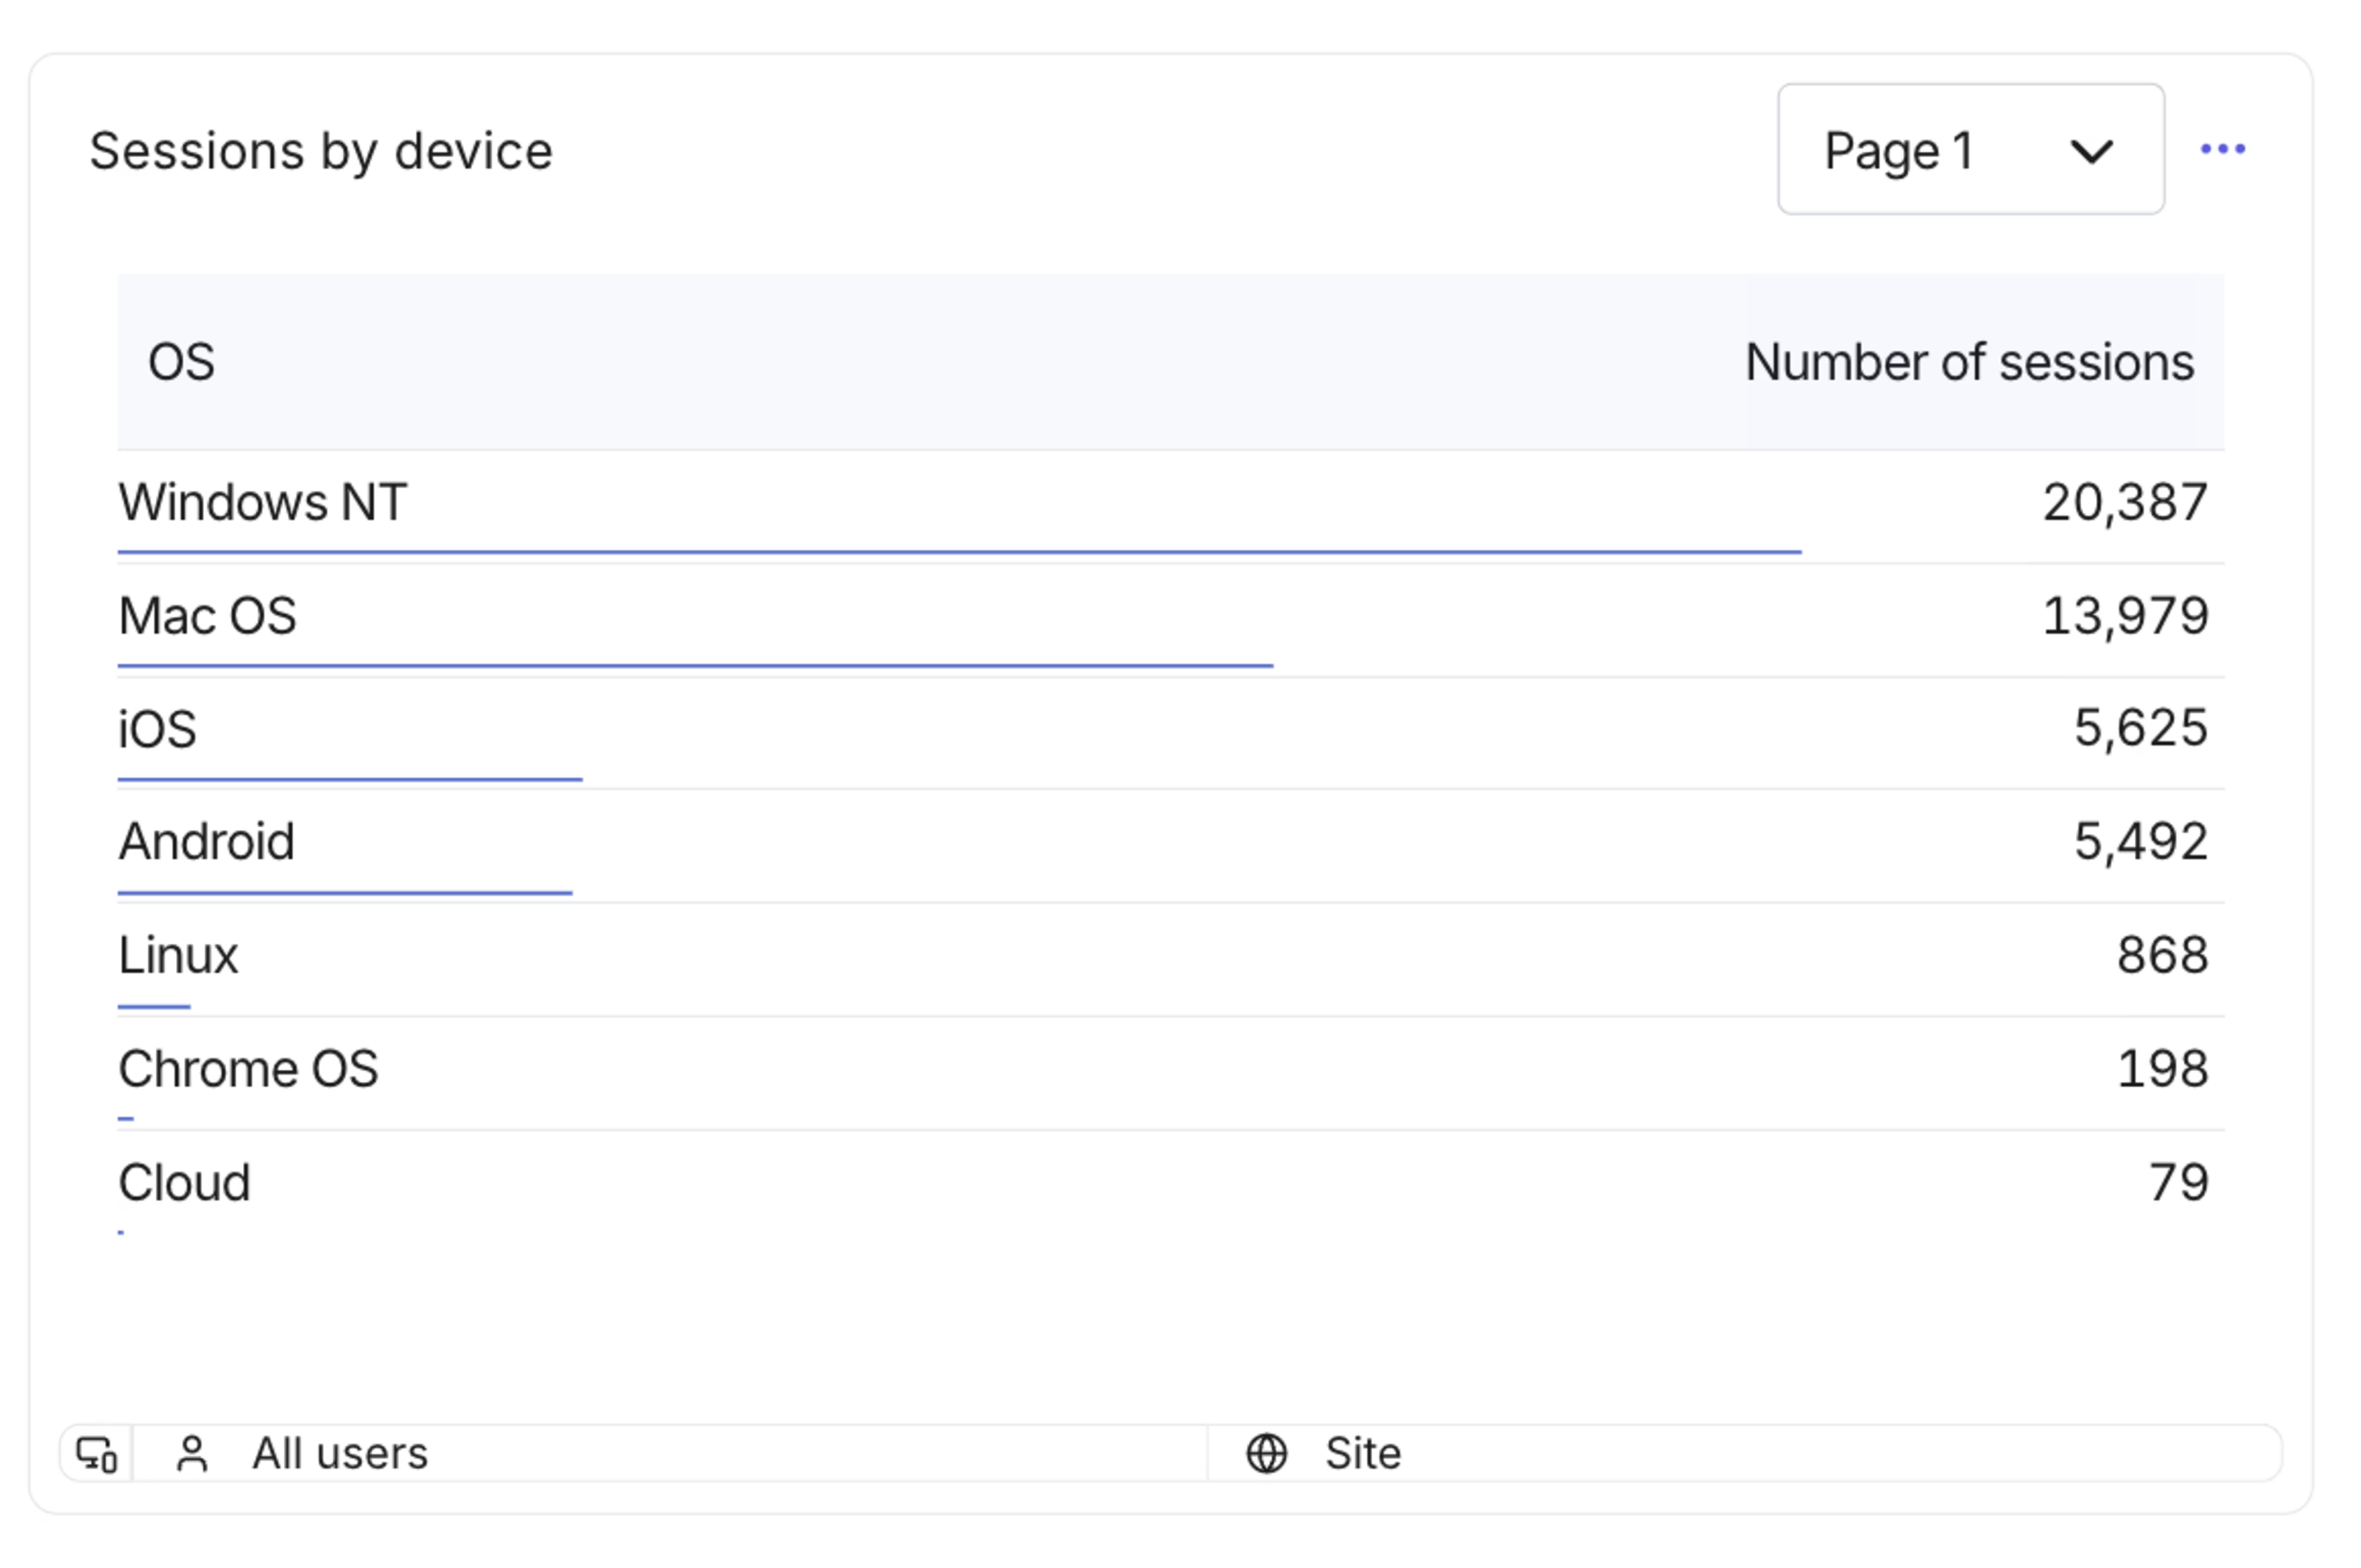
Use this method to see which devices and browsers are most common among your users, so you know which versions of your site to debug first
Test your site on real or target users
Getting real or target users to navigate and review your new designs before they go live gives you the chance to spot problems before they affect your brand’s reputation.
For example, you could test whether a logo redesign resonates with your target buyers in the way you anticipate or verify whether a new landing page design is easy enough to navigate.
You can do this by
Running concept tests like card sorting, tree testing, and surveys to get feedback on new logos, messaging, or designs before going live
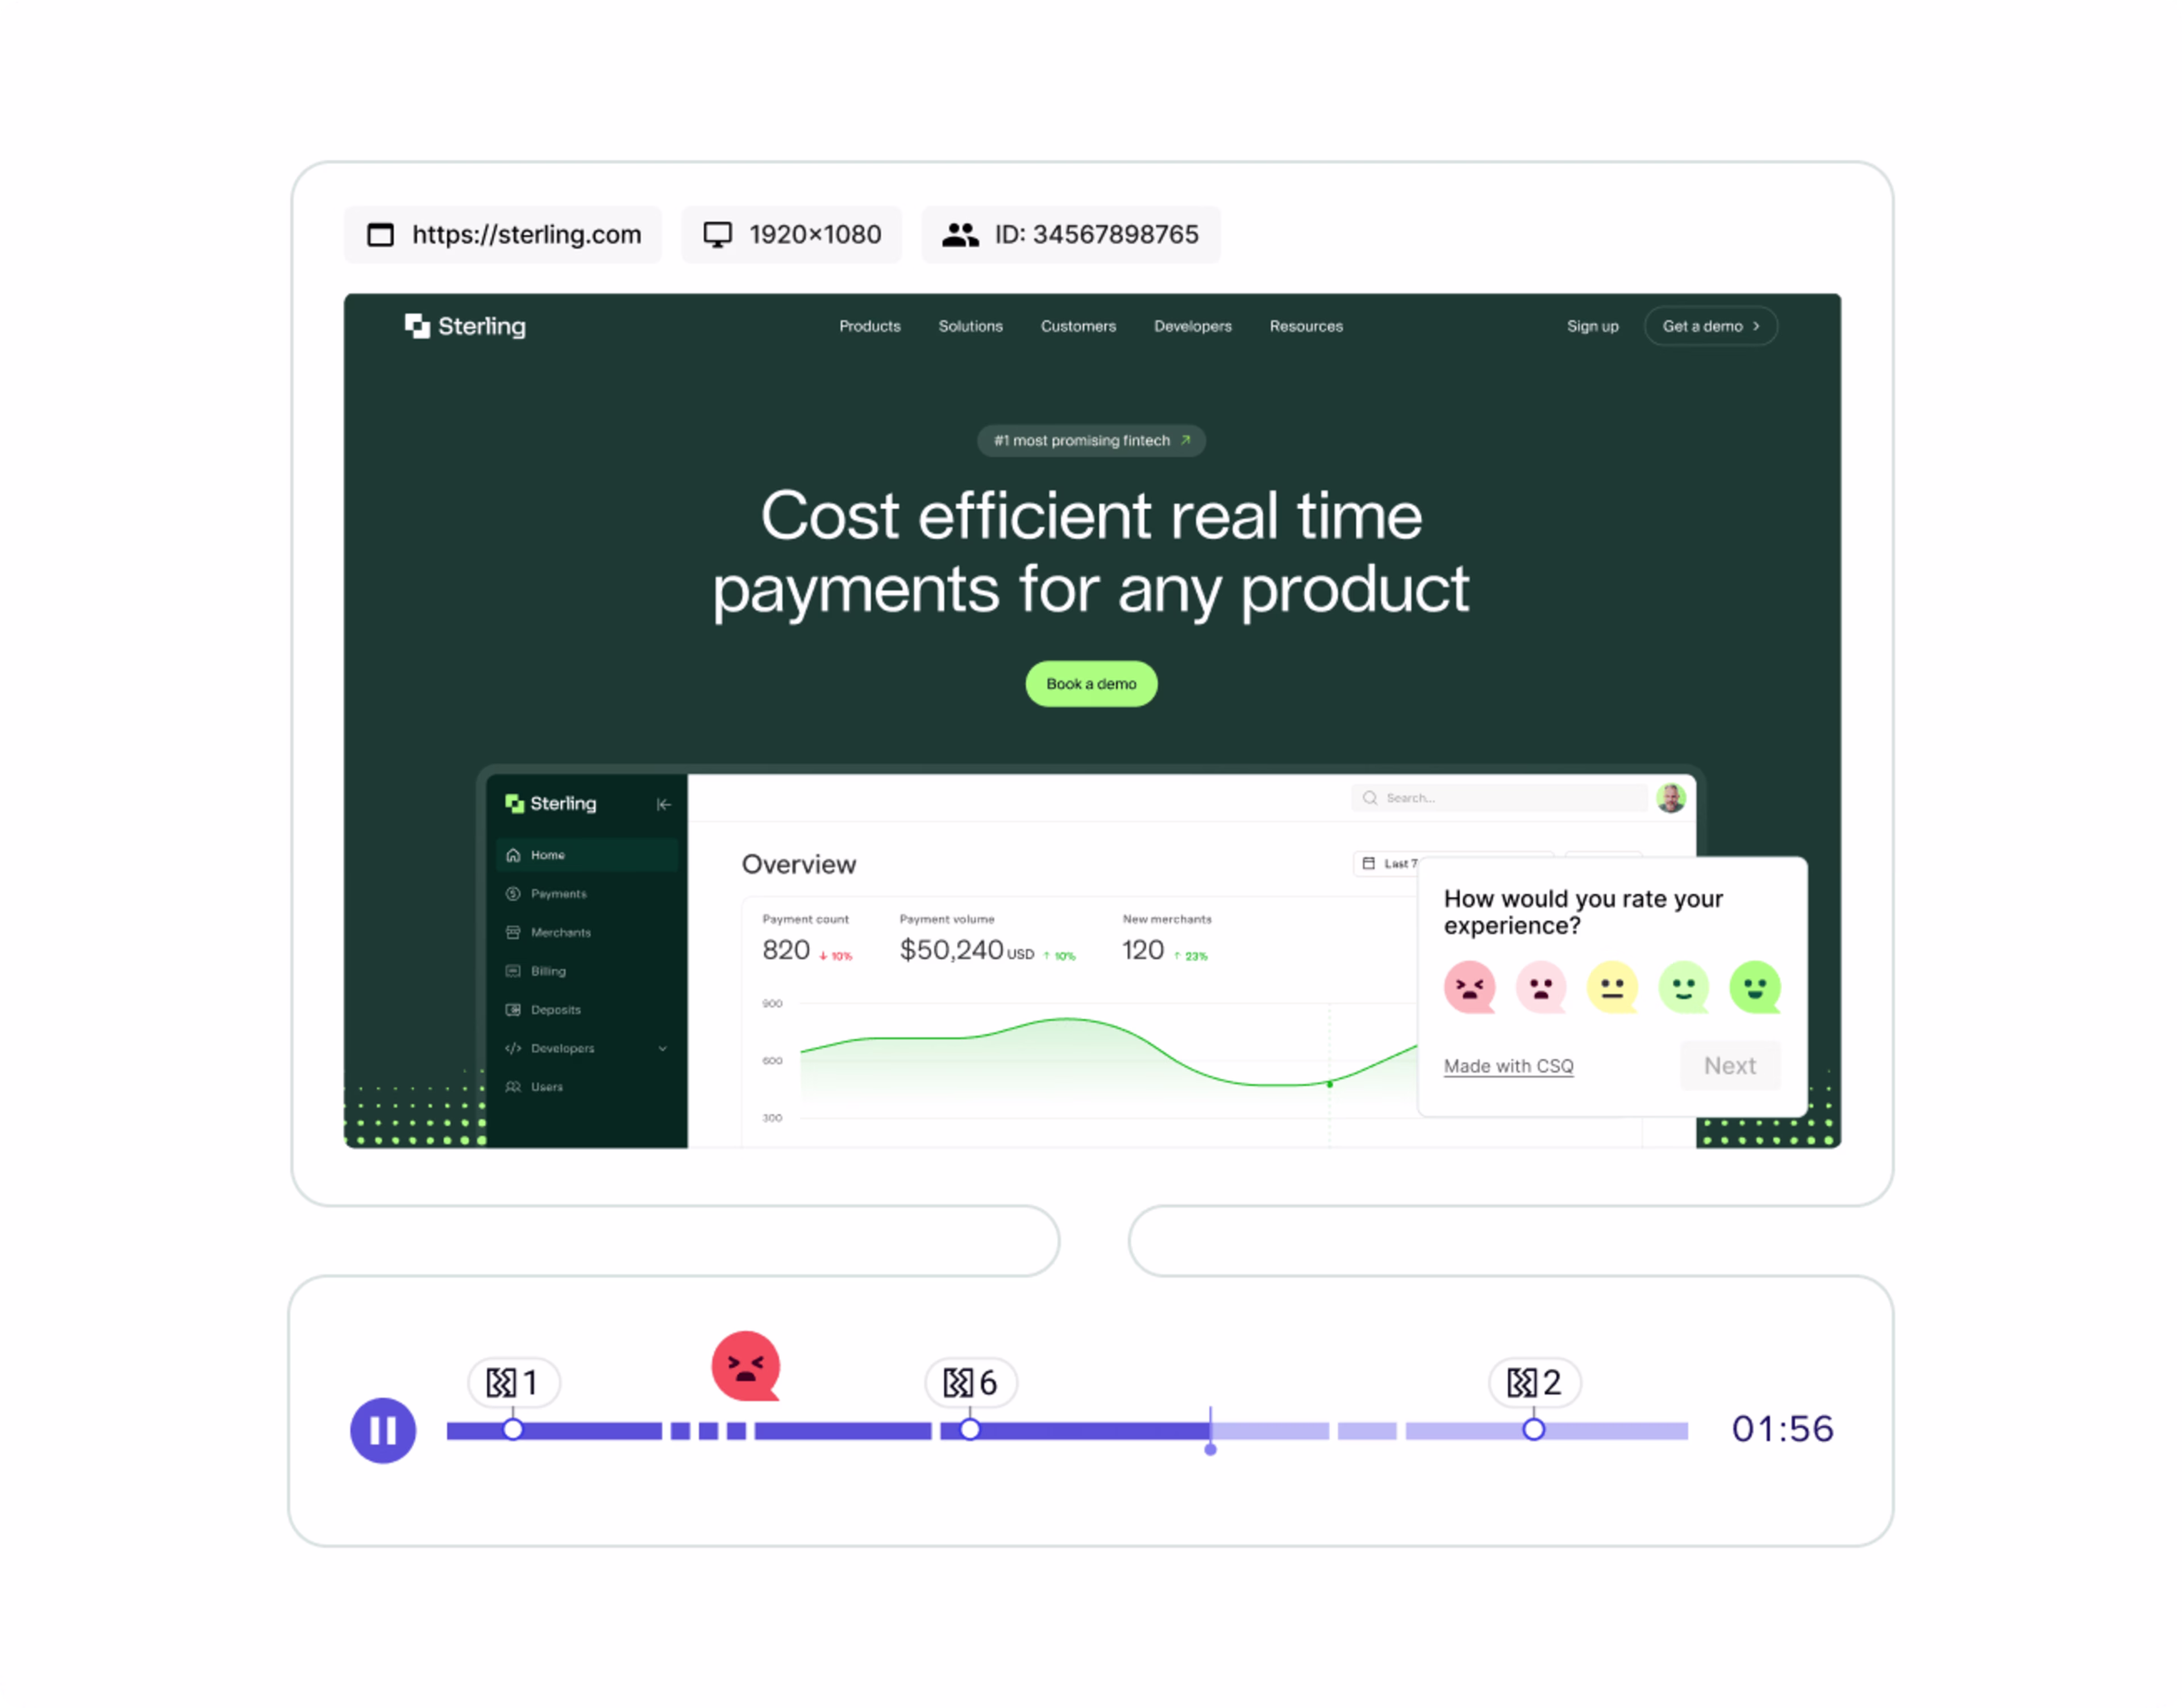
Running moderated user interviews with a tool like Contentsquare’s User Tests to see how people navigate your design in real time and ask follow-up questions

Contentsquare’s User Tests in action
After launch
Once your redesign or update has gone live, it’s time to double-check that everything works as it should.
Confirm tracking scripts are working
Making website changes can easily lead to accidental broken or missing tracking scripts. Check that all your marketing analytics tools are tracking your pages correctly to avoid missing data in your reports.
If you’re using Contentsquare and want to see that your tracking code is collecting data, click your initials in the top right corner of the page, and then on ‘Console’ to view your settings.
How to check if Contentsquare is collecting data from your website
Watch real user interactions early on
Every user on your site is unique, and even the most diligent pre-launch tests can’t guarantee a 100% error-free website. That’s why session replays are so useful: they recreate real user browsing sessions across multiple pages. You’ll see first-hand every time a user gets stuck, bounces away, or encounters a bug.
Use a session recording tool like Contentsquare Session Replay to view real user behavior on your site early on in the roll-out to get ahead of any website bugs that may appear.
🎥 See it in action: the folks at Golf Digest Online, a provider of golf-related services, used Contentsquare Session Replay to understand why their new golf course reservation system wasn’t producing as many bookings as expected.
Session replays revealed that some users were seeing an error message that told them ‘The start time is sold out’—no matter which timeslot they tried to reserve
This confusing message made users go back to the previous page, a step that the page structure didn't allow. Understandably, users dropped off.
With Contentsquare, GDO saw this error in action. They also saw how many sessions returned this issue, judged the scale of the problem, and fixed it—which decreased drop-offs and boosted their conversion rate.
How to continually monitor your website for bugs
Even if you’re not launching something new, your website is a living document, and new problems can pop up anytime and where you least expect them.
While you can’t control external forces, you can continually monitor your website for bugs to uncover issues and prioritize fixes when you spot something that’s not quite right.
Check for technical errors
‘Invisible’ issues like slow-loading or non-indexable pages are difficult to spot, even if you spend all day looking at your website.
There are plenty of tools you can use to monitor your site for technical errors that might be holding you back. Give these a try:
Contentsquare’s Error Analysis alerts you to both technical and non-technical errors on your site, and ranks them by impact
Contentsquare’s Speed Analysis calculates your website performance, and offers advice to increase its speed
Google Search Console identifies issues with site speed and search engine crawling
Ahrefs’ site audit tool finds on-page SEO issues like broken links
If you’re using Contentsquare, Error Analysis puts bug monitoring on autopilot. It gives you real-time alerts to any error spikes via a convenient platform like Slack or Microsoft Teams.
While other monitoring tools describe errors only in technical language, Error Analysis connects to Contentsquare’s other tools. That means if an error appears, you can click through to watch a session replay and see what it looks like in action.
The tool also quantifies how many users are experiencing the same error and how much it’s costing you—so you can prioritize fixing mission-critical flows and not sweat the small stuff.

Contentsquare’s Error Analysis offers both technical details on your error and a replay of what it looks like
Investigate website drop-offs
Identifying where and why people leave your website reveals any UX issues that need to be fixed to improve conversions.
You can start this process with a traditional analytics tool like Contentsquare Dashboards or Google Analytics—look for pages with a high bounce or exit rate (exits divided by pageviews), or a low engagement rate.
You can also use a customer journey analysis tool like Contentsquare’s Journey Analysis to identify areas of drop-off for further investigation. Journey Analysis turns your customer journey information into a sunburst-shaped diagram that reveals at a glance which pages your users exit out of important flows.

Contentsquare’s Journey Analysis turns your journey data into an interactive visualization
Once you’ve identified any problem pages, investigate why they’re not performing by watching session replays of them.
With Journey Analysis, you have the possibility to really dive deep into all the steps and better understand the customer journey.
Review rage clicks
Rage clicks occur when users repeatedly click on a website element in a short period of time. They usually indicate something’s wrong, like broken links or buttons, false links (i.e., an unlinked asset a user thinks is clickable), or slow-loading elements.
Reviewing where users rage click helps you see your designs from their perspective and figure out what might need fixing or improving.
If you’re using Contentsquare, it’s easy to investigate your rage-click data. Use our dashboards to track your site’s rage clicks over time and stay abreast of any notable increases in frequency. To investigate further, filter your session replays by ‘most to least’ rage clicked, and watch sessions where rage clicks occur frequently to see what happened.
Contentsquare’s Session Replays lets you skip right to the moment a rage click happened
Collect real-time feedback
Giving visitors a way to leave real-time feedback on your website makes it easier for them to report issues without submitting a support ticket or sending an email.
To do this, set up a feedback widget on your key pages—an unobtrusive, clickable element that offers visitors the chance to leave a line of feedback if they feel motivated to do so.
Unlike a more prominent on-page survey, it won’t interrupt the browsing experience of contented users—people will likely only notice it if they’re looking for a way to tell you something, such as ‘This link is broken’!
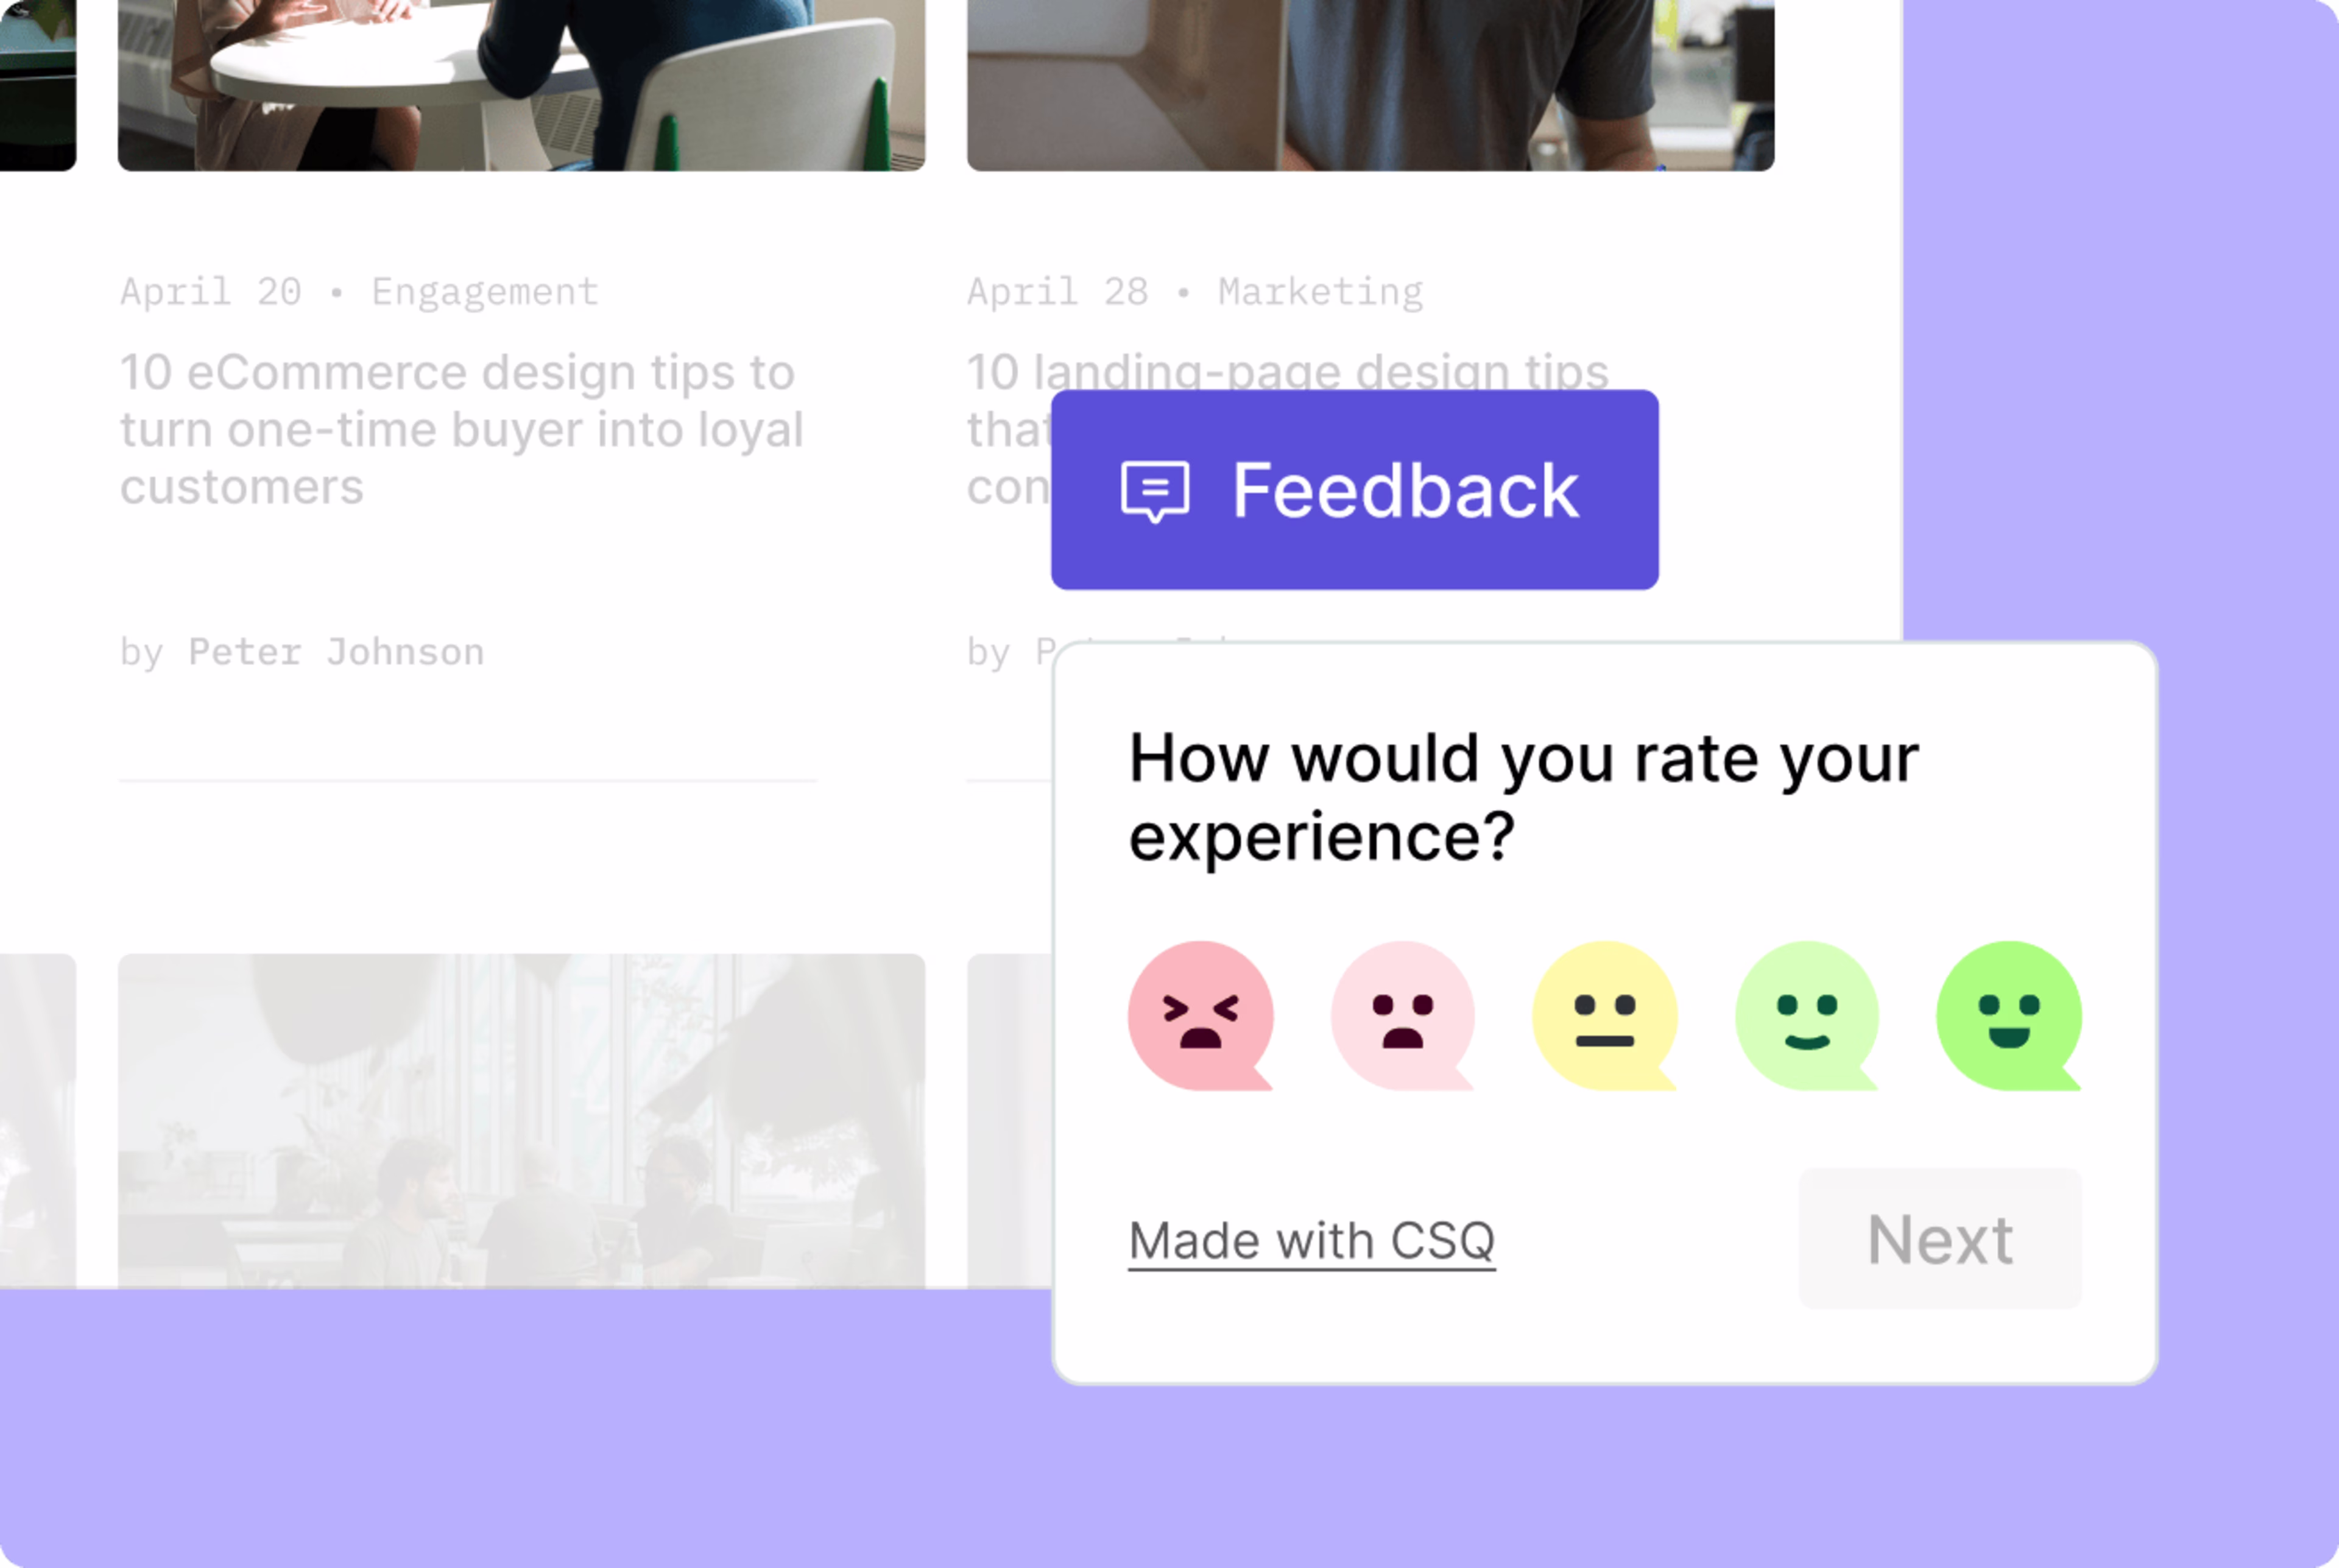
A feedback widget set up with Contentsquare’s Surveys
Set up alerts
Remembering to log into individual tools to check for errors can be a hassle. Setting up alerts will ensure you always know when something’s broken and can quickly react.
If you’re using Contentsquare, you can easily set up alerts for when new bugs are detected, both those identified by the Error Analysis tool and those identified by drops to important KPIs like exit rate and bounce rate. Get your notifications via email, Slack, or Microsoft Teams—whichever makes the most sense for you.
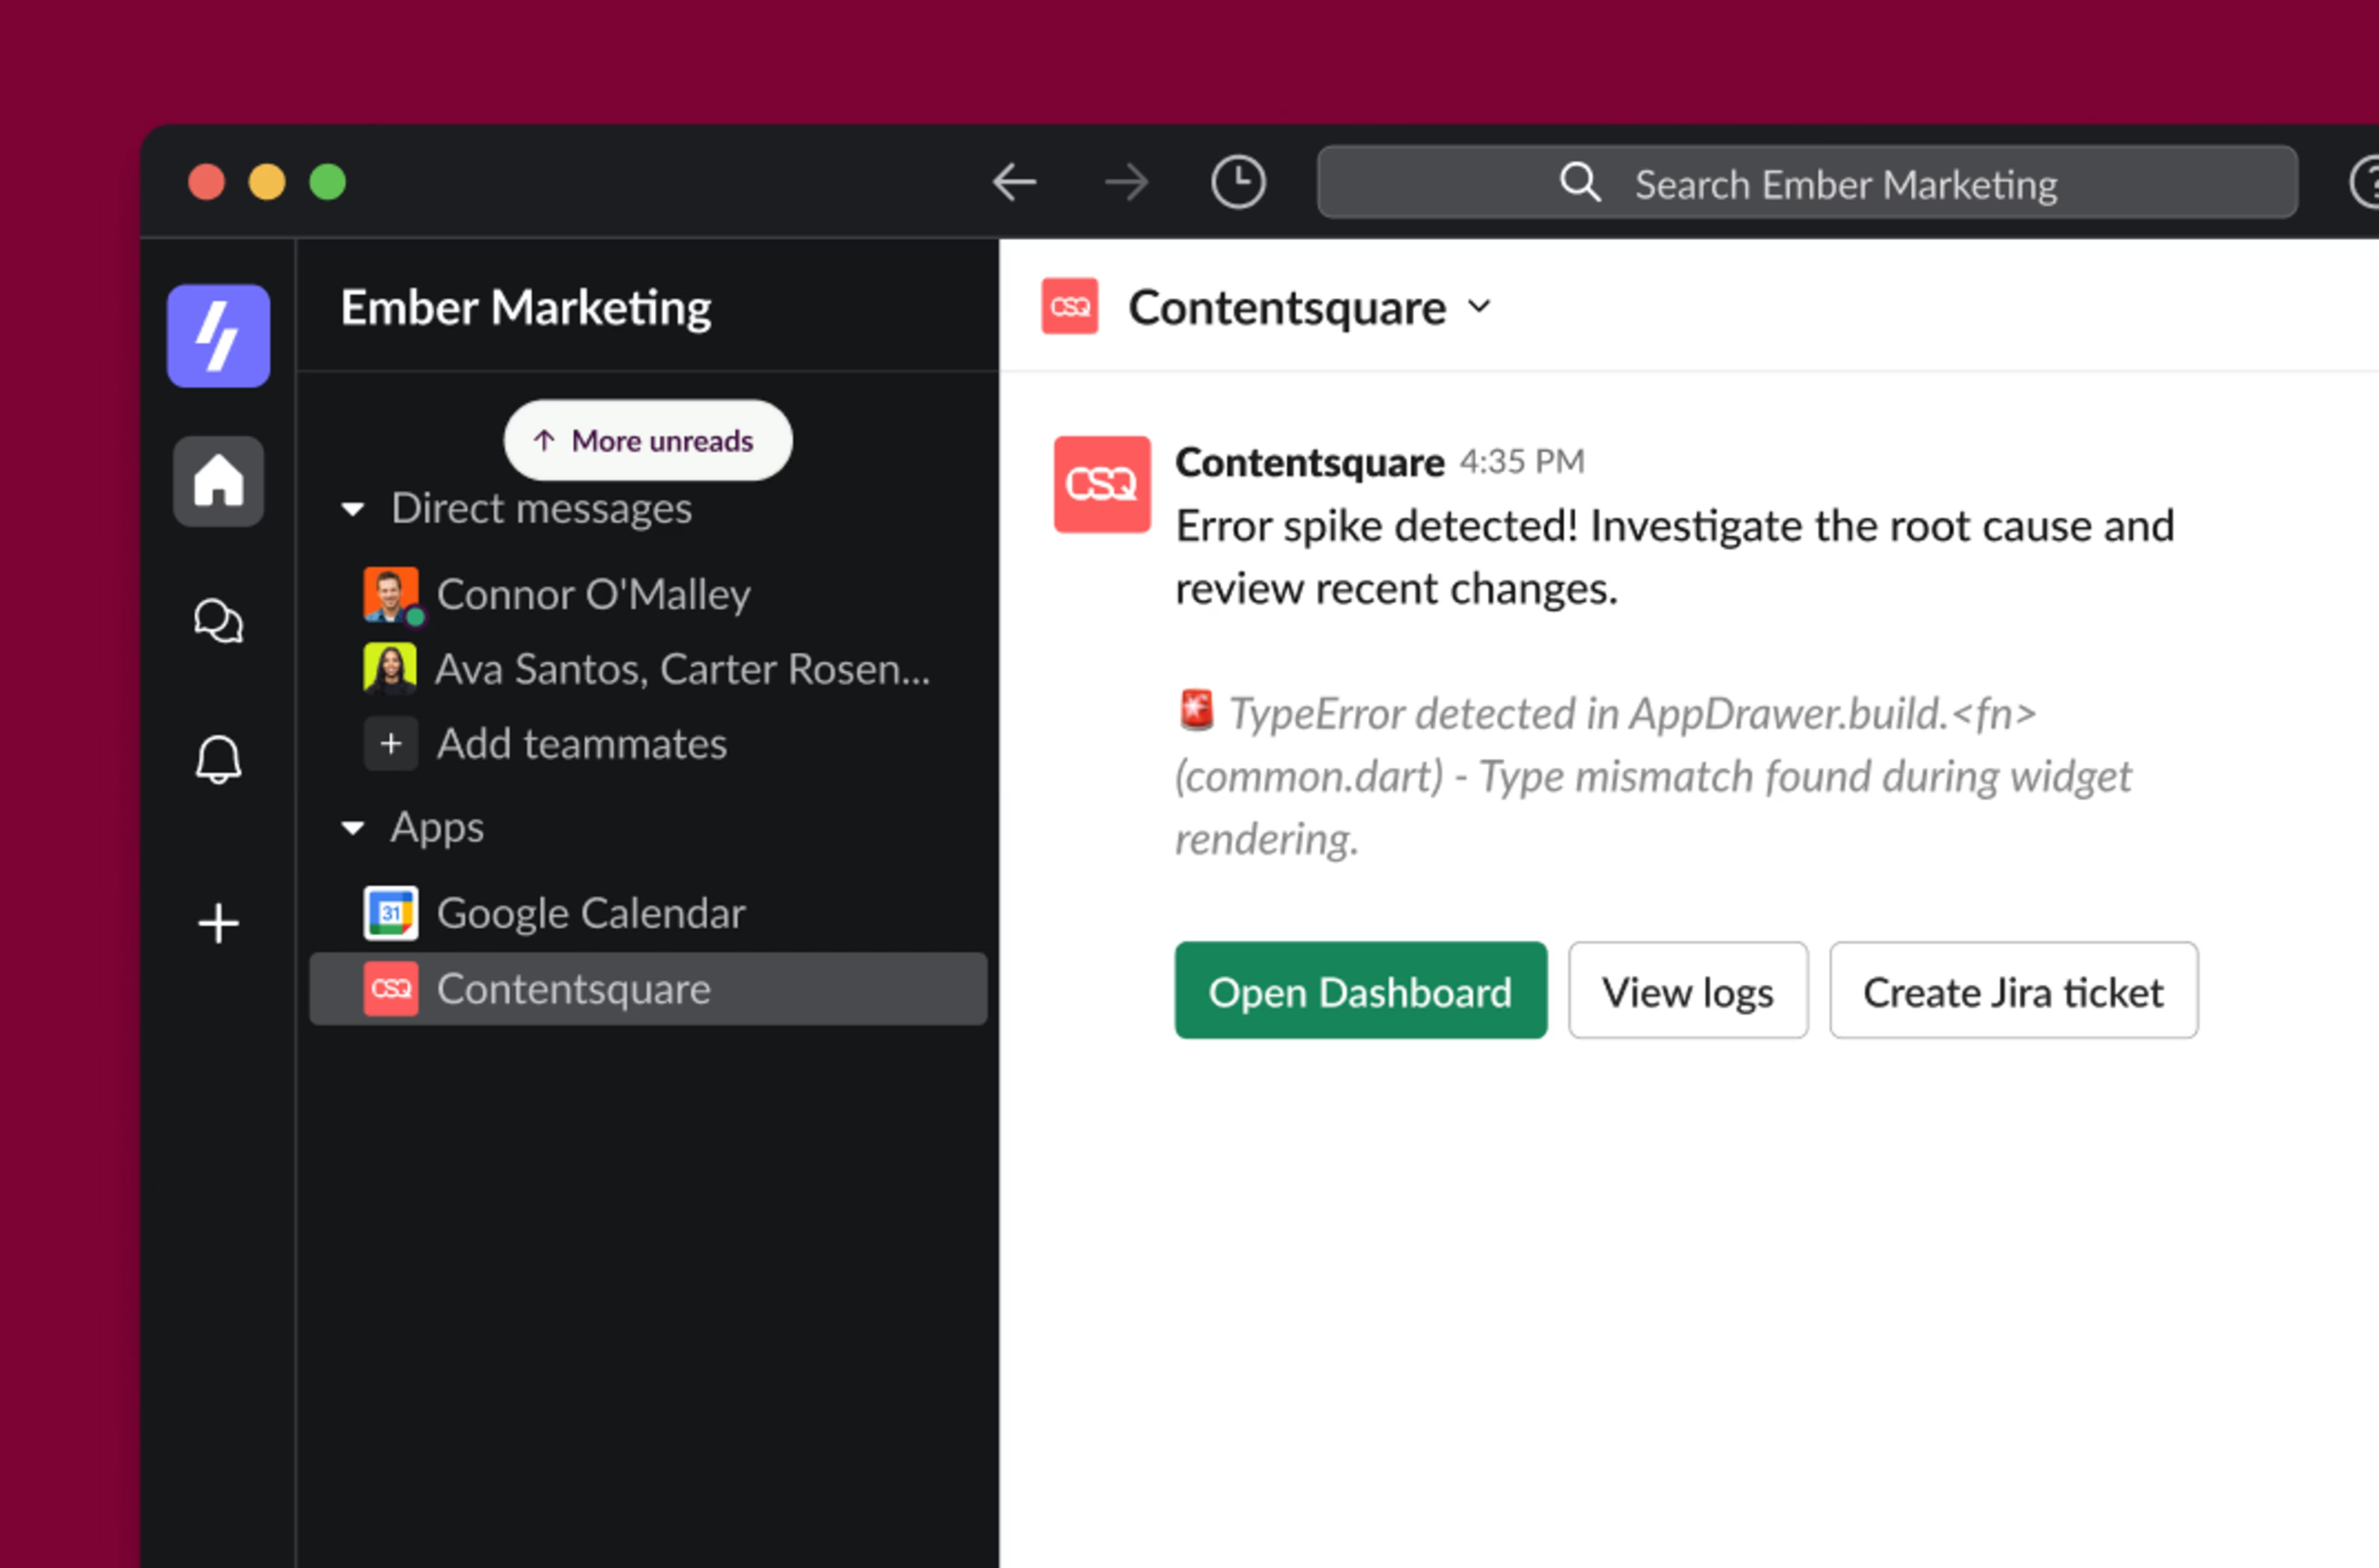
Usually hanging out in Slack? Get your Contentsquare error alerts sent there
How to solve website issues
Unless you’re a team of one, you’ll likely need to loop in another department to fix some of the issues you found using the above techniques. The remaining tips and tools will help you organize, communicate, and get buy-in for fixes quickly.
Quantify the problem
Devs love data. When you ask them to fix a bug, provide evidence that it’s affecting a large number of users or having a substantial impact on your business’s bottom line. If you can offer this information, repairing your error will move straight to the top of their Jira board.
There’s an easy way to do this if you’re using Contentsquare’s Error Analysis: use Impact Qualification to get hard numbers for how much a particular error is likely to affect your important metrics.
Share session replays of critical issues
Instead of trying to explain technical or UX issues to your devs, use session replays to show them the real thing.
In Contentsquare Session Replays, you can add comments to relevant moments in session replays and even tag your teammates. This allows you to point out the exact moment a customer experiences friction.
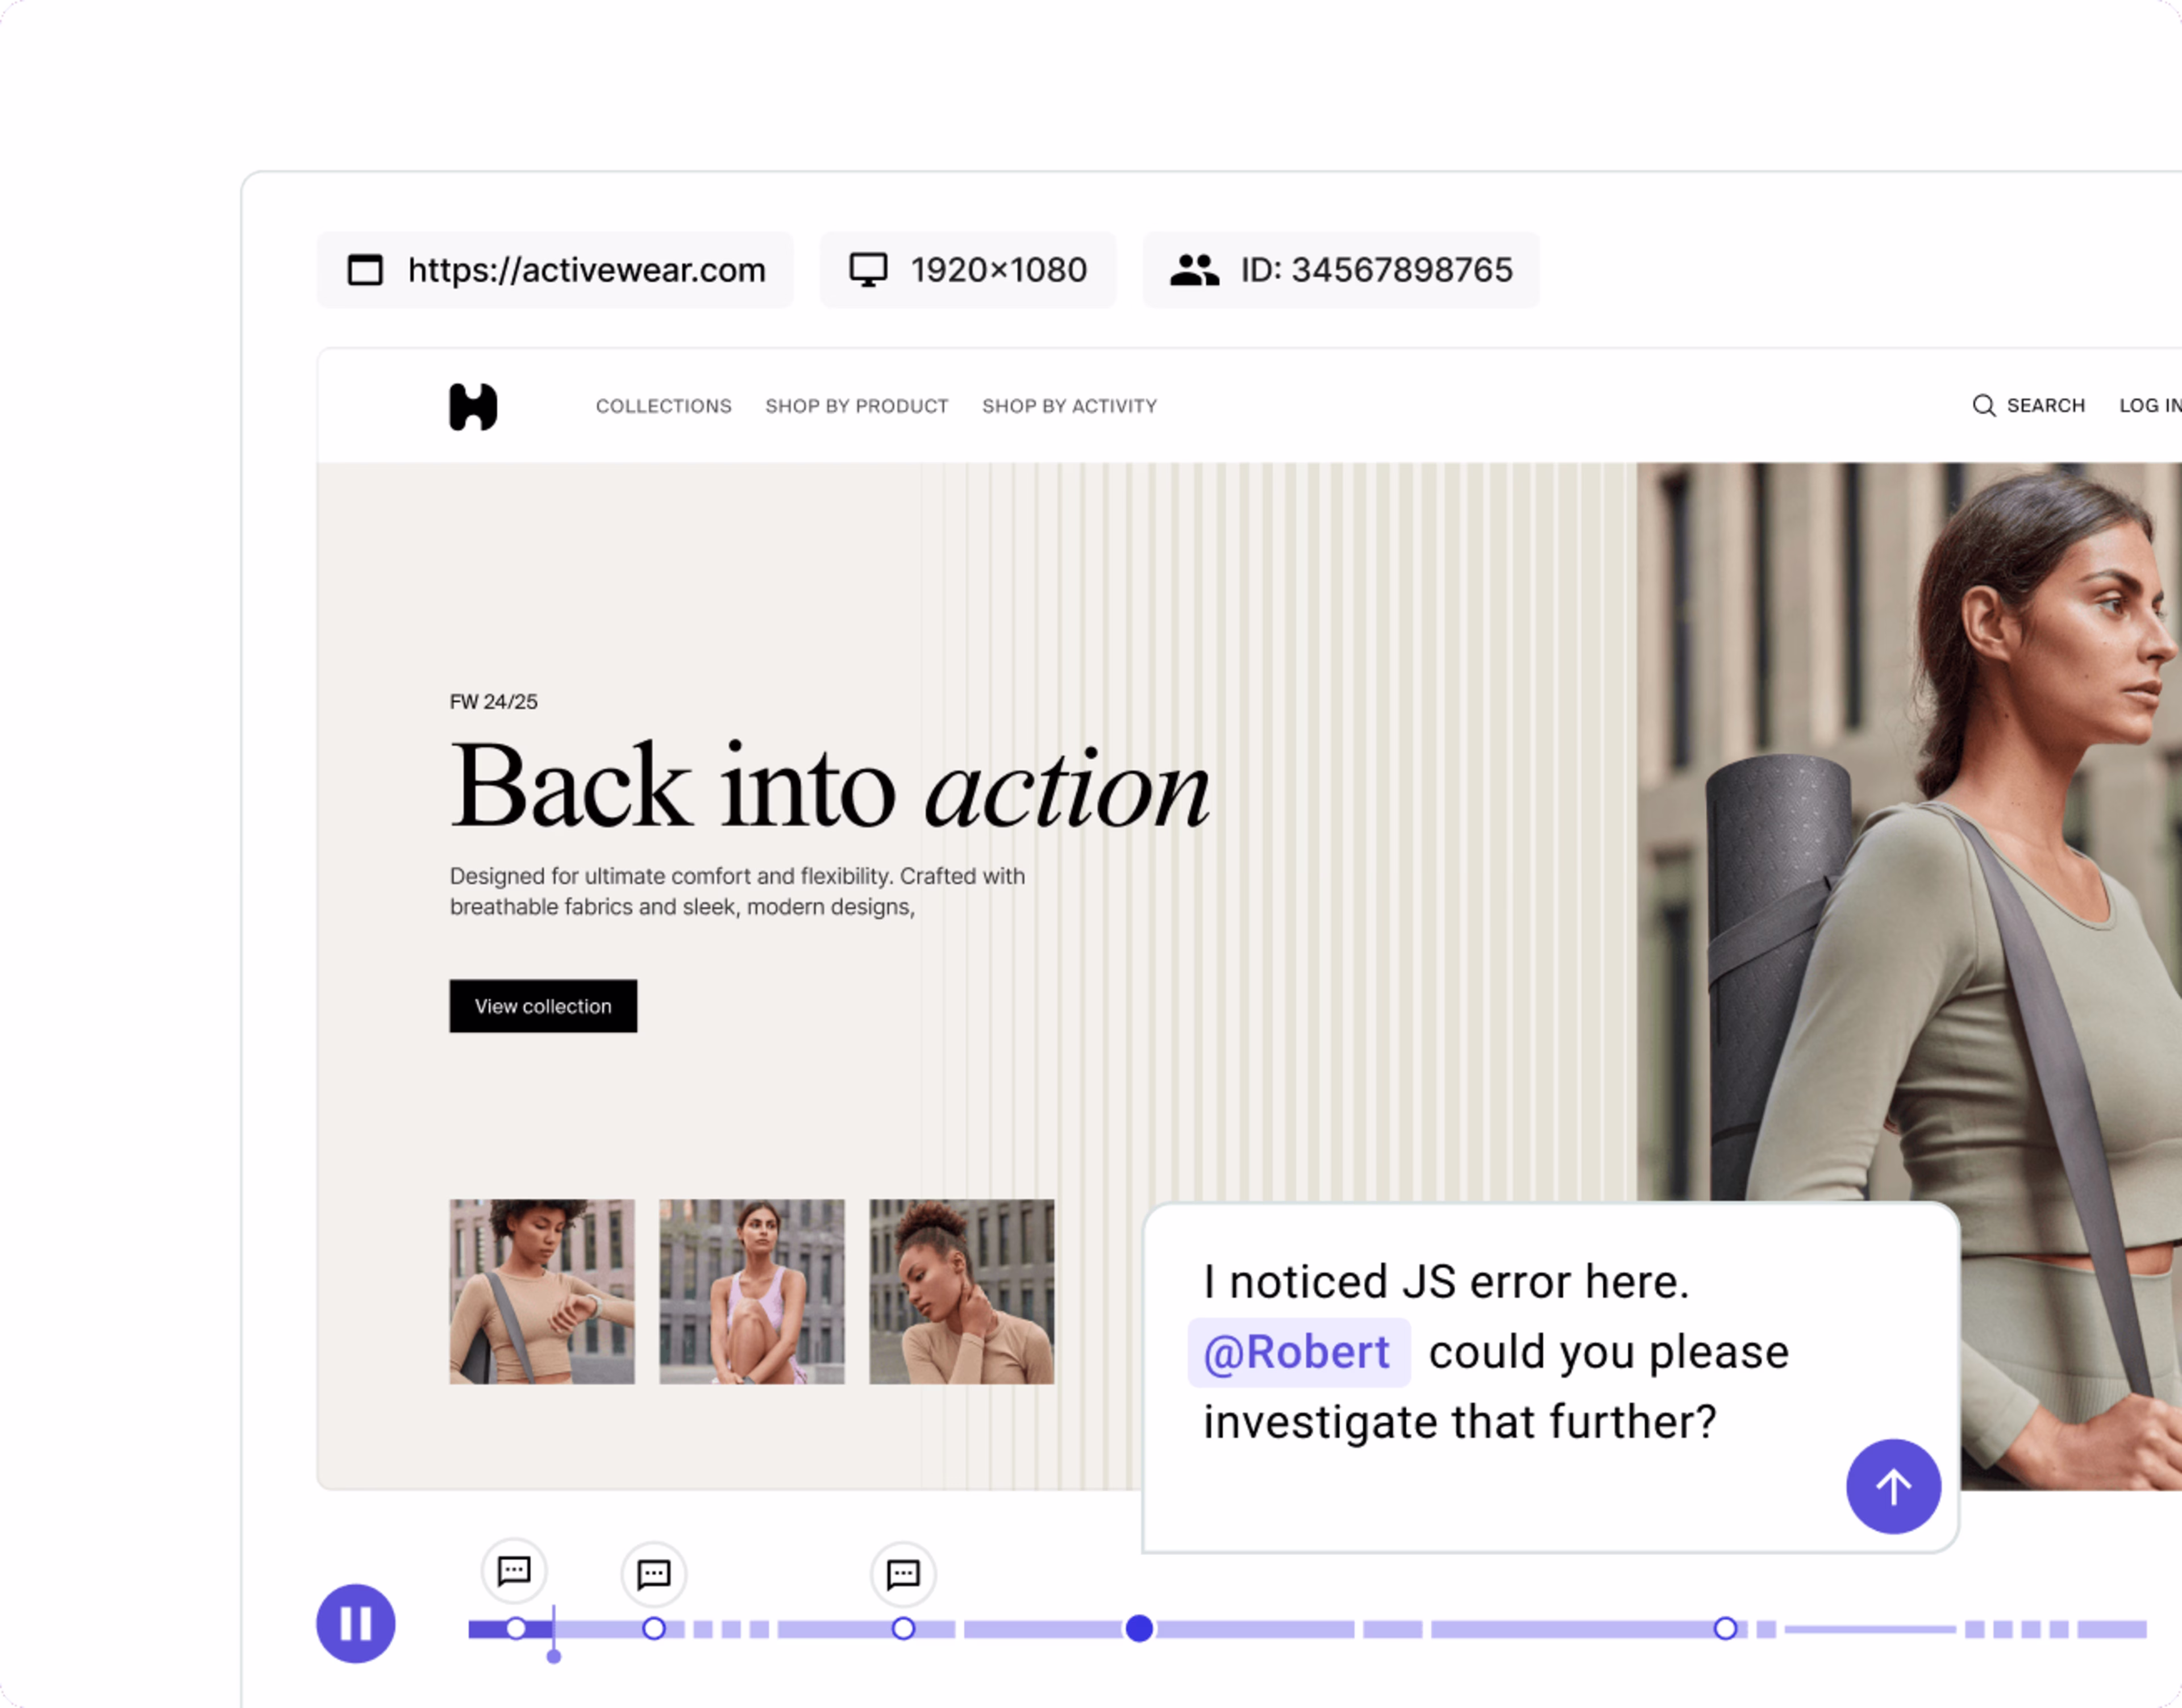
Dropping a comment for a colleague in Contentsquare’s Session Replay tool
Every chance I get, I remind people, “We have an issue? Go look at the data in Contentsquare! We can check the errors, quantify them, and prioritize based on that.” We can go and find the specific session in session replay, watch it, reproduce it, and see exactly what the customer experienced step by step. There's just so much value.
Share errors directly to Jira
Rather than dragging your teammates to another tool, report errors somewhere they already check regularly and use to manage tasks. For a lot of engineering teams, this means Jira.
Contentsquare’s Error Analysis tool integrates directly with Jira. Click through on an error’s detail page to automatically create a ticket—it will be prepopulated with useful information about the error, so your colleagues have all the facts they need to prioritize and tackle the fix.
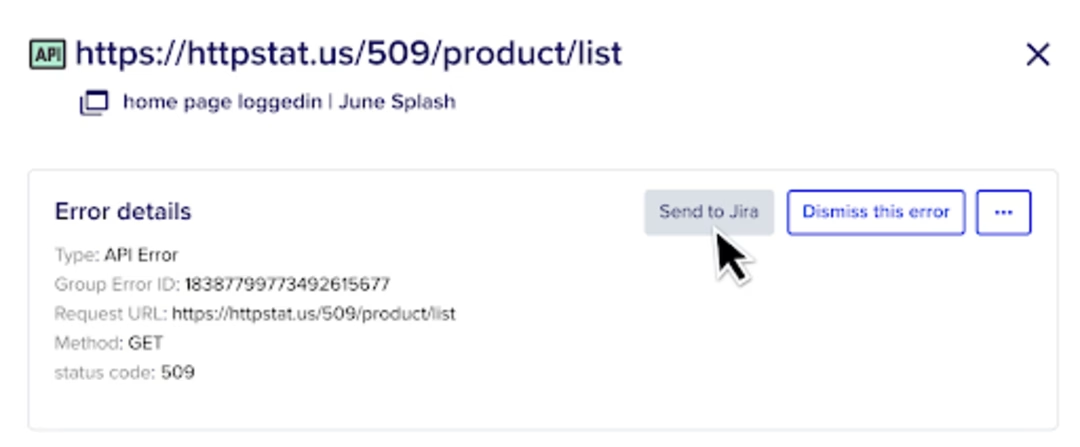
Contentsquare connects directly to Jira, making things easy for your developers.
Fewer errors, happier customers
Whatever your marketing goals are, your efforts will be helped by reducing the number of bugs, errors, and downright confusing elements across your website. One of the simplest no-code ways to do this is to bake experience intelligence tools into your marketing workflow. This way, you can get into the habit of testing designs before launch, monitoring for bugs year-round, and looping in your team to prioritize the fixes you know will make a difference.
And you can achieve all that with the different tools in Contentsquare—start for free and scale as you grow.
FAQs about website issue detection
Website issues—like broken elements and misleading design—negatively affect marketing campaigns because they cause poor user experiences (UX). This can impact the performance of any type of marketing, from ad campaigns to search engine optimization (SEO), as potential customers bounce when they encounter website problems instead of converting.
![[Visual] Contentsquare's Content Team](http://images.ctfassets.net/gwbpo1m641r7/3IVEUbRzFIoC9mf5EJ2qHY/f25ccd2131dfd63f5c63b5b92cc4ba20/Copy_of_Copy_of_BLOG-icp-8117438.jpeg?w=1920&q=100&fit=fill&fm=avif)
![[visual][Ecommerce analytics] Tools](http://images.ctfassets.net/gwbpo1m641r7/1QIREJa6WCXWftNzRbYGYb/da9e0c9501f2a7abdae07b76209f4d8c/pexels-diva-plavalaguna-6147360.jpg?w=1920&q=100&fit=fill&fm=avif)
![[Visual] Man at computer - stock](http://images.ctfassets.net/gwbpo1m641r7/7GloM7xPXUs1M75nfaIWtr/6566092d4d853e43c29d9df2bf791fd1/AdobeStock_540624504__1_.png?w=1920&q=100&fit=fill&fm=avif)