![[Blog] Predictive personalization - Cover image](http://images.ctfassets.net/gwbpo1m641r7/1S6WOJQHfsH63EavOcgIvK/a14ebe2f20db91dd87f43c55c0128035/RhDvJL1ugMB7oBqtkFjX.webp?w=3840&q=100&fit=fill&fm=avif)
In the days of Universal Analytics—which bit the dust in the summer of 2023—marketers and product teams monitored average session duration to gauge user interaction with and interest in their brand, products, or services. If you used GA back then, you might be wondering: where is GA4 hiding this critical metric in their interface, and why isn’t it more obvious?
Well, as of 2025, GA4 is prioritizing the related metric of average engagement time per session instead of average session duration, on the grounds that it’s a more accurate reflection of user interaction.
If you’re using GA4, it’s easier to create reports on the new metric of average engagement time per session. However, it’s still possible to track and monitor your average session duration, if you prefer. This article tells you how.
What is average session duration in Google Analytics 4
Average session duration in Google Analytics 4 (GA4) is a user engagement metric that tells you the average length of engaged sessions on your website or app.
GA4 starts calculating a session (whether engaged or unengaged) when a visitor opens your app in the foreground or views a page or screen—and no previous session is currently active. If a user stays active for a certain length of time (the default is >10 seconds), completes a key event, or has 2 or more page or screen views, it’s considered an engaged session. There’s no limit to how long a single session can last. But a session automatically expires after 30 minutes of inactivity.
Average session duration vs. average engagement time per session
As mentioned above, GA4 emphasizes average engagement time per session rather than average session duration. The difference between these metrics is subtle: both are a record of the average amount of time a user remains active on your page, site, or product during a visit.
However, the main difference is that average engagement time per session takes into account the fact that your users might keep your website open in one tab, whilst they’re actually interacting with a different site in another tab or window.
Average engagement time per session is calculated as follows:
Average engagement time per session = total length of time your website was in focus or your app was in the foreground across all sessions / total number of active users
How does Google Analytics 4 calculate average session duration?
The GA4 average session duration refers to the length of all engaged sessions on your site or app, divided by the number of all sessions in a given period. Here’s how to write the formula:
Avg session duration = total engaged sessions within a certain time period / total sessions in the same time period
Again, a session is ‘engaged’ if it goes beyond a single pageview or screenview, features an event, or lasts longer than your preferred limit (you can set it between 10 and 60 seconds).
How to find average session duration in Google Analytics 4
To find and track your average session duration, you’ll need to use the ‘Explore’ tab of GA4: their functionality for creating advanced and customized reports.
Step 1: first, you need Admin or Editor permission for the Google account or property on which you're generating a report. You can also ask the teammate who has the appropriate permission to take it from here.
Step 2: head to the ‘Explore’ tab in the left-hand menu of your GA4 account, and click on ‘Template gallery.’ From here, scroll down until you see a section titled ‘Use cases’. Click on ‘Acquisition’ to bring up the template for analyzing your site’s user acquisition metrics.
![[Visual] GA4 Template](http://images.ctfassets.net/gwbpo1m641r7/3r4HQuLD6nMdkGF5Yx4fyx/d69ad82ae374a65fc668097f3029f9eb/Template_.png?w=3840&q=100&fit=fill&fm=avif)
Templates make it easier to get started with GA4’s advanced reports functionality.
Step 3: configure the time period you’d like to report on
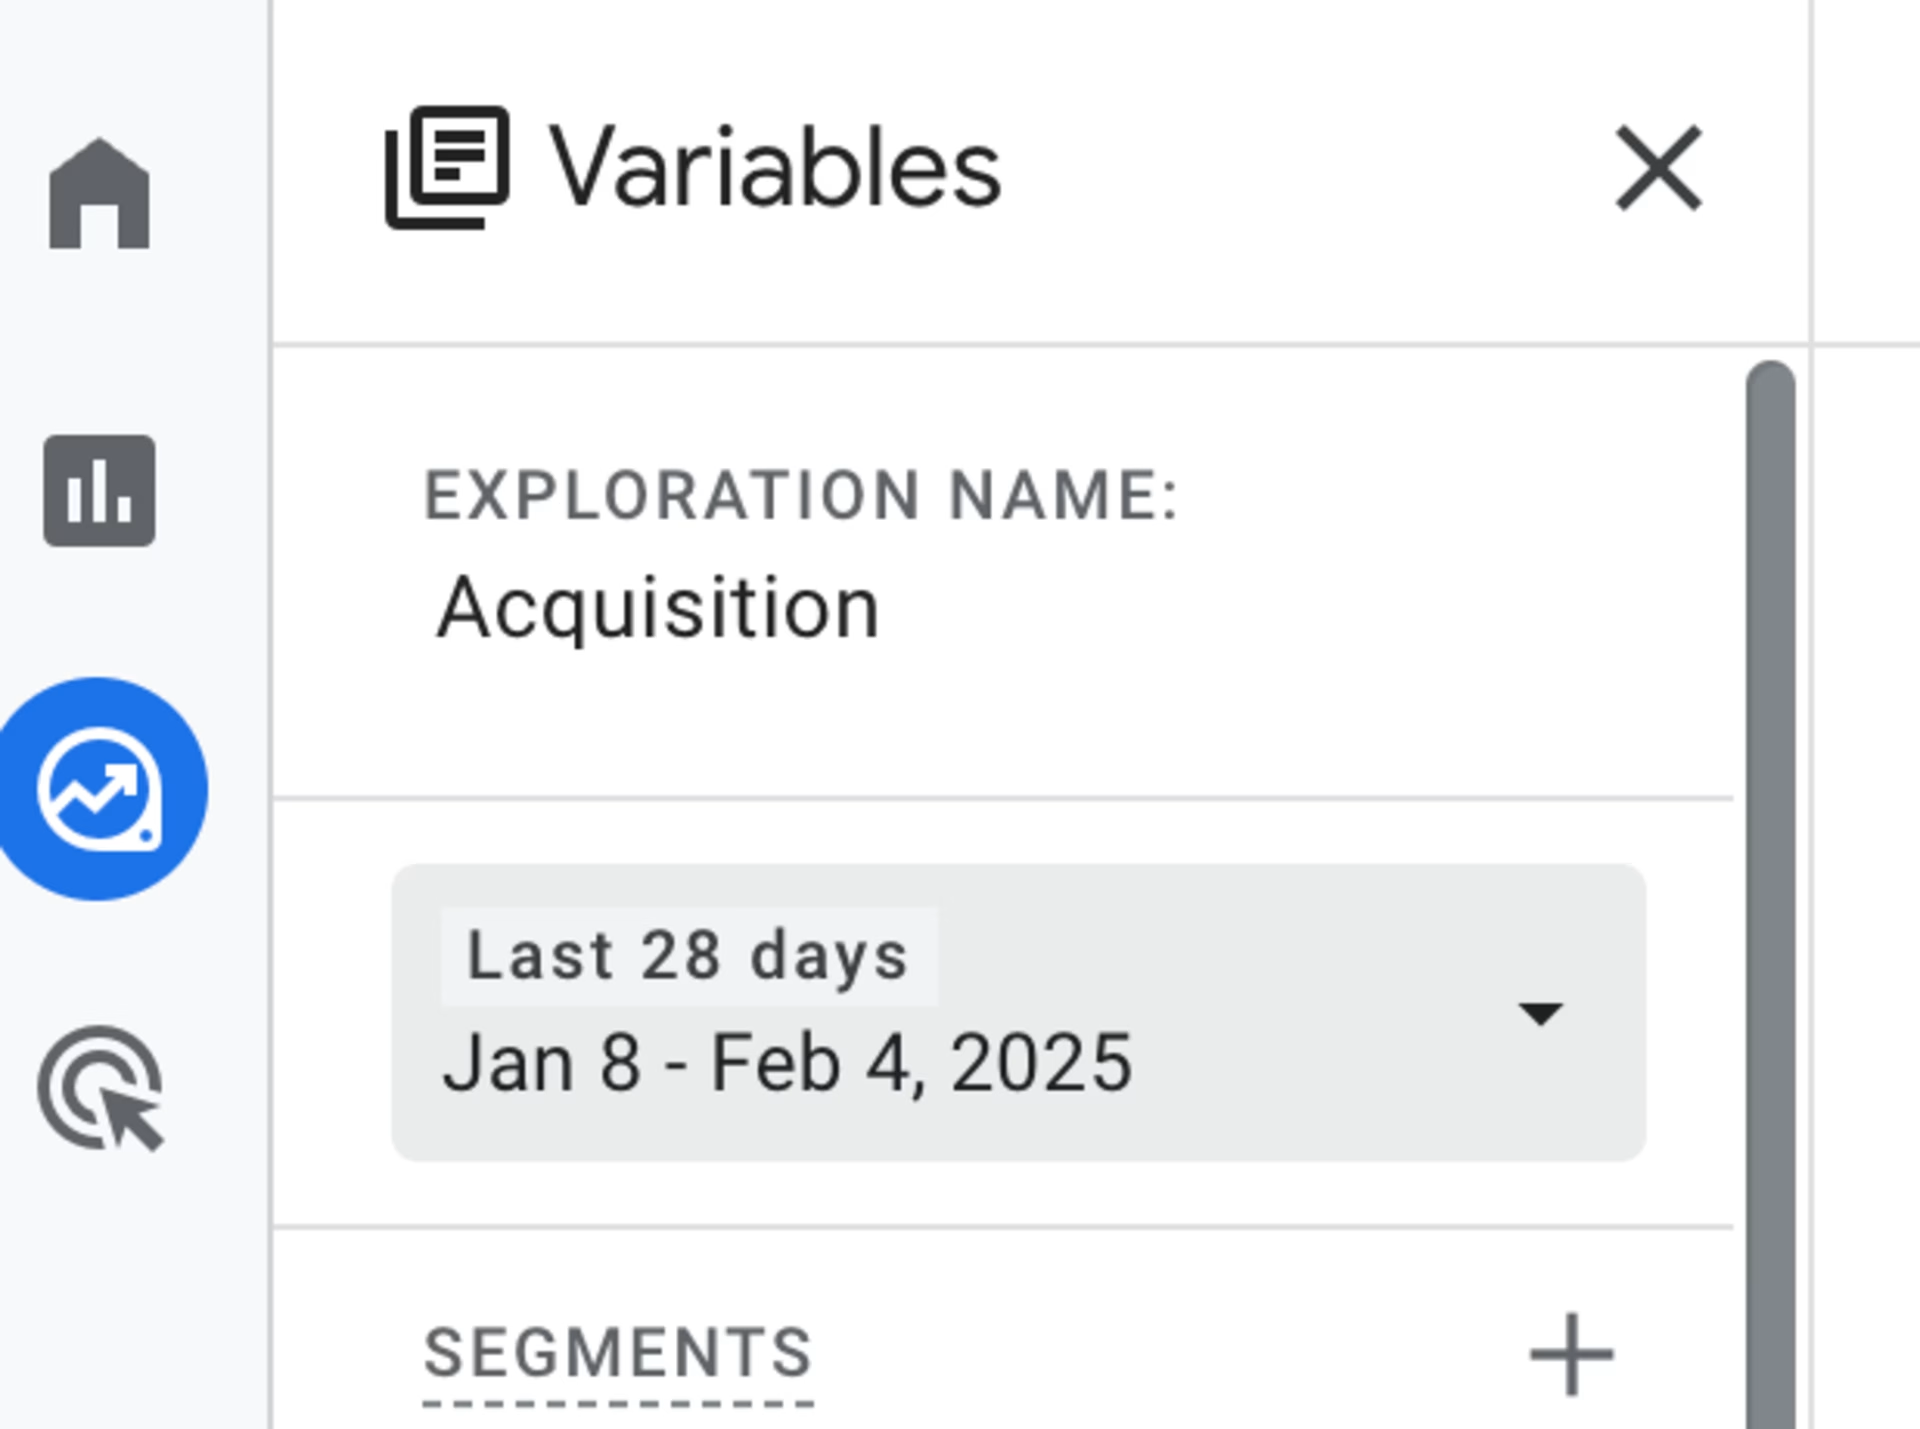
The default reporting period is the last 28 days
Step 4: there’s a sidebar called ‘Variables’ on the far left of your screen. Scroll down until you get to a field called ‘Metrics.’ Then, hit the plus sign in the top right corner to add custom metrics. Search the available options for ‘Average session duration’. Check this box, then click ‘Confirm.’
![[Visual] GA4 Custom metric](http://images.ctfassets.net/gwbpo1m641r7/7E7wJKU4OURosiNwl1BTnz/3e8d60cba1236300fc3d4034ac4e1e95/Custom_metric.png?w=3840&q=100&fit=fill&fm=avif)
You can also just scroll to ‘Average session duration’ in the list
Step 5: find the sidebar in the middle of the interface called ‘Settings’. Scroll down until you see a heading called ‘Values’. Under that, you’ll see a field called ‘Drop or select metric’—click on it, and then click on ‘Average session duration’.
![[Visual] GA4 Settings](http://images.ctfassets.net/gwbpo1m641r7/4dH8xI6F4w989xzTkOnogy/611a7ab5e1428af4fb30913476f6b803/GA4_Settings.png?w=750&q=100&fit=fill&fm=avif)
Average session duration will appear alongside any other metrics you’ve chosen to include
Step 6: congratulations! You’ve created a chart that shows the average session duration of visitors to your site, organized by their acquisition channels.
![[Visual] session duration chart](http://images.ctfassets.net/gwbpo1m641r7/7bKcMGysu3XulZOo0BnqHD/a2353565f3b00d283a35f7e8c5d01124/-Visual-_session_duration_chart.png?w=1080&q=100&fit=fill&fm=avif)
Now that you know how to change the fields on the chart, why not customize it even further to fit your use case?
Pro tip: GA4’s Explore tab allows for good customizability, but the learning curve is fairly steep. If you’d like to get a read on your average session duration quickly, use the Insights tool.
Simply open your GA4 account on any page and type ‘average session duration’ into the search bar at the top. You’ll see a figure for your average session duration for the last week.
![[Visual] GA4 insights](http://images.ctfassets.net/gwbpo1m641r7/2wxriVk8sbkZsz0YYYNTn9/1d3611821c0c2f57b9a7ab9f2de3c3f1/insights_.png?w=3840&q=100&fit=fill&fm=avif)
GA4’s Insights tool uses AI to answer quick questions about your key metrics
What the average session duration in Google Analytics 4 tells you (and what it doesn’t)
Observing how much time visitors spend on your site or app on average offers some vital business insights.
For example, both average session duration and average engagement time per session tell you how long a user might take to get through a sales funnel. A sales funnel includes interactions across multiple pages, such as: homepage > category page > product page > shopping cart > checkout.
If it takes users an unrealistically short or unusually long amount of time to get through the funnel, the data's erratic trend might prompt you to investigate potential problems. However, you can't know what's wrong without looking past the numbers (more on this later).
Let's examine 3 things to be wary of when checking average session duration in GA4 and some bonus tips on how to better understand the user experience.
1. Average session duration raises more questions than it answers
As much as this metric gives you quantitative data—which is good enough if you want to know what's happening on your site—it doesn't offer context to help you learn why users behave a certain way.
Identifying the reasons users experience issues in the customer journey is more meaningful if you plan to fix them fast and avoid costly do-overs. Meanwhile, the lack of context only leads to more questions, such as
How did particular users get through the sales funnel so fast? Did they miss any important page elements or details?
Why did those users take so long to get through the sales funnel? Was there information missing? Did they encounter a website bug? Or were the next steps not clear?
Pro tip: Use Contentsquare’s Session Replay capability to see how users experience your app or website.
Watch session replays—video-style recordings of user sessions on your site—to get into your users’ headspace. Understand how they engage with your app or site from page to page, up to the point of exit. This helps you think beyond session duration and consider drivers of user behavior.
Worried there’s a UX issue slowing users down? You can filter session replays by frustration score or instances of rage clicks—that is, repeated clicking to the same spot. This allows you to see any pain points and blockers through your user's eyes, and optimize your site accordingly.
![[Visual] Session replay product shot](http://images.ctfassets.net/gwbpo1m641r7/3LL13WAqE6m1HwK774jx8Q/65fc93ad17017be0f90f682687f52760/Triggered_recording__3_.avif?w=3840&q=100&fit=fill&fm=avif)
A session replay of a real, anonymized user interacting with a page
2. It’s hard to connect average session duration to conversions or revenue
At a very surface level, increased average session duration usually correlates to more users taking important actions on your site—i.e., converting.
However, the truth may be more complex. As mentioned, increased average session duration might indicate that users are experiencing a confusing error, or not finding the information they’re looking for. How do you know if your conversions are increasing because of your increased average session duration, or in spite of it?
Pro tip: use Contentsquare’s Zone-based Heatmaps to connect average session duration to revenue. This tool divides your key pages into ‘zones’—key elements, such as CTAs and clickable images—and calculates how your key user behavior metrics map onto them. You can filter them to show, for example, how much each CTA contributed to your conversion metrics.
If you’re on a Pro or Enterprise plan, you can view this in real time with Contentsquare's Chrome extension, CS Live.

This zone-based heatmap reveals the conversion rate per click of various page elements
3. Average session duration can’t tell you why people don’t hang around
Let’s say your average session duration decreases. That’s useful to be aware of, but in isolation, that information doesn’t help you. It could be that your marketing is targeting people who aren’t interested in your product—or that your UX is so smooth that users complete their goals in 15 seconds flat.
You’ll need a lot more information to understand what’s going on, how it affects your key metrics, and how you can, if you want to, reverse the trend.
Pro tip: launch a user-friendly survey on high-exit pages.
The last page of a session is called the exit page. You can track high-exit pages by creating a custom report in GA4 in the ‘Explore’ tab.
Then, to dig deeper, launch an exit-intent survey on high-exit pages to directly ask users why they leave a page, so you can learn about what they're looking for and are hoping to see improved on your app or site.
Ask your visitors a combination of open- and closed-ended questions, like:
Will you be making a purchase today? [Yes/No]
What's stopping you from buying today?
How can we make this page better?
![[Visual] Churn survey CSQ](http://images.ctfassets.net/gwbpo1m641r7/16cklE1JBmOUwKxy5zTEqr/c91a8086524022499570708d450187d7/unnamed__40_.png?w=1080&q=100&fit=fill&fm=avif)
Sample questions to ask users right before they leave a page
Not sure what type of survey to launch and what to ask? Use Contentsquare to create a survey matching your goals with AI, using one of our pre-built templates.
Easily go beyond average session duration to optimize your site brilliantly
Complement the average session duration metric with experience intelligence tools to better understand how people experience your website or app. This opens you up to more valuable insights, which you can use to optimize website performance and delight your customers.
Ready to get started? The Contentsquare and Google Analytics integration facilitates a seamless switch between extensive app and web analytics and eye-opening digital experience insights. It's time to get the best of both worlds.
FAQs about average session duration in Google Analytics
Average session duration in GA4 refers to the average length of engaged sessions on your website or app. Here's how it's calculated:
Avg session duration = total engaged sessions / total sessions
Knowing how long visitors stay on your app or site on average can help you gauge people’s interest in your brand, products, or services.
![[Visual] Contentsquare's Content Team](http://images.ctfassets.net/gwbpo1m641r7/3IVEUbRzFIoC9mf5EJ2qHY/f25ccd2131dfd63f5c63b5b92cc4ba20/Copy_of_Copy_of_BLOG-icp-8117438.jpeg?w=1920&q=100&fit=fill&fm=avif)