![[Visual] Frustration Stock image](http://images.ctfassets.net/gwbpo1m641r7/11k60xS0jdvC5YUIGri69k/cb9c99860c58d5459fd2d9d00f5f167a/Defensiveness__one_of_the_greatest_inhibitors_to_true_collaboration.png?w=3840&q=100&fit=fill&fm=avif)
Analyzing your exits with GA4 provides valuable insights into where on your site users tend to leave. Here’s how to do that, why it’s important to keep tabs on this metric, and other tools you can use to understand your exit data in context.
What are Google Analytics 4 (GA) exits? What is an exit rate?
Exits record the number of times site visitors leave a particular page on your site. In turn, a page’s exit rate indicates how often visitors exit from it after visiting any number of pages on your site. As a percentage, exit rate is calculated as the number of exits/number of pageviews.
For example: a visitor lands on the homepage of an ecommerce site, navigates to a category page, then to a product page, and leaves. That’s considered an exit on the product page (the last page they visited). The overall exit rate for the product page is then calculated as the total number of exits/number of pageviews the product page received.
It’s easy to view your exits on GA4, and understand how they vary per page. However, unlike in previous versions of Google Analytics, there’s no functionality in GA4 for viewing your exit rate.
Where to find your exits in GA4
We’re going to create a custom report that’ll help you identify the pages people are landing on (entrances) and leaving from (exits) on your site. To do this:
Click on the ‘Explore’ tab on the left sidebar of your account—this is the place for creating custom reports
Find the templates, and click on ‘Free form’ to create this style of report
Find the sidebar that says ‘Variables’ and scroll down to the heading called ‘Metrics’. Click the grey plus sign in the top right of the box. A pop-up will appear with a menu of options for extra metrics to add to your report.
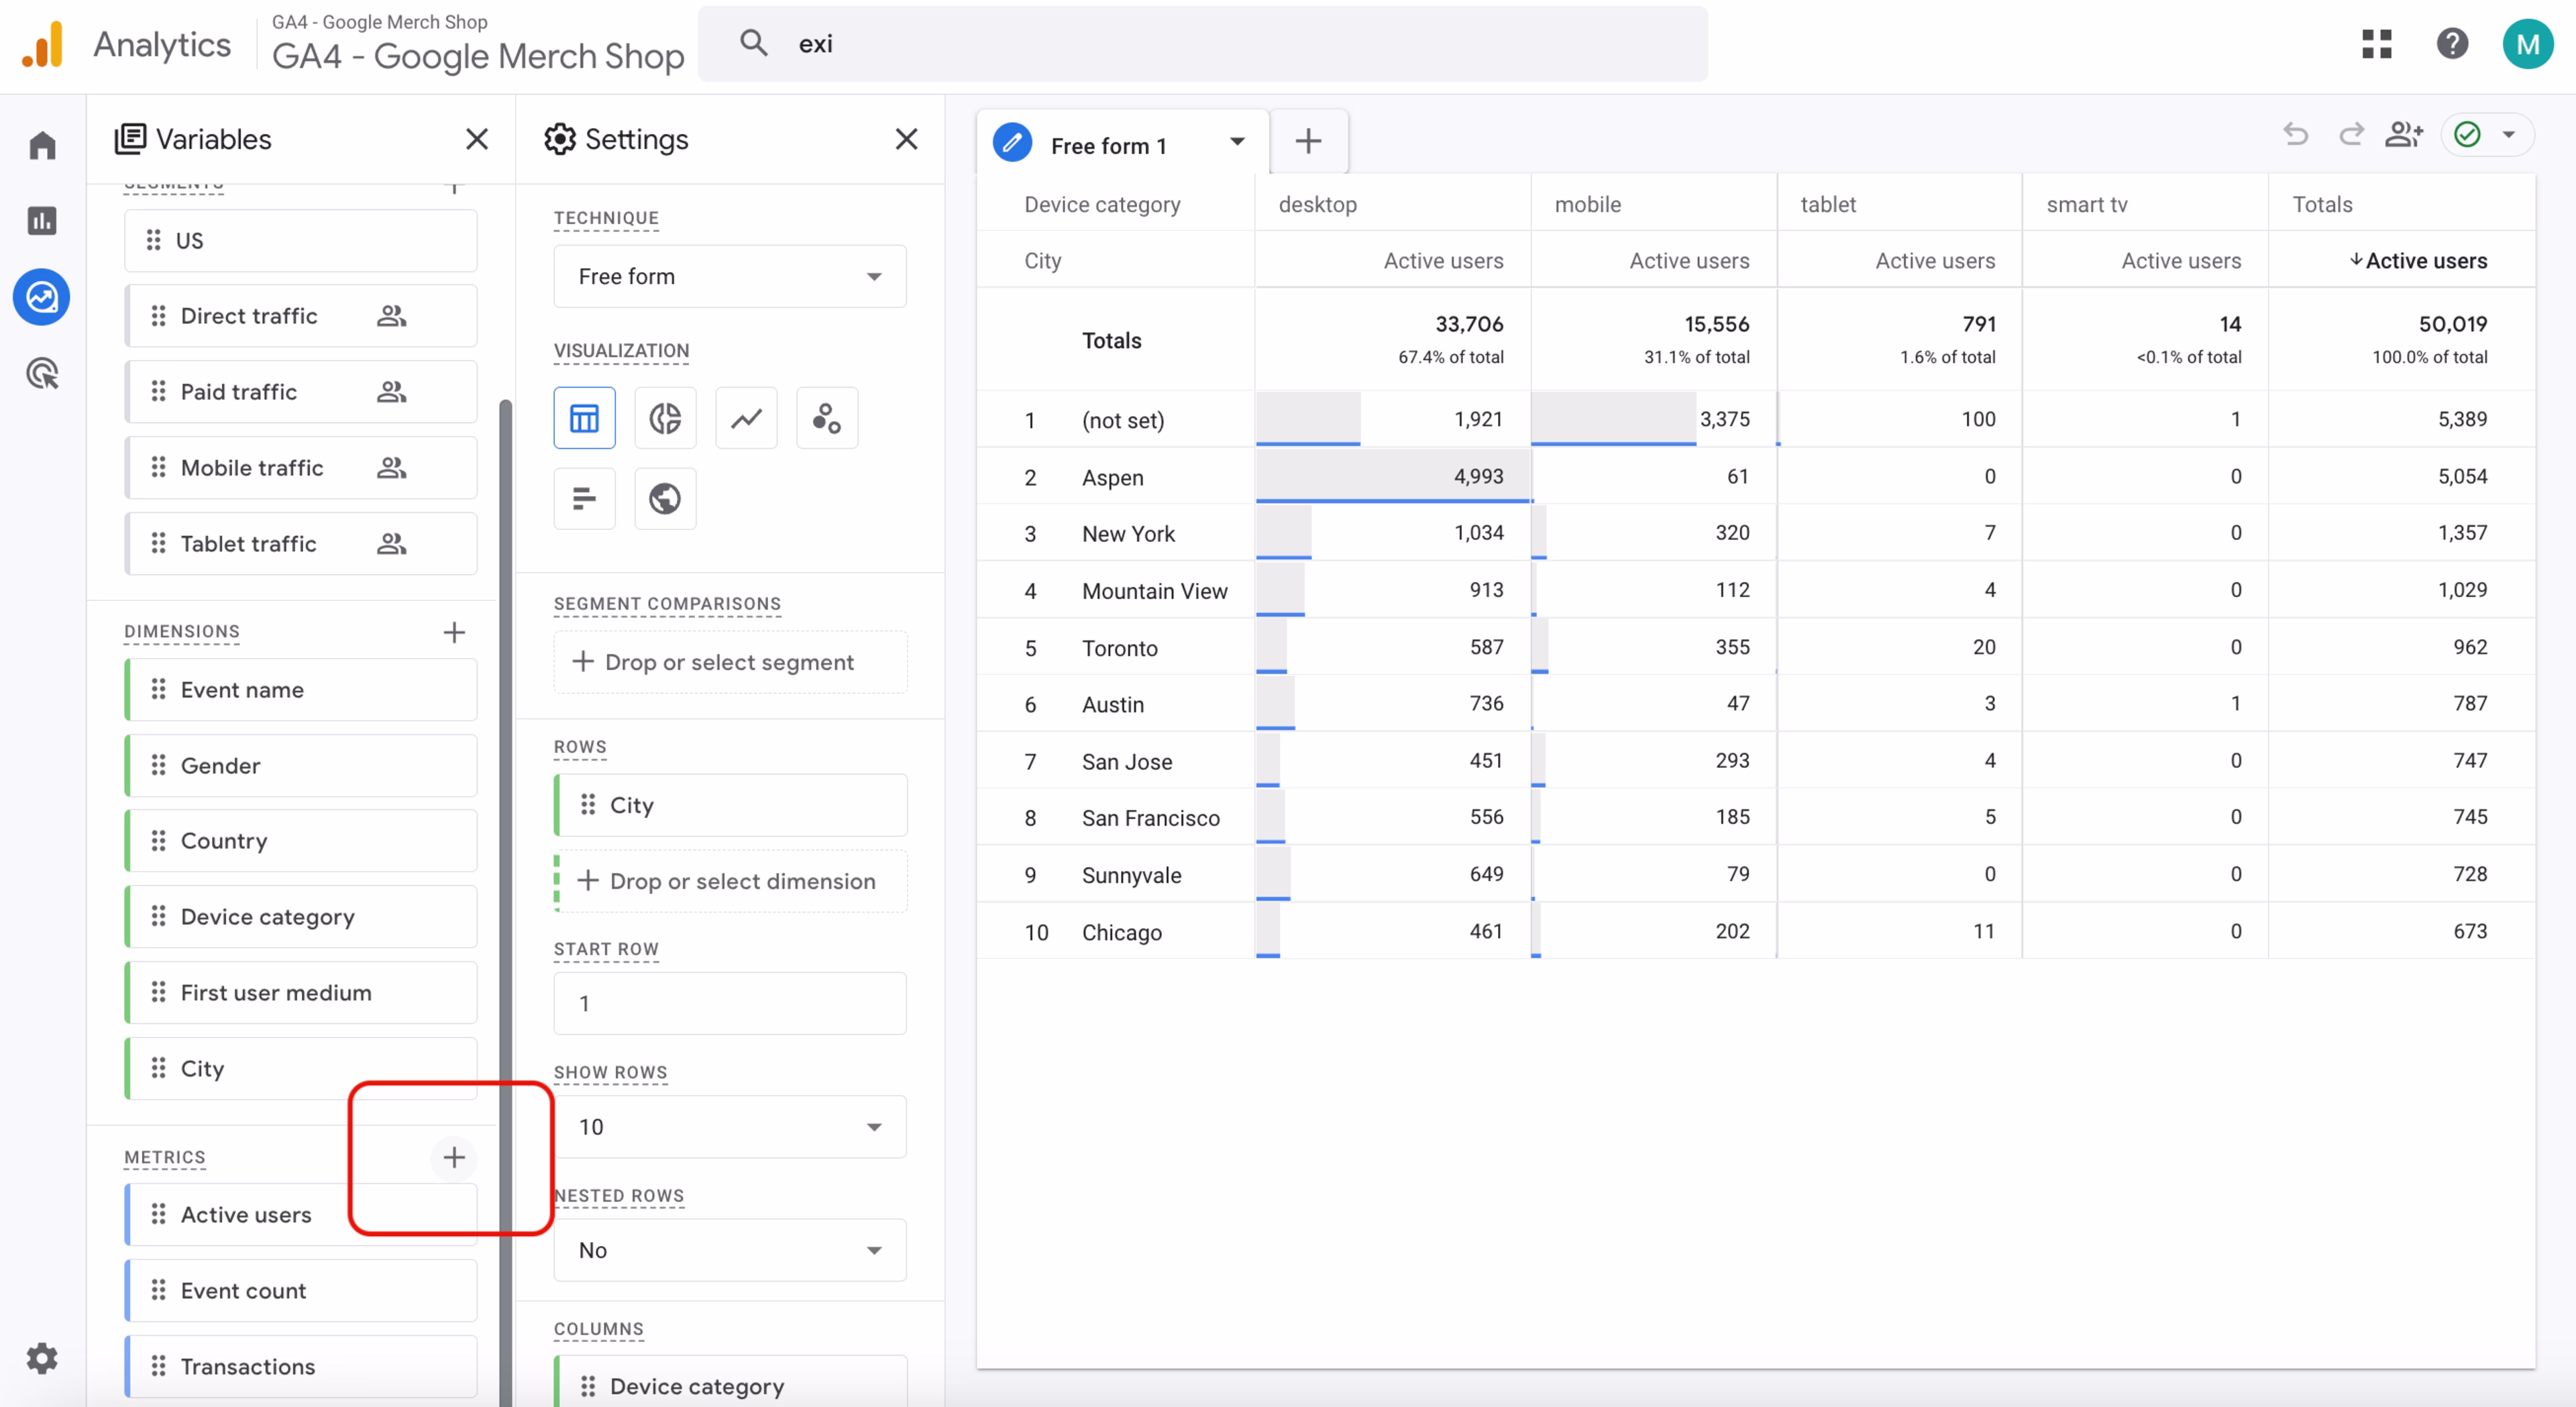
Click on the plus icon on the ‘Metrics’ heading to add ‘entrances’ and ‘exits’ to your custom report
Find ‘Exits’ from the menu, select it, and click confirm. Do the same for ‘Entrances’.
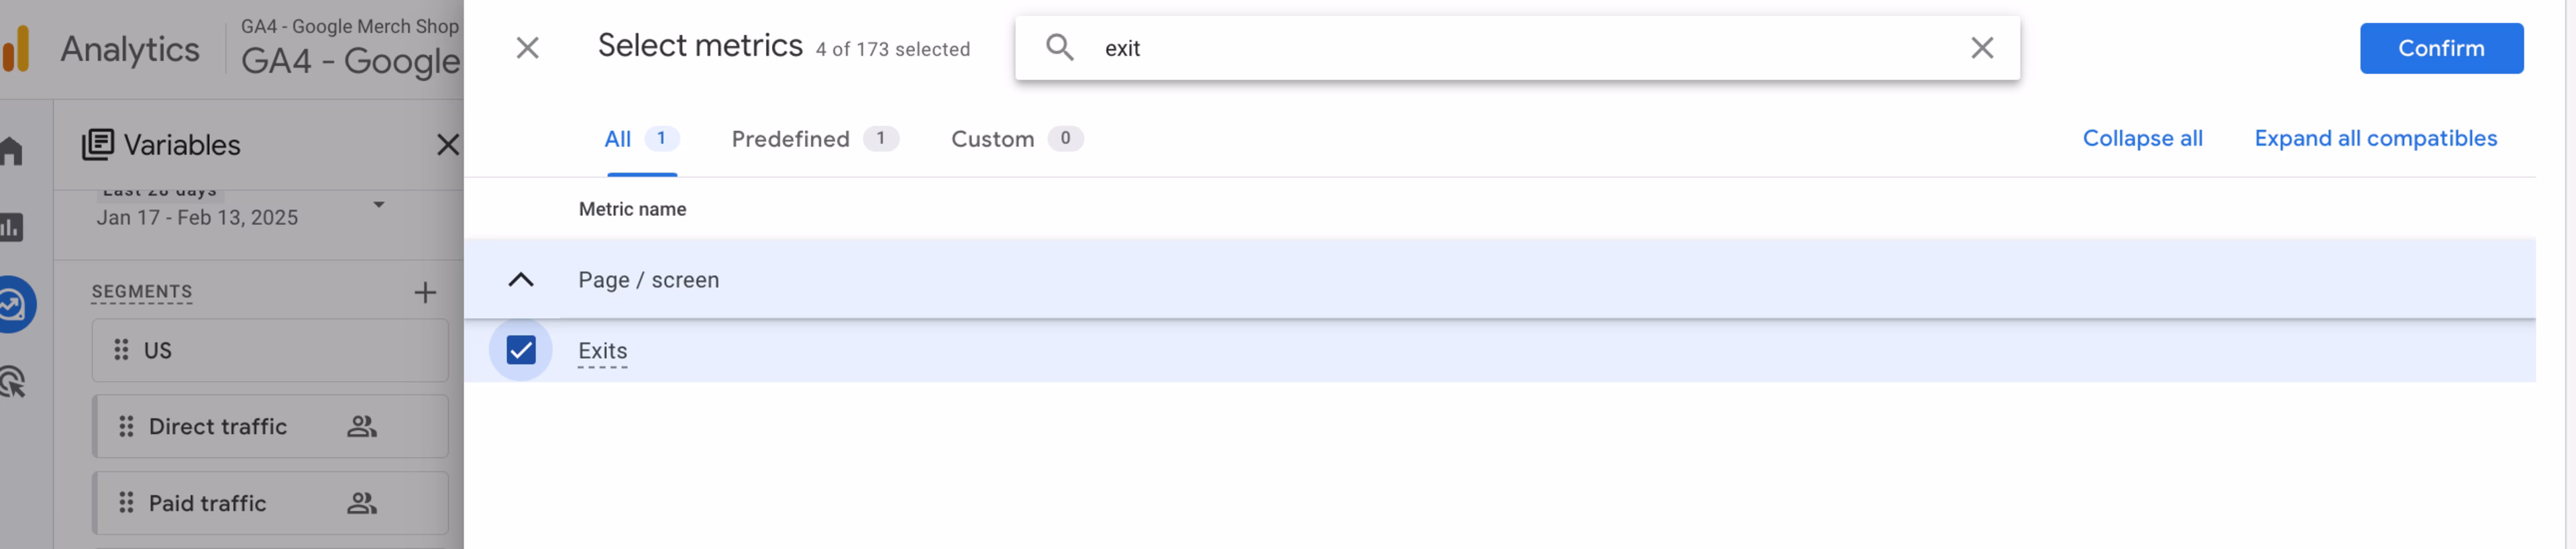
To find ‘Exits’ from the list of possible metrics, type it into the search bar
Go to the ‘Settings’ column, and scroll down until you see a headline called ‘Values’. From here, click on ‘+ Drop or select metric’. A menu will appear that lets you add ‘exits’ and ‘entrances’ to your report.
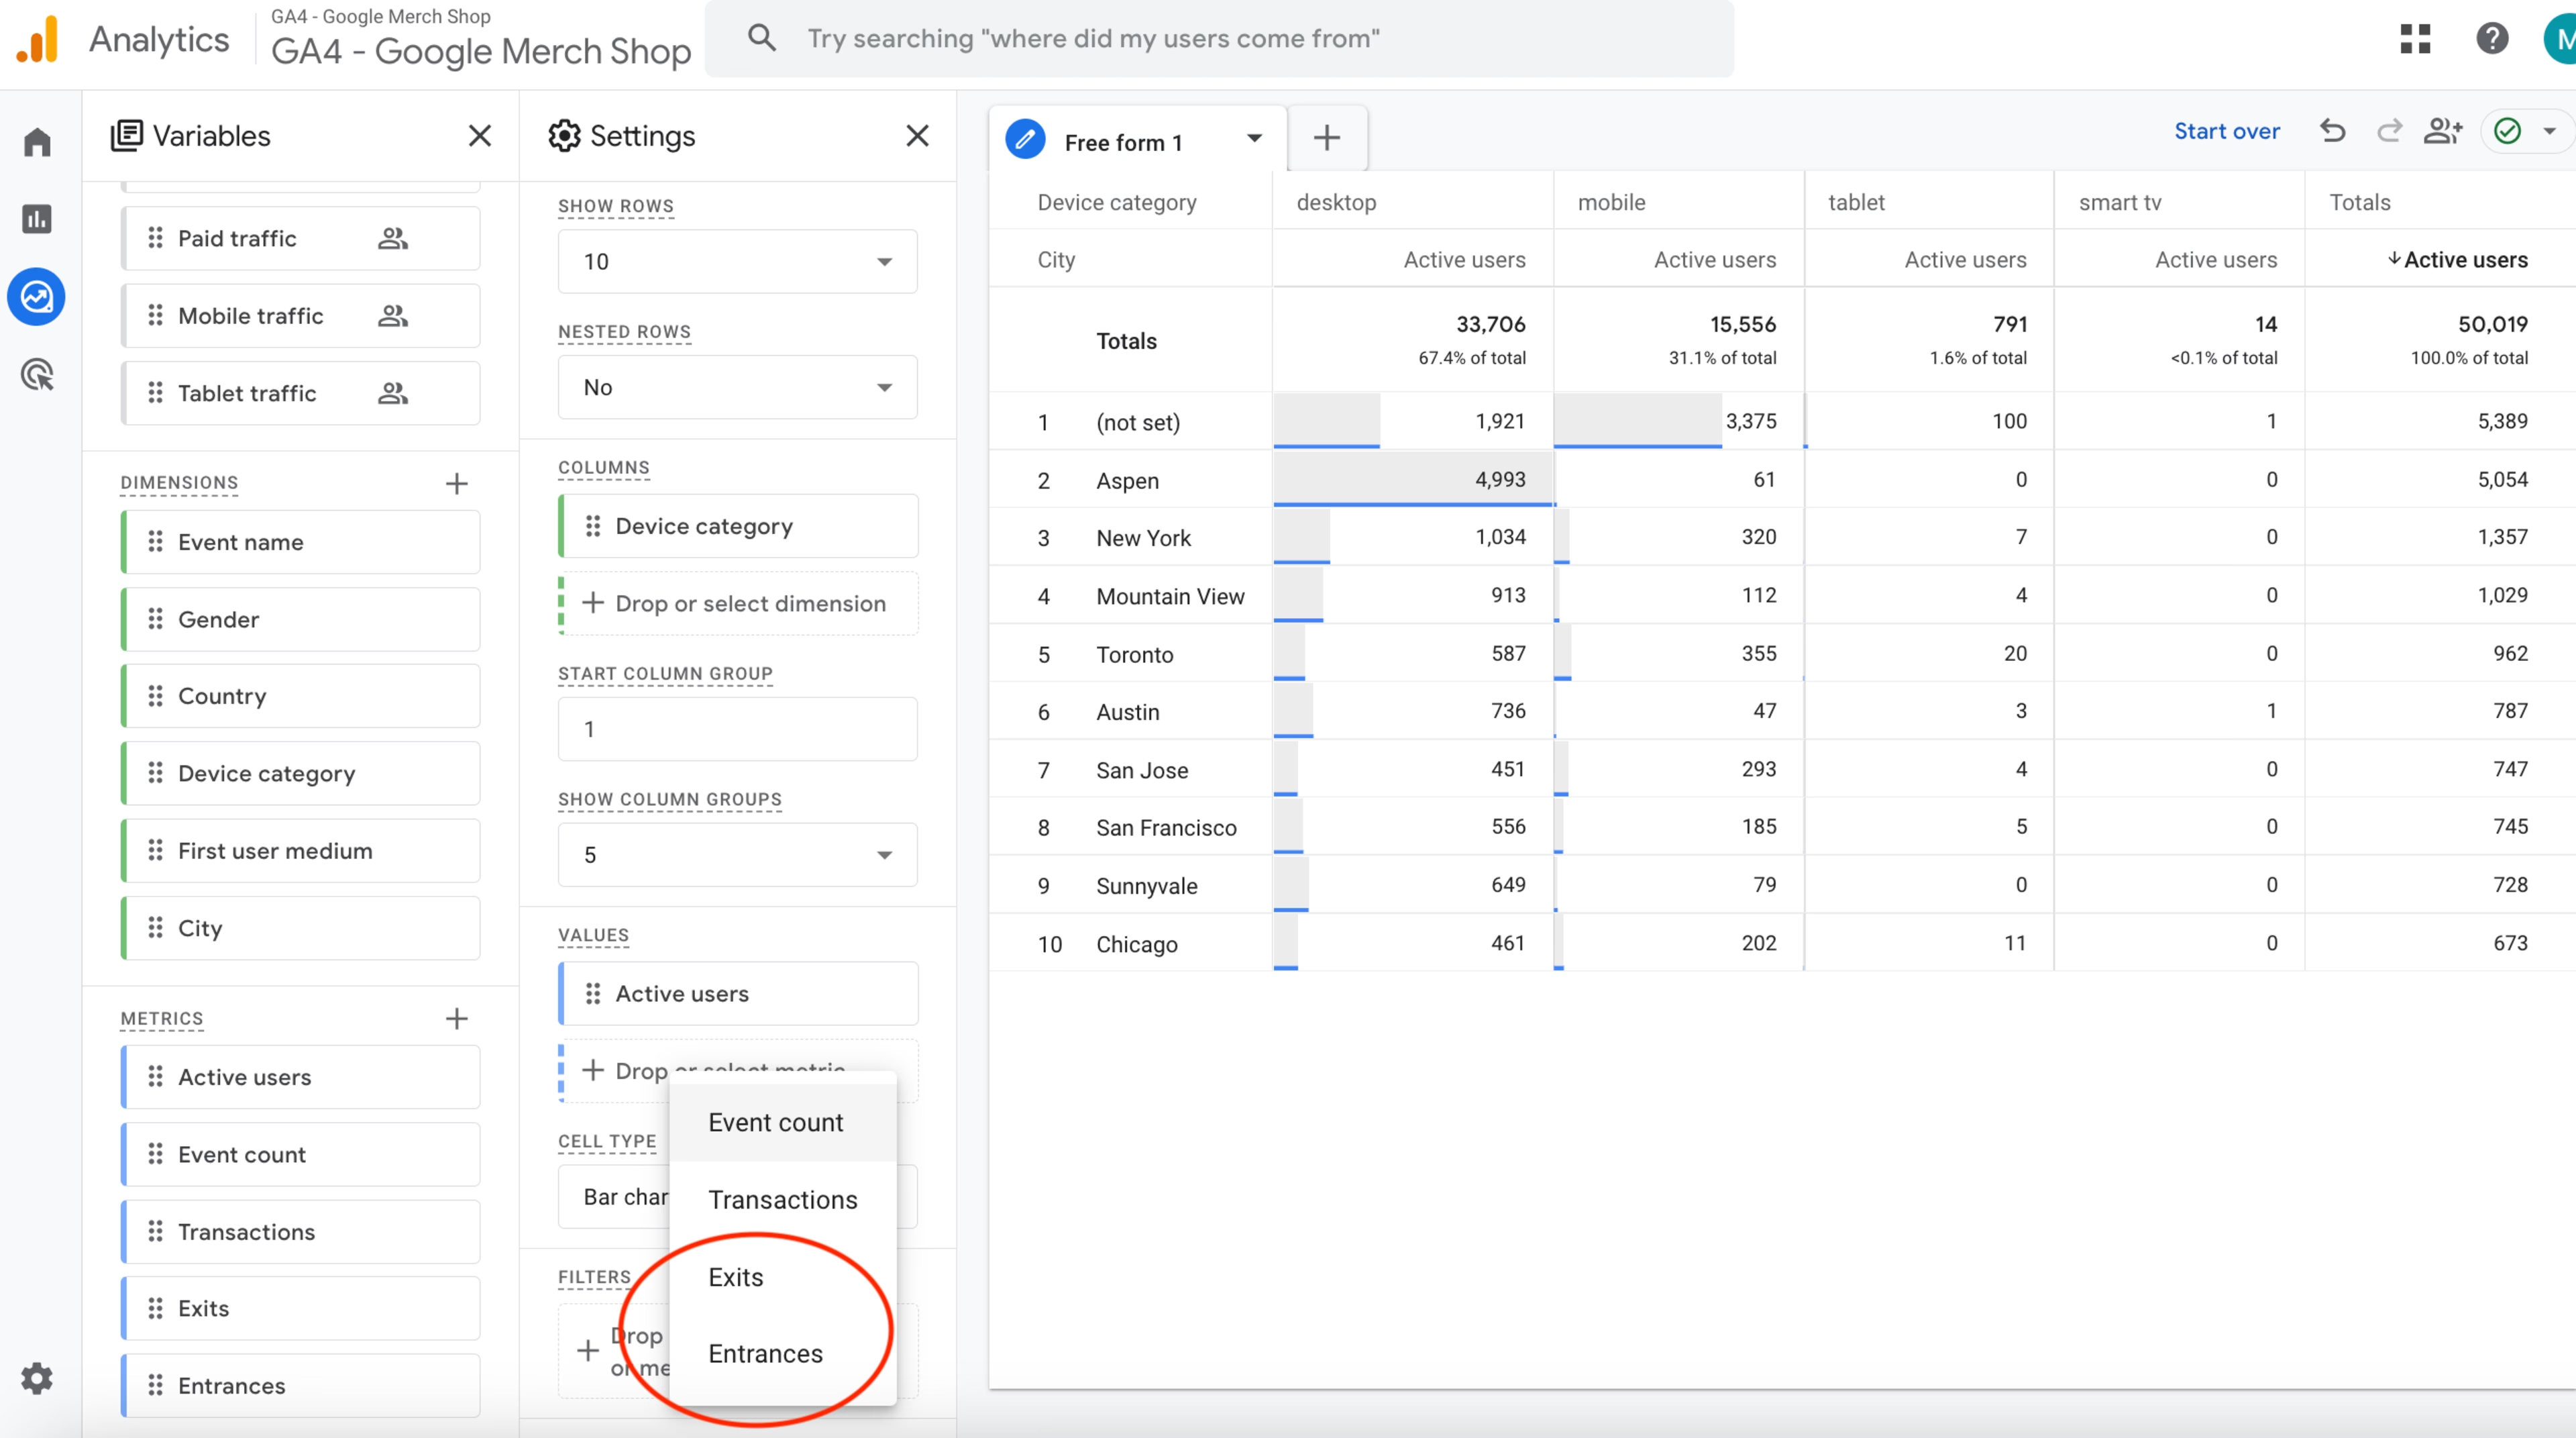
Select ‘Exits’ and ‘Entrances’ from the drop-down list to add them to your chart
Go to the ‘Variables’ sidebar and click on the grey cross next to the headline ‘Dimensions’. This will bring up a menu with options to add in more dimensions. Find the term ‘Page title’ from the list.
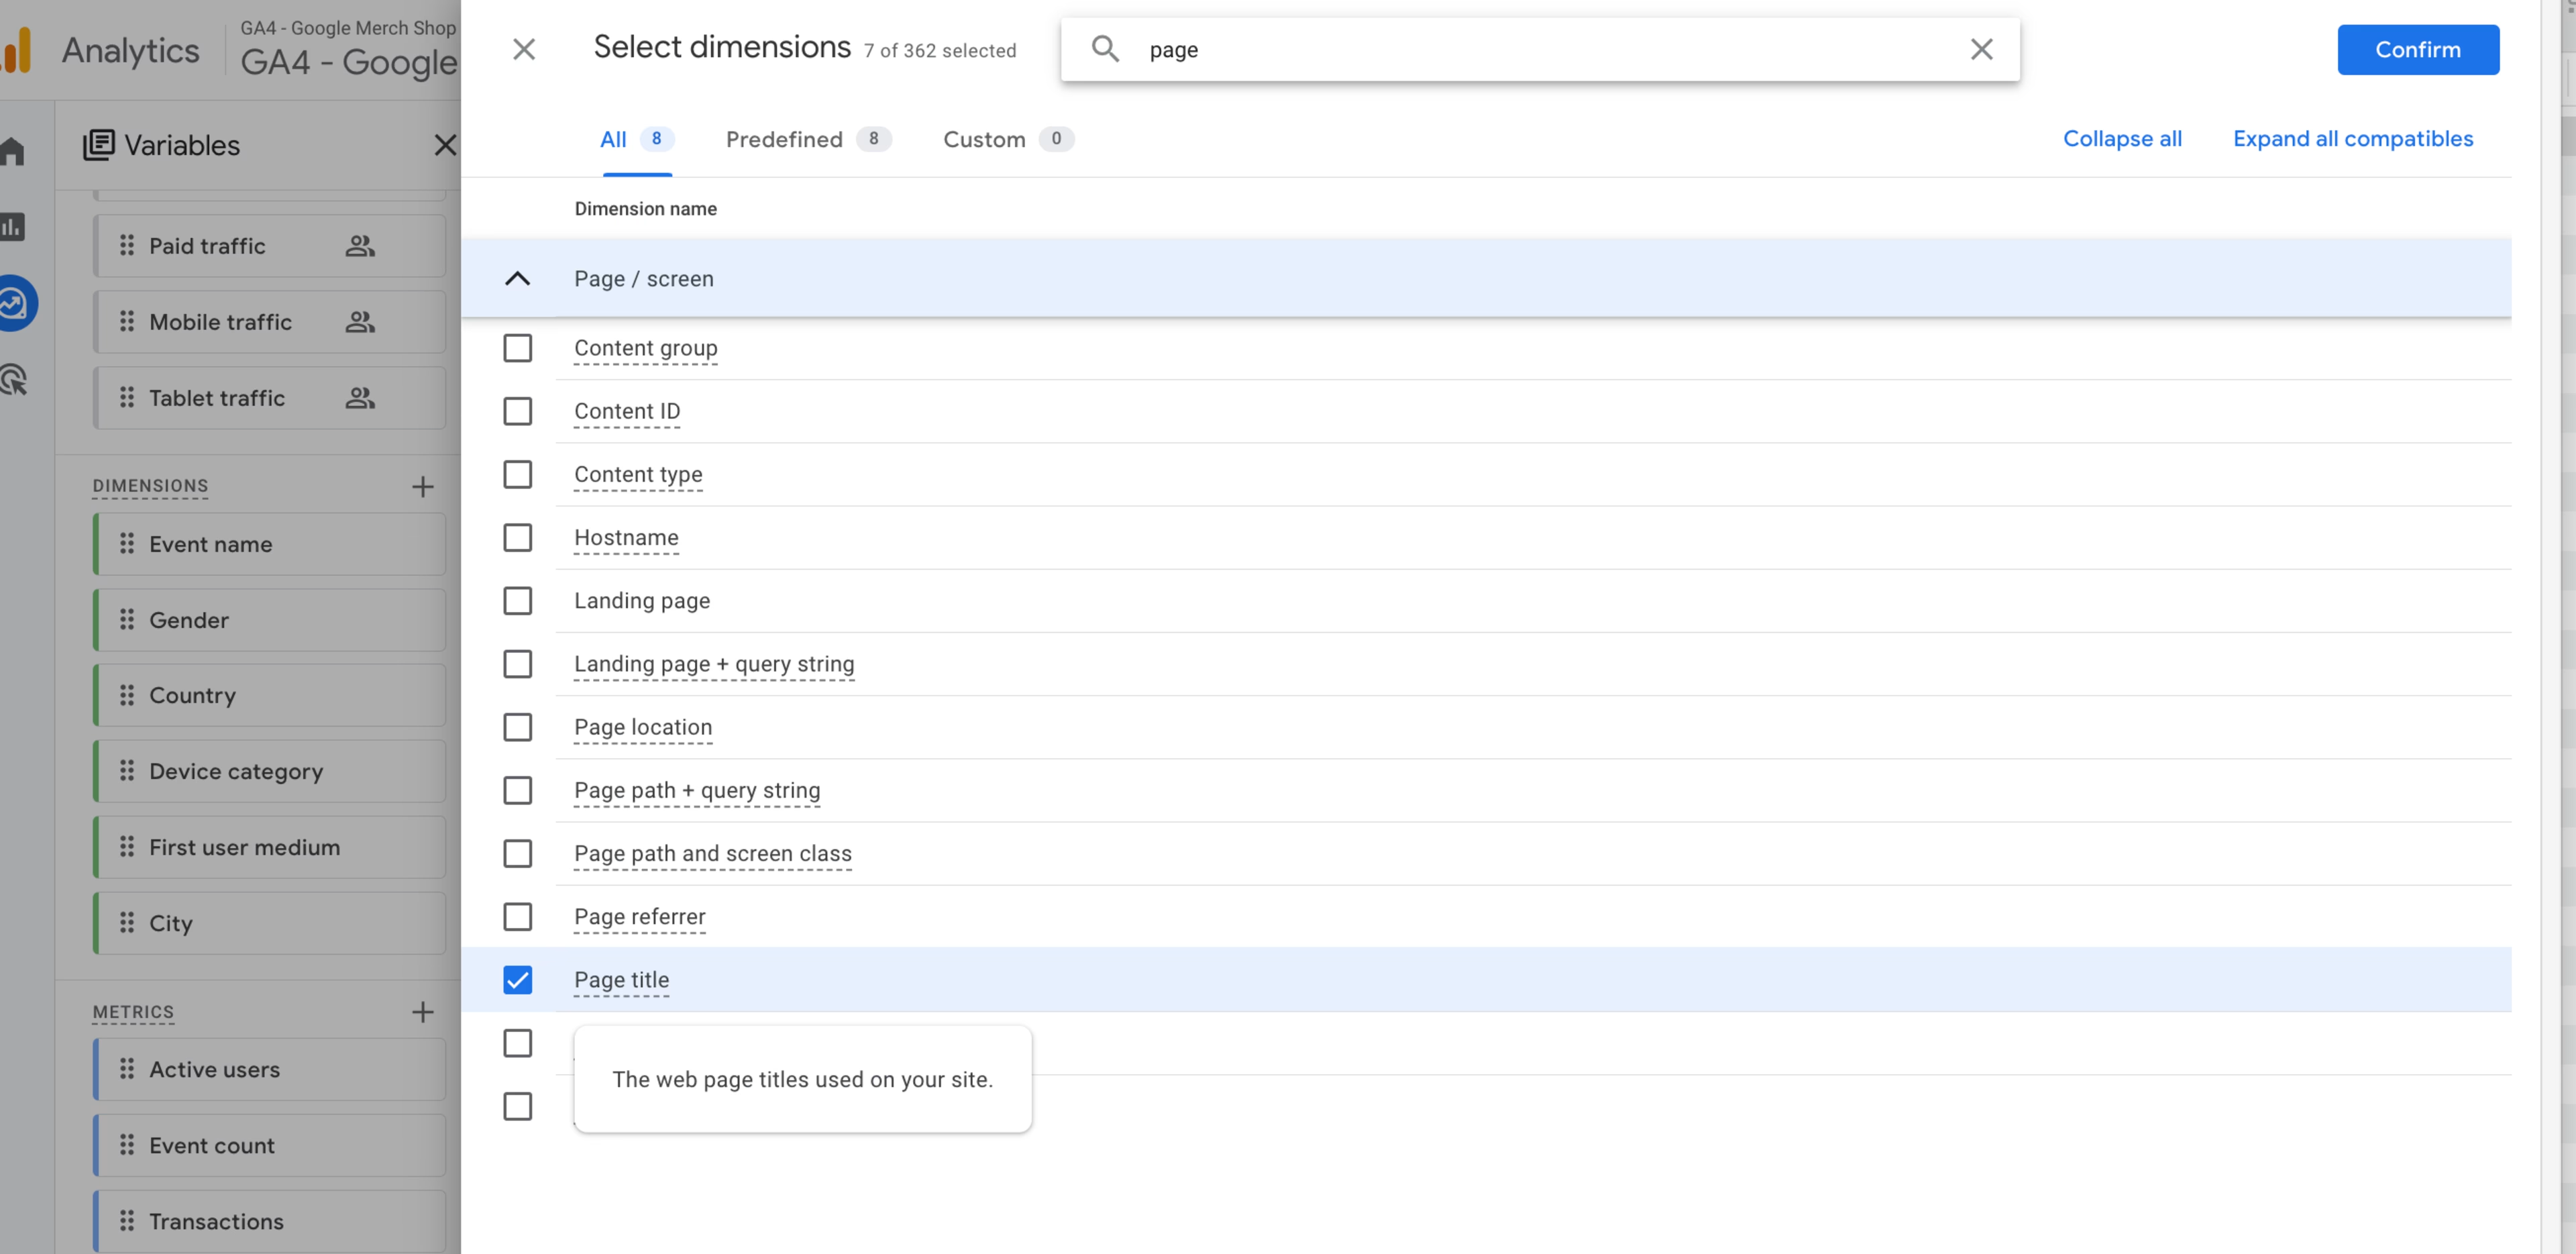
Select the dimension ‘page title’ and click ‘Confirm’ to save your choice
Now, you need to tweak the settings of this table so that it shows entrances and exits per page, rather than per city. Find the menu called ‘Settings’, and scroll down to ‘Rows’. Then click ‘+ Drop or select dimension’ and a small drop-down menu will appear. Click on ‘Page titles’.
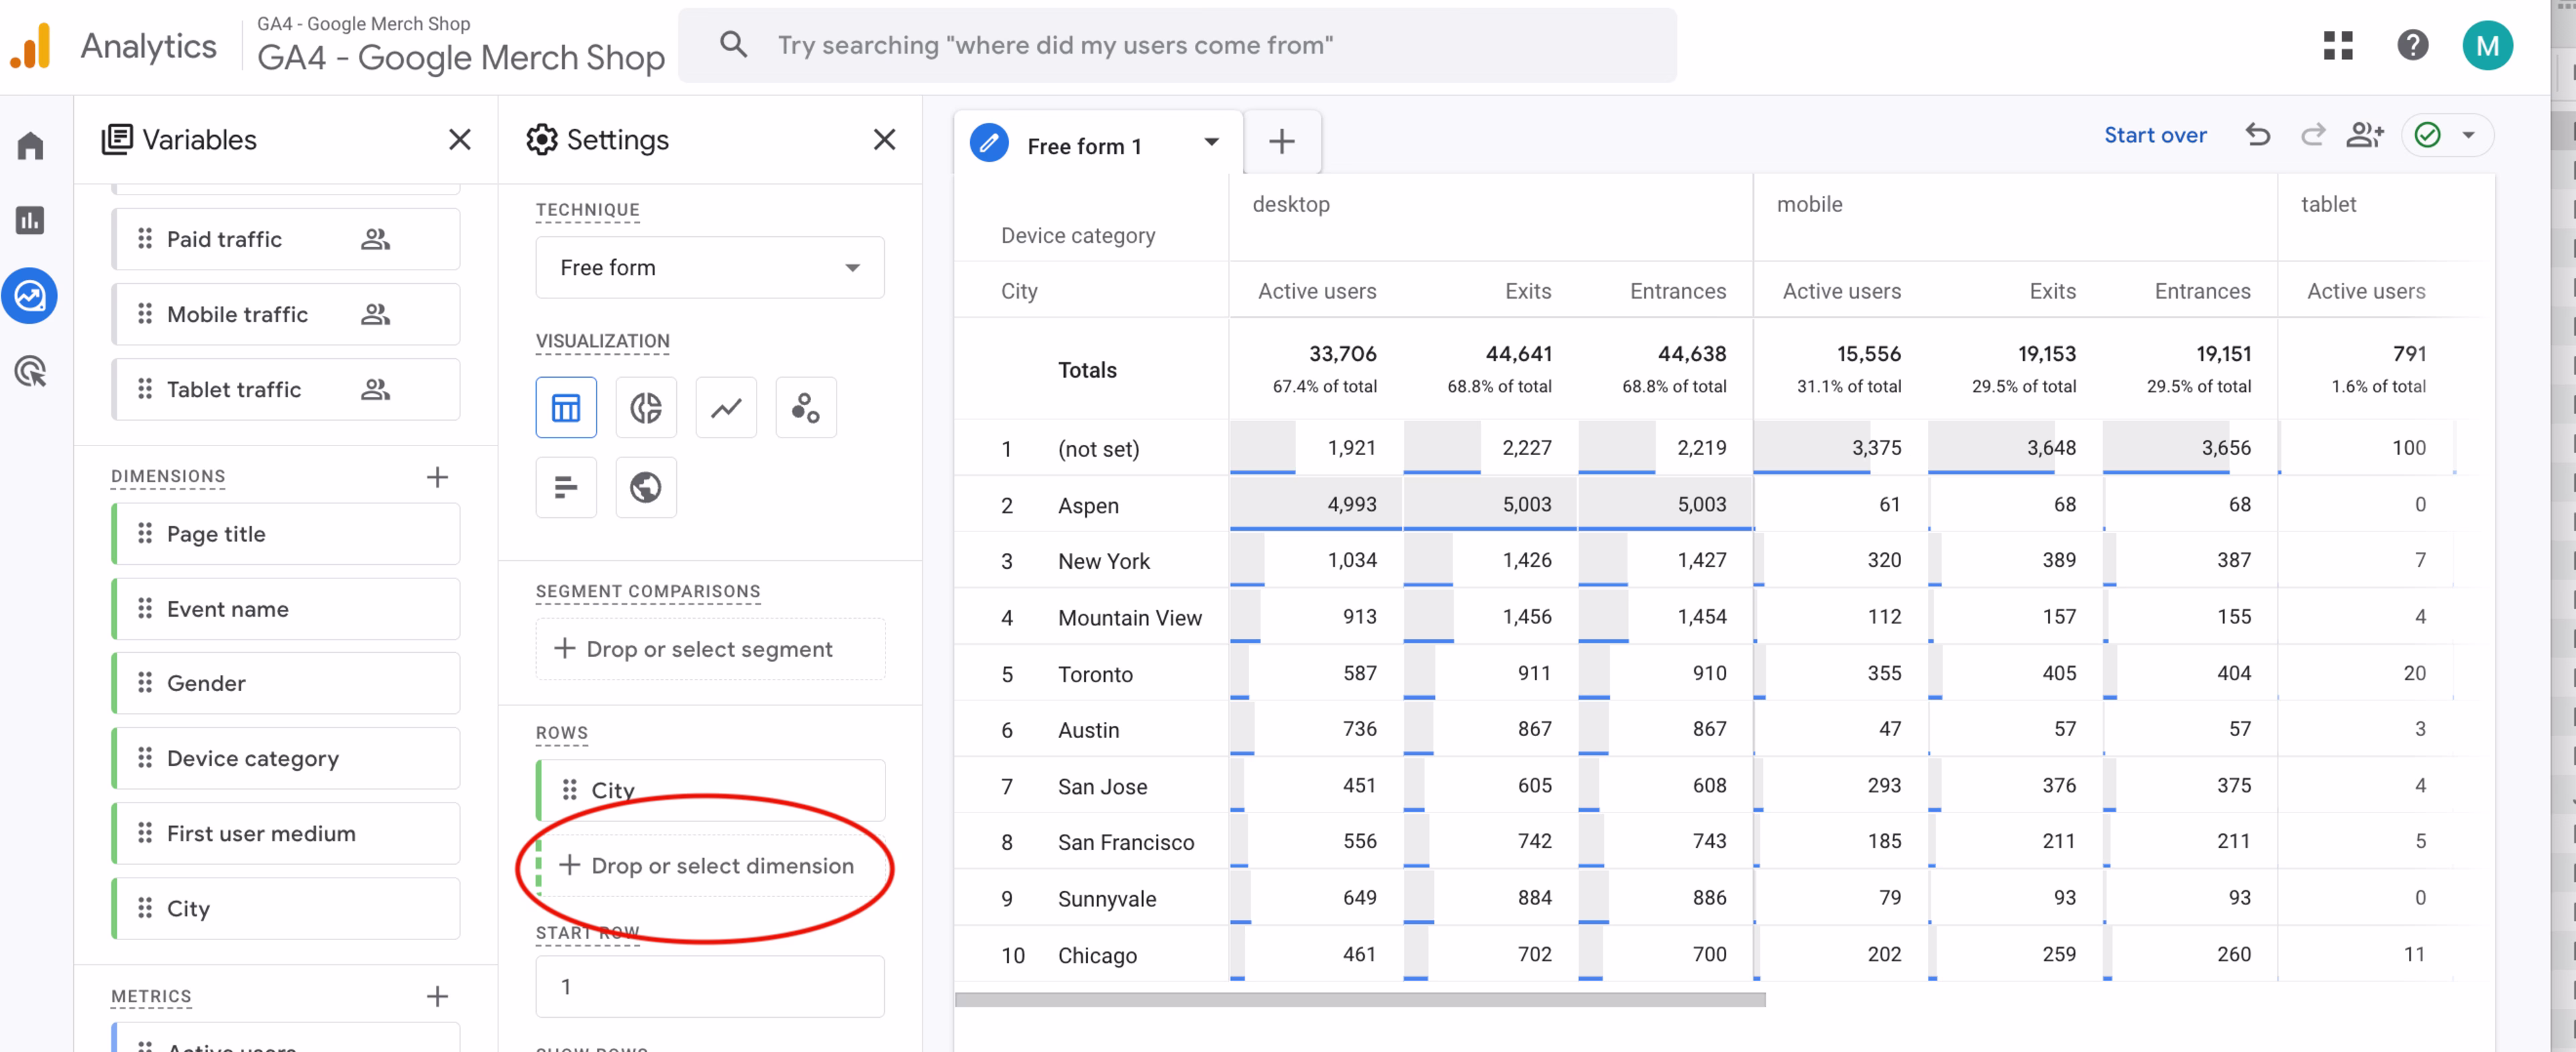
Click on ‘+ Drop or select dimension’ to add ‘page title’ to your graph
Still under the heading ‘Rows’, click on ‘City’. An ‘x’ will appear that lets you remove this metric from your graph.
Your graph should auto-populate to show your entrances and exits per page title for the last 28 days.
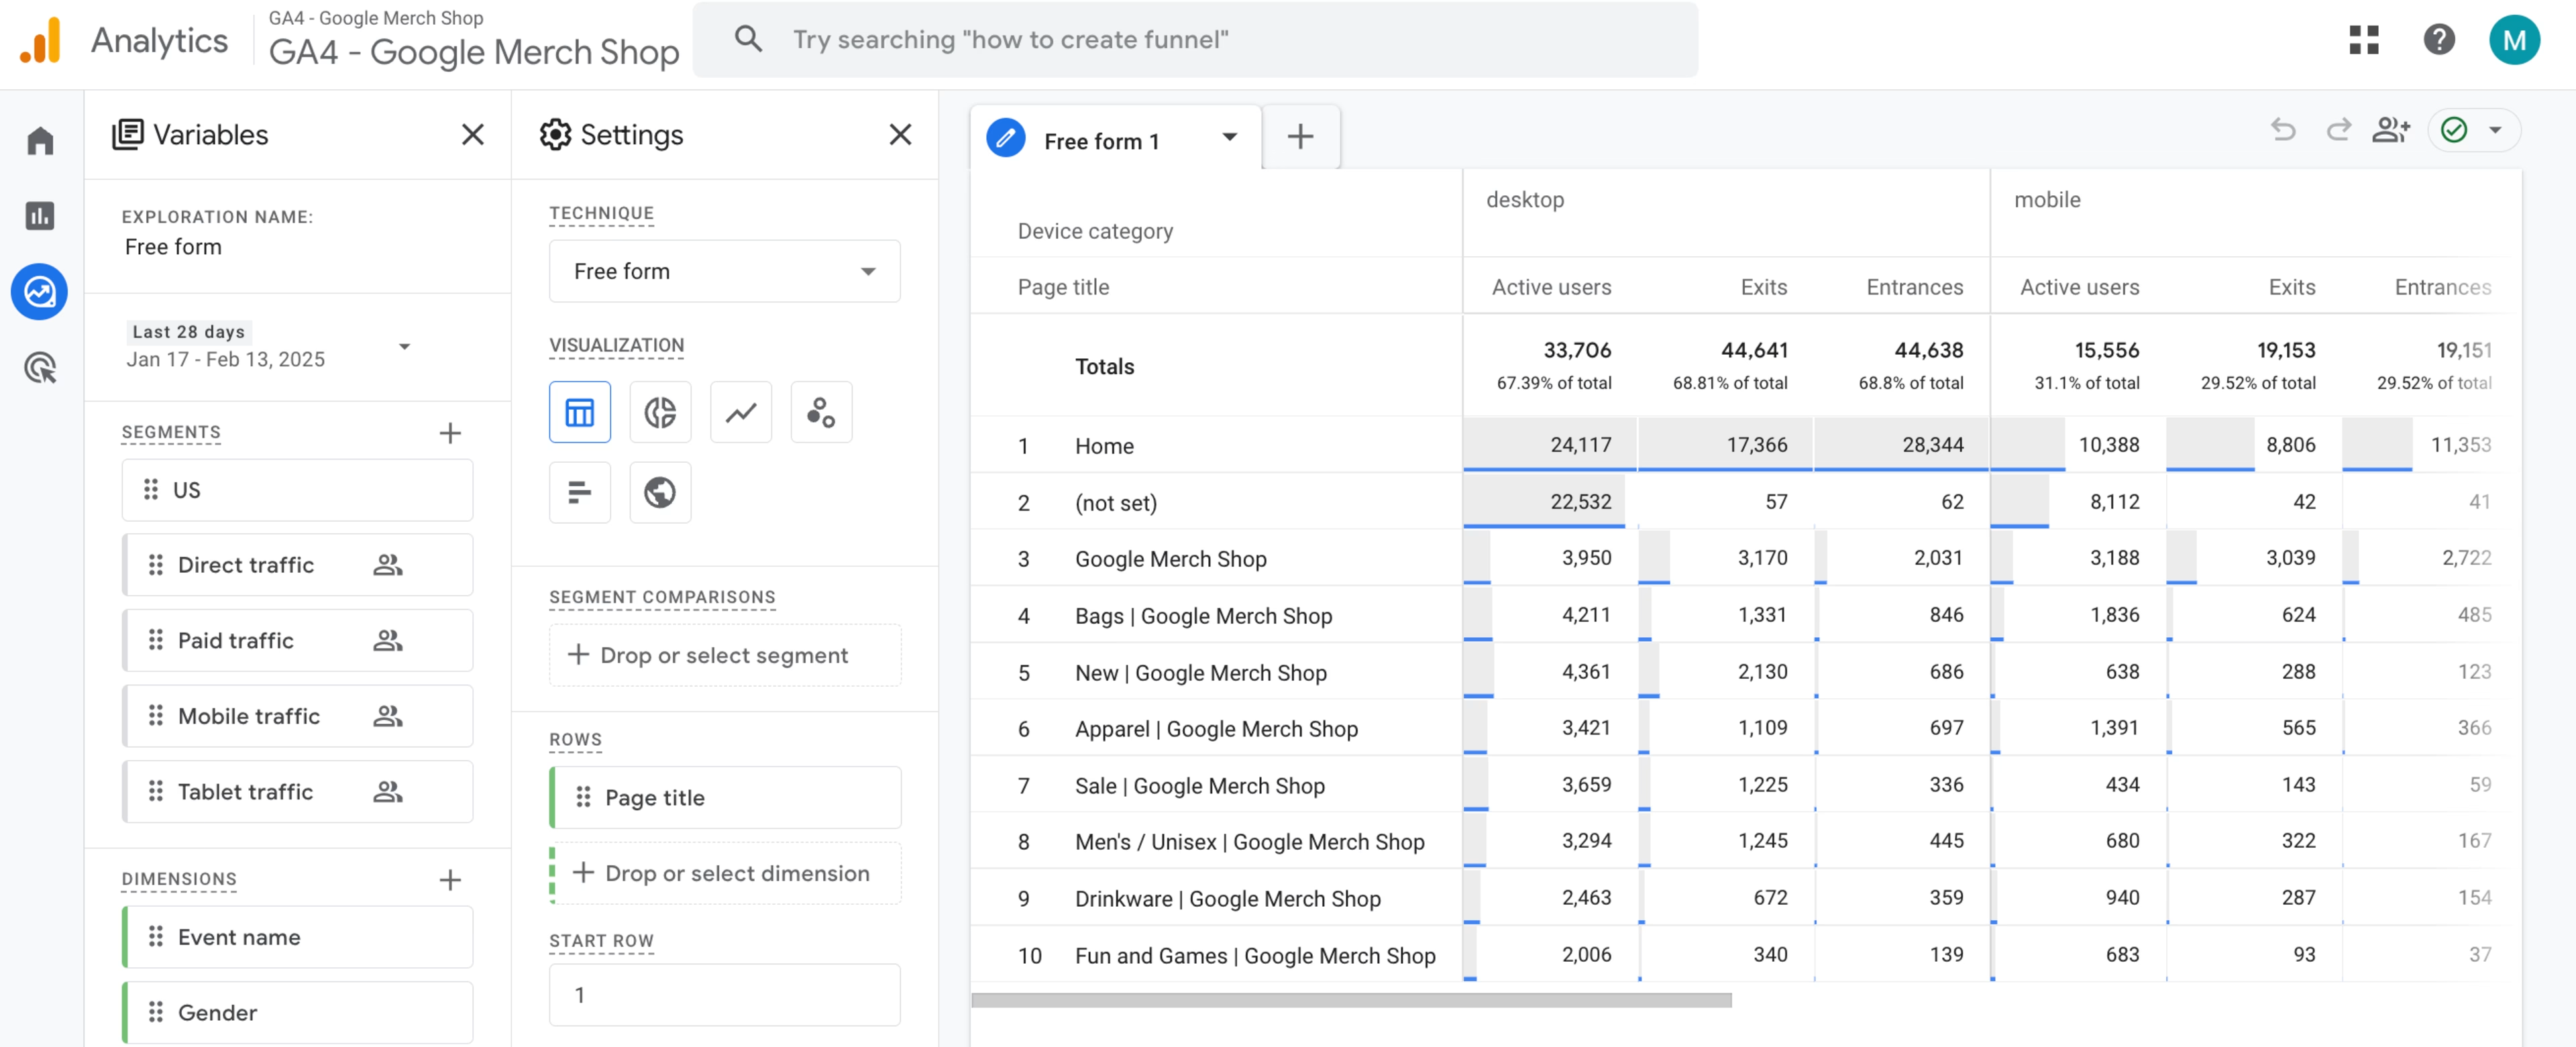
There you have it—a neat, customizable graph of your entrances and exits per page
3 ways to investigate and reduce high exit numbers on your site
As a traditional web analytics tool, GA4 will show you that something is happening on your website exit rate-wise, but it won’t be able to address your next 2 questions:
Why is this happening?
How do I fix it?
To answer both, you need to collect additional context and information. Here, we cover 3 user experience analytics and feedback tools that are immediately useful when investigating why exits happen and how to fix them: heatmaps, session replays, and on-site surveys.
1. Heatmaps: find the most problematic sections on your high-exit pages
What: once you know that your visitors are leaving from a specific page, you’ll want to investigate what may or may not be working on the page itself.
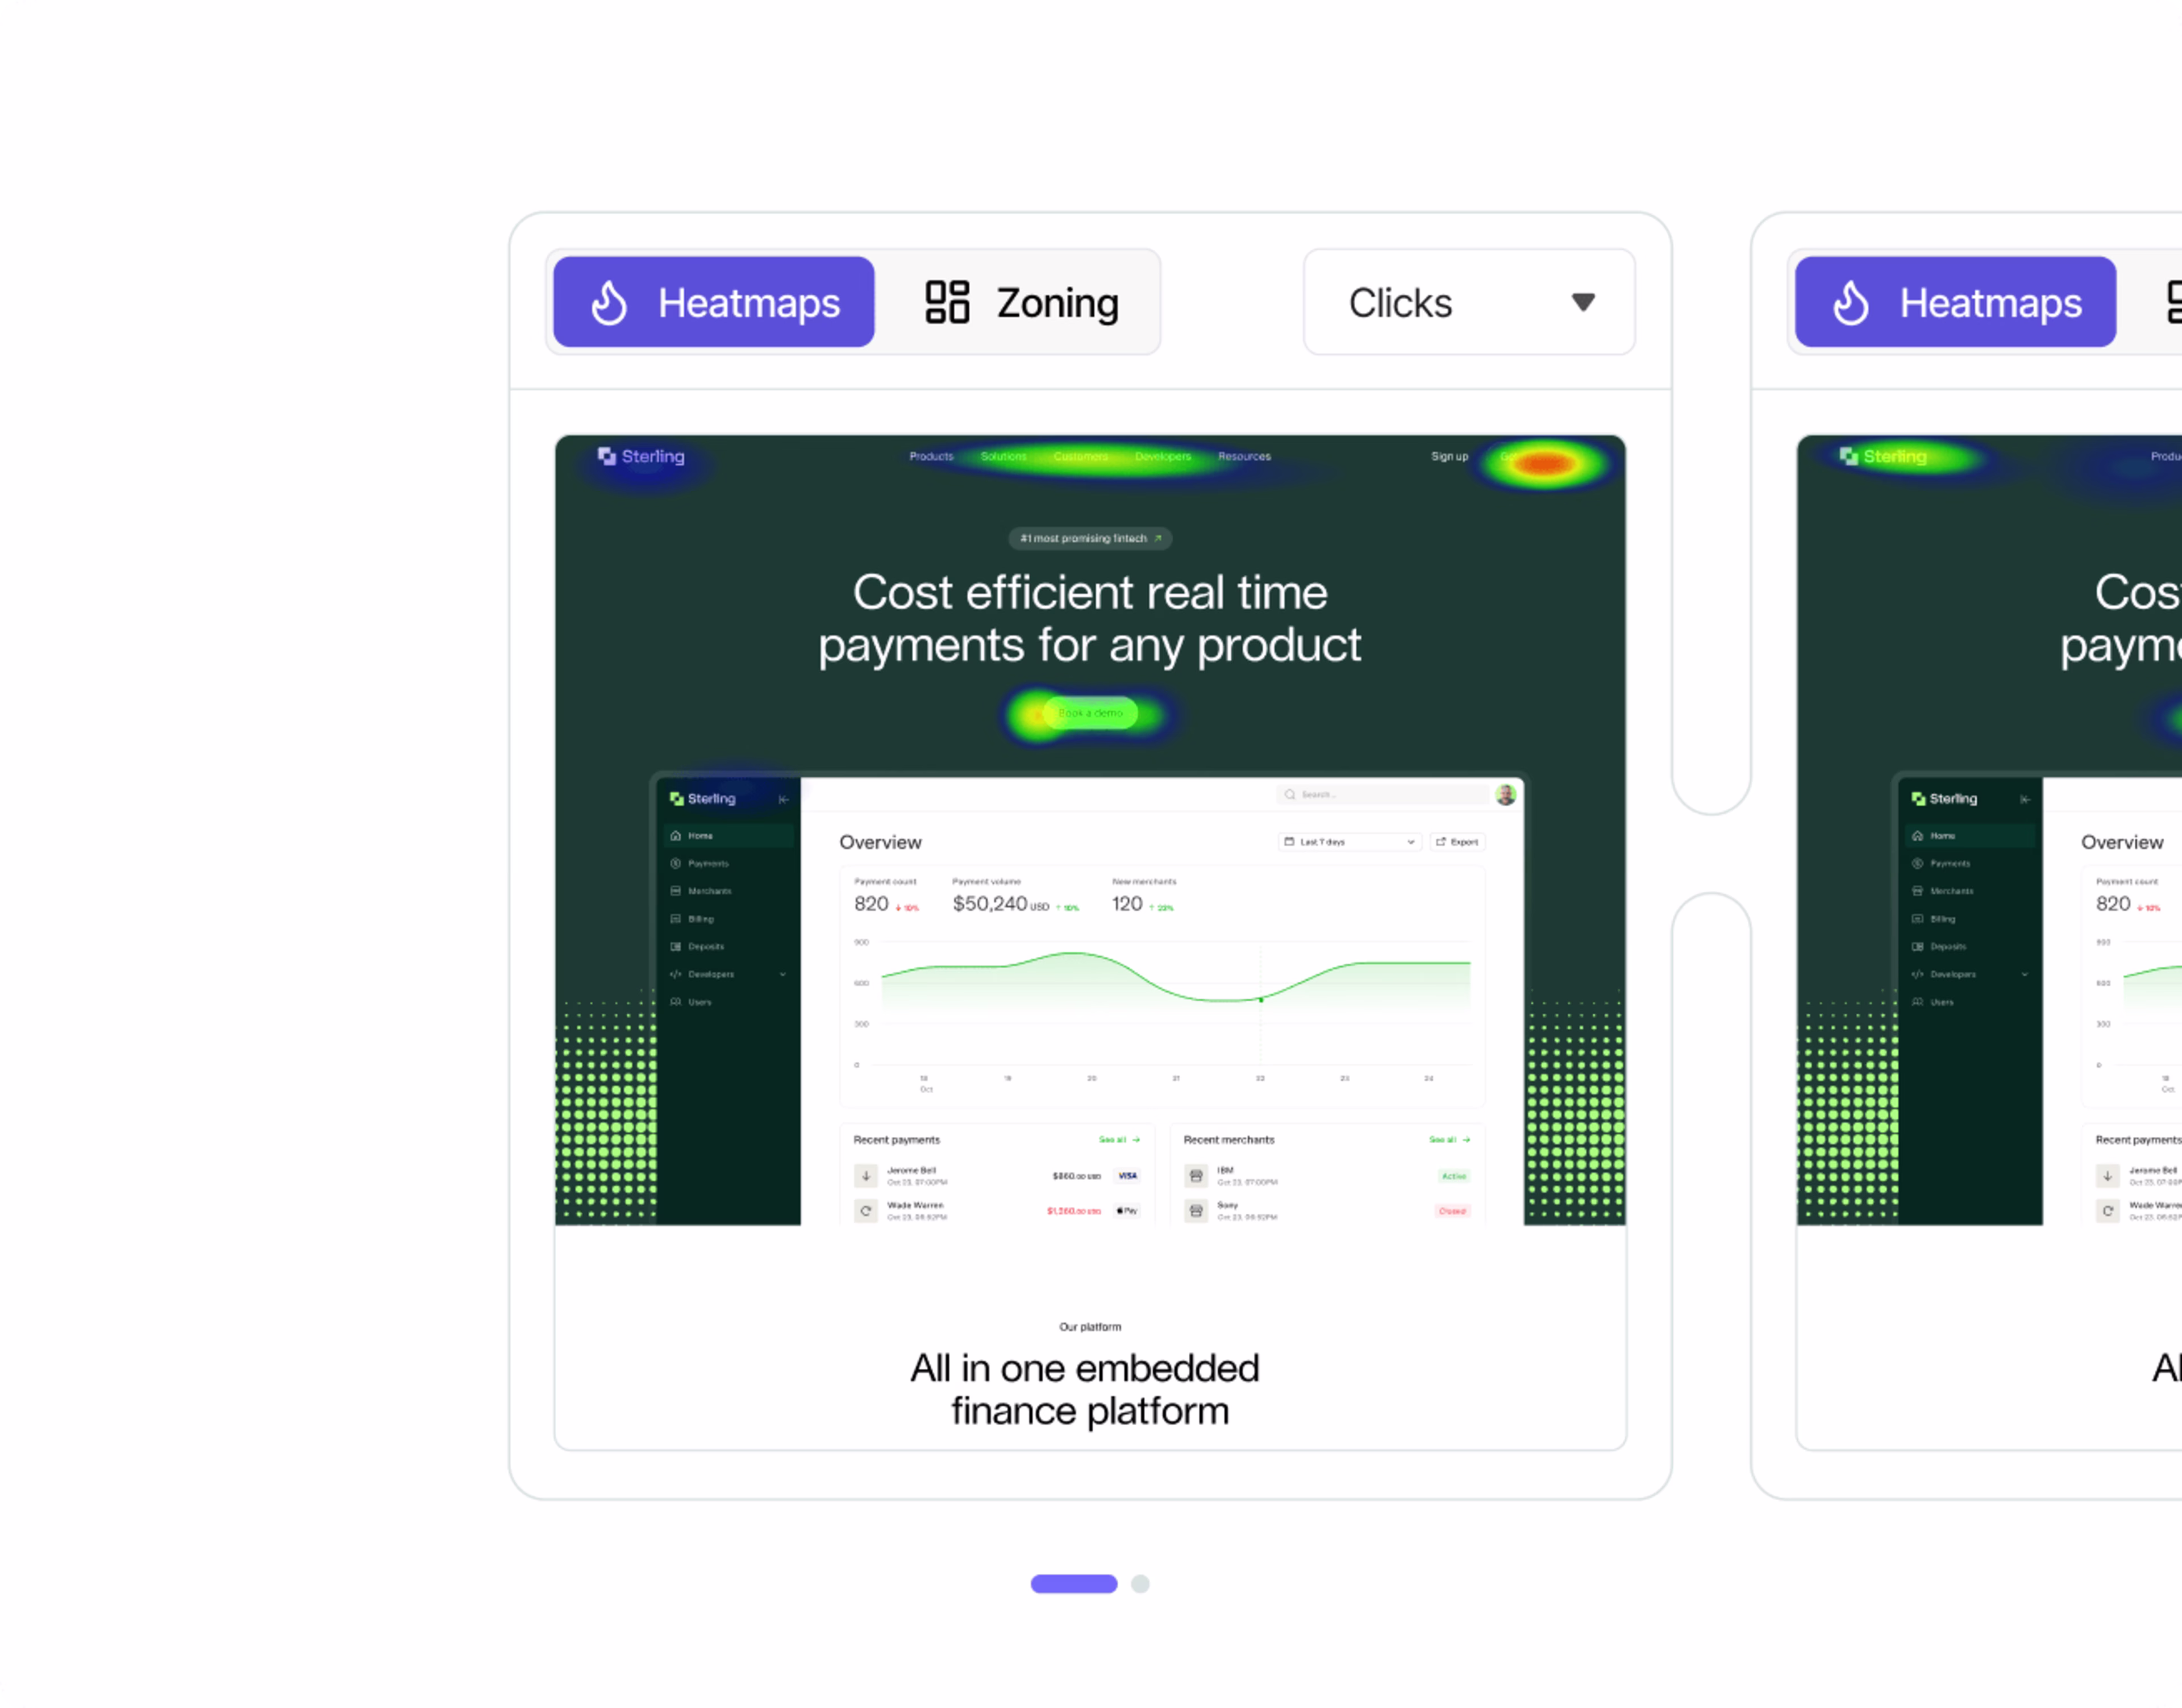
How: as people visit the page and data gets collected, use a tool like Contentsquare Heatmaps to start rendering the behavioral data points visually via scroll maps, which you can review to see how far down the page people scroll, and click maps, which show you what elements on the page people interact with.
![[Visual] website monitoring Heatmaps & Engagements](http://images.ctfassets.net/gwbpo1m641r7/zSEt2fD70YN0KvCJ6Aycj/31e98fd778c4cc54879e524d717f5c91/Heatmaps___Engagements__3_.png?w=2048&q=100&fit=fill&fm=avif)
Use Contentsquare to create various types of heatmaps, including ones that show you where users scroll or click
Based on the data, you might already be able to spot behavior patterns that explain high exit numbers: maybe people are missing information that sits ‘below the fold’ on the page, or they could be frustrated after clicking on non-clickable elements, like an inactive call to action (CTA) button.
💡Pro tip: with Contentsquare, you can filter the data that goes into your heatmaps.
You could, for example, analyze a high-exit page by creating a heatmap to show where users who exited that page clicked, and another of the same page that shows where users who didn’t exit clicked—and then compare them.
Perhaps you’ll see that users who scrolled to the bottom of the page tend to stick around for longer, indicating that they found the information they were looking for. In which case, that’s great evidence to redesign the page.
Contentsquare allows you to create 2 versions of the same heatmap using data from different user segments—so ou can compare them
2. Session replays: watch how people interact with a page during their journey
What: to get more context on visitor engagement, you’ll also want to review why users drop off at certain pages they encounter on their journey through your site.
How: use session replays—-video-style recordings of user sessions. Watch ones that end on high-exit pages so you can get a better sense of whether visitors
See the site content correctly
Are distracted by intrusive pop-ups, visuals, or other content elements
Encounter bugs or issues on a specific page along their journey
Exhibit behaviors such as rage clicking on certain elements
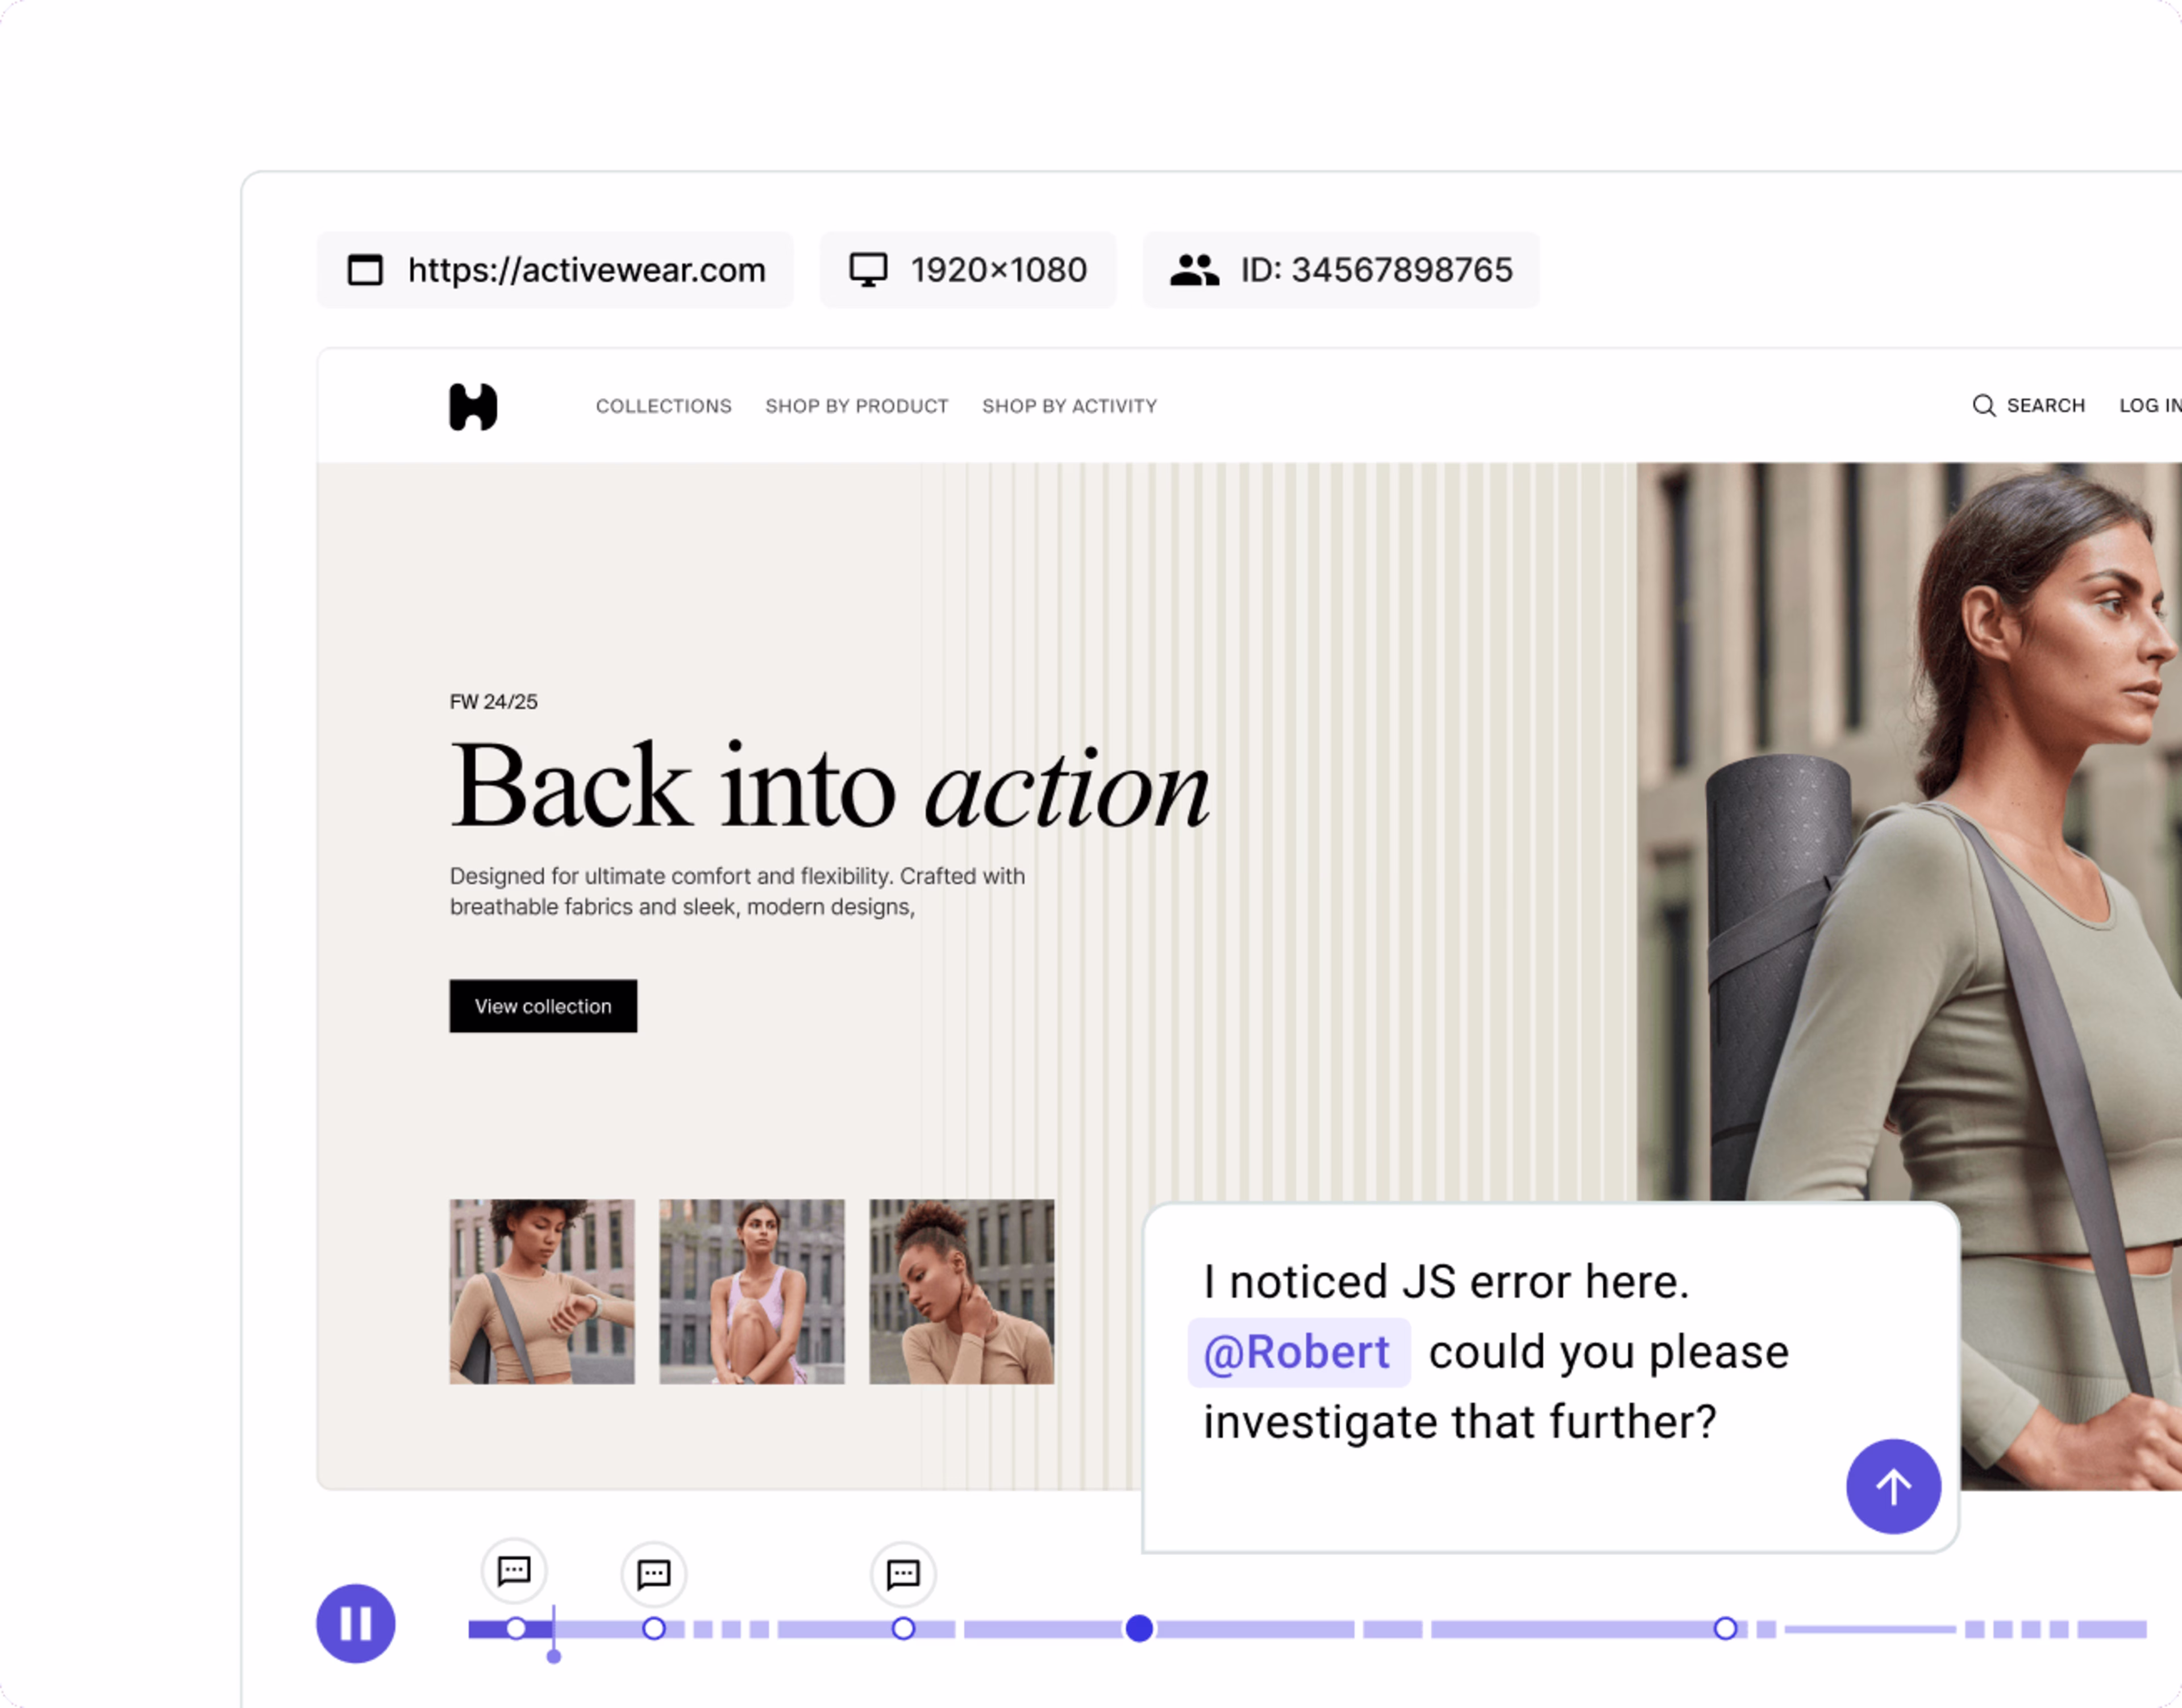
An example of a session replay captured with Contentsquare
💡Pro tip: factor exit data into your conversion rate optimization strategy. Spot exactly where visitors drop off in the conversion funnel with a tool like Contentsquare’s Journey Analysis. This turns your customer journey data into a sunburst-shaped visualization, which allows you to see which pages users pass through, and where they exit.
You can then click through to watch session replays of high-exit pages.
![[Customer Story] [Clarins] Journey Analysis](http://images.ctfassets.net/gwbpo1m641r7/4nozxbnvlcRqDnxYjbPNnm/707c4b2a2c0c36077eb336538bb1098c/Complex.svg?w=1920&q=100&fit=fill)
Identify where and why visitors leave your conversion funnel with the power duo of Journey Analysis (pictured) plus Session Replay
3. On-site surveys: ask your visitors what’s not working on a page
What: using heatmaps and session replays may give you a clear idea of what’s happening when a visitor leaves a page. But if they don’t, why not just ask your users directly?
How: place an on-site survey on the page and set it to ask a specific question, such as
What’s missing on this page?
What’s stopping you from continuing today?
What are you looking for that you can’t find?
![[Visual] Churn survey CSQ](http://images.ctfassets.net/gwbpo1m641r7/16cklE1JBmOUwKxy5zTEqr/c91a8086524022499570708d450187d7/unnamed__40_.png?w=1080&q=100&fit=fill&fm=avif)
An example exit survey that asks visitors why they’re leaving a page
You can ask both open and close-ended survey questions, depending on the information you want to gather. After you’ve collected some answers, analyze them to look for patterns or insight that might point you in the direction of a solution.
💡Pro tip: Contentsquare’s Surveys tool allows you to set up an effective exit-intent survey in a couple of minutes. Get started quickly using our exit-intent survey template.
If the template isn’t a good fit for your use case, use Contentsquare’s AI for surveys to create one tailor-made for you instead. Simply enter the goals of your survey, and it’ll generate effective, unbiased questions. Place the survey on your high-exit pages and tweak the settings so that it appears as a pop-up when users attempt to leave. You’ll soon be collecting invaluable voice of customer insights into what’s putting your users off.
![[Visual] AI Survey generator](http://images.ctfassets.net/gwbpo1m641r7/2XfaejicMBwTa2koYbv8o2/fae140315da16dfef512fdd50e22b4dc/Screenshot_2024-11-06_at_14.23.28.png?w=3840&q=100&fit=fill&fm=avif)
Launch your survey faster with Contentsquare's AI for surveys tool
Prevent exits with experience insights
To understand what your exit data says about your users, cross-reference it with insights from an experience intelligence platform like Contentsquare. Tools like session replays, surveys and heatmaps will reveal whether high exit numbers speak to friction points, unengaging content, and technical issues—or simply satisfied customers that have found what they were looking for.
GA4 exit rate FAQs
In GA4, an ‘exit’ refers to a visitor leaving a site from a particular page. For example, if someone lands on an ecommerce site’s homepage, navigates to a category page, then to a product page, and then leaves the site, the ‘exit’ is attributed to the product page:
ENTER → homepage → category page → product page → EXIT
![[Visual] Contentsquare's Content Team](http://images.ctfassets.net/gwbpo1m641r7/3IVEUbRzFIoC9mf5EJ2qHY/f25ccd2131dfd63f5c63b5b92cc4ba20/Copy_of_Copy_of_BLOG-icp-8117438.jpeg?w=1920&q=100&fit=fill&fm=avif)
![[Guide] [Exit-intent survey] Mobile - cover](http://images.ctfassets.net/gwbpo1m641r7/7c2vpMBlzXX8htdM9CvYec/8937d33a5f912c4cc7de615884508be2/pexels-uriel-mont-6280922.jpg?w=1920&q=100&fit=fill&fm=avif)
