![[Visual] Stock image - people at computers](http://images.ctfassets.net/gwbpo1m641r7/4dLS2lpl35VuAo0llA8dzU/5ac7799927c07517e600a2ae77499bf0/AdobeStock_376405487.png?w=3840&q=100&fit=fill&fm=avif)
What if we told you SEO isn’t just about getting people to your site?
Sure, driving traffic is a top priority, but what happens after a user lands on your page is just as important. Do they bounce right away? Do they stick around, explore, and convert?
User signals like dwell time offer valuable insight into engagement. And strengthening these signals helps you improve your site’s UX and boost your rankings.
But not all user signals carry the same weight. This article dives into the user behavior signals that impact rankings—and how you can use this data to prioritize site improvements and optimize your SEO ranking.
Key Insights
3 common user signals that SEOs speculate impact rankings are click-through rate, dwell time, and bounce rate. However, Google has never explicitly stated which signals it uses to determine rankings.
Instead of strictly focusing on user signal metrics as a way to boost rankings, SEO and product teams should enhance the overall user experience. When users have a positive experience on your site, they’re more likely to return, share your content, and convert into leads or customers.
What are user signals?
User signals are metrics that give search engines information about how users behave on your site, like bounce rate. These signals help search engines determine whether your site’s content satisfies a user’s search intent (the reason someone searches a query). If your content meets that intent, you'll likely have stronger user signals, and search engines will reward your site with better rankings.
For instance, if someone clicks on your site in the search results, but quickly leaves, Google might take that as a sign that your content didn’t meet their needs—and potentially lower your rankings for that keyword.
You can monitor your site’s user signals using web analytics tools, which offer detailed insights into how visitors engage with your site.
Why are user signals important?
User signals alert you to bugs or issues that may be affecting your site’s user experience. For example, it’s a good idea to investigate a page with an abnormally high bounce rate—it could indicate possible errors.
Additionally, Google wants to surface content that aligns with user search intent. Positive user signals suggest that your content is hitting the mark, which may boost your chances of ranking, and higher rankings mean more traffic, and ultimately, more conversions—as long as the rest of your site’s SEO is in good shape.
As Google states, “We also use aggregated and anonymized interaction data to assess whether search results are relevant to queries.” That means providing a strong user experience helps your content appear throughout the search results, including places like AI Overviews.
![[Visual] google search results](http://images.ctfassets.net/gwbpo1m641r7/74amL7BoEBcoNPKDnsGbMJ/04dc75903e51fb897cdb8a6723f4b9dd/google_search.png?w=3840&q=100&fit=fill&fm=avif)
At Contentsquare (👋), we prioritize user experience which helps our content rank in AI Overviews
3 key user signals to track to improve SEO
There are plenty of ranking factors confirmed by Google (like Core Web Vitals). But user signals are more of a gray area. And while Google hasn’t directly named any specific user signals that influence rankings, research suggests these 3 metrics play a role in site rankings.
1. Click-through rate
Click-through rate (CTR) is the number of users who click your site’s link in the search results. High CTRs indicate that your content appears relevant to searchers and is enticing. The average CTR differs by ranking position, but CTRs generally range from around 2%–27% for the top 10 results, according to Backlinko.
![[Visual] backlinko average CTR](http://images.ctfassets.net/gwbpo1m641r7/5D2XFGlMn3Kq35JnTM7IBI/ee8b065cd8644dd3de6c74f82e47f98e/backlinko_average_CTR.png?w=1920&q=100&fit=fill&fm=avif)
Source: Backlinko
You can find your CTR in Google Search Console broken up by different queries, pages, countries, devices, search appearances, or dates.
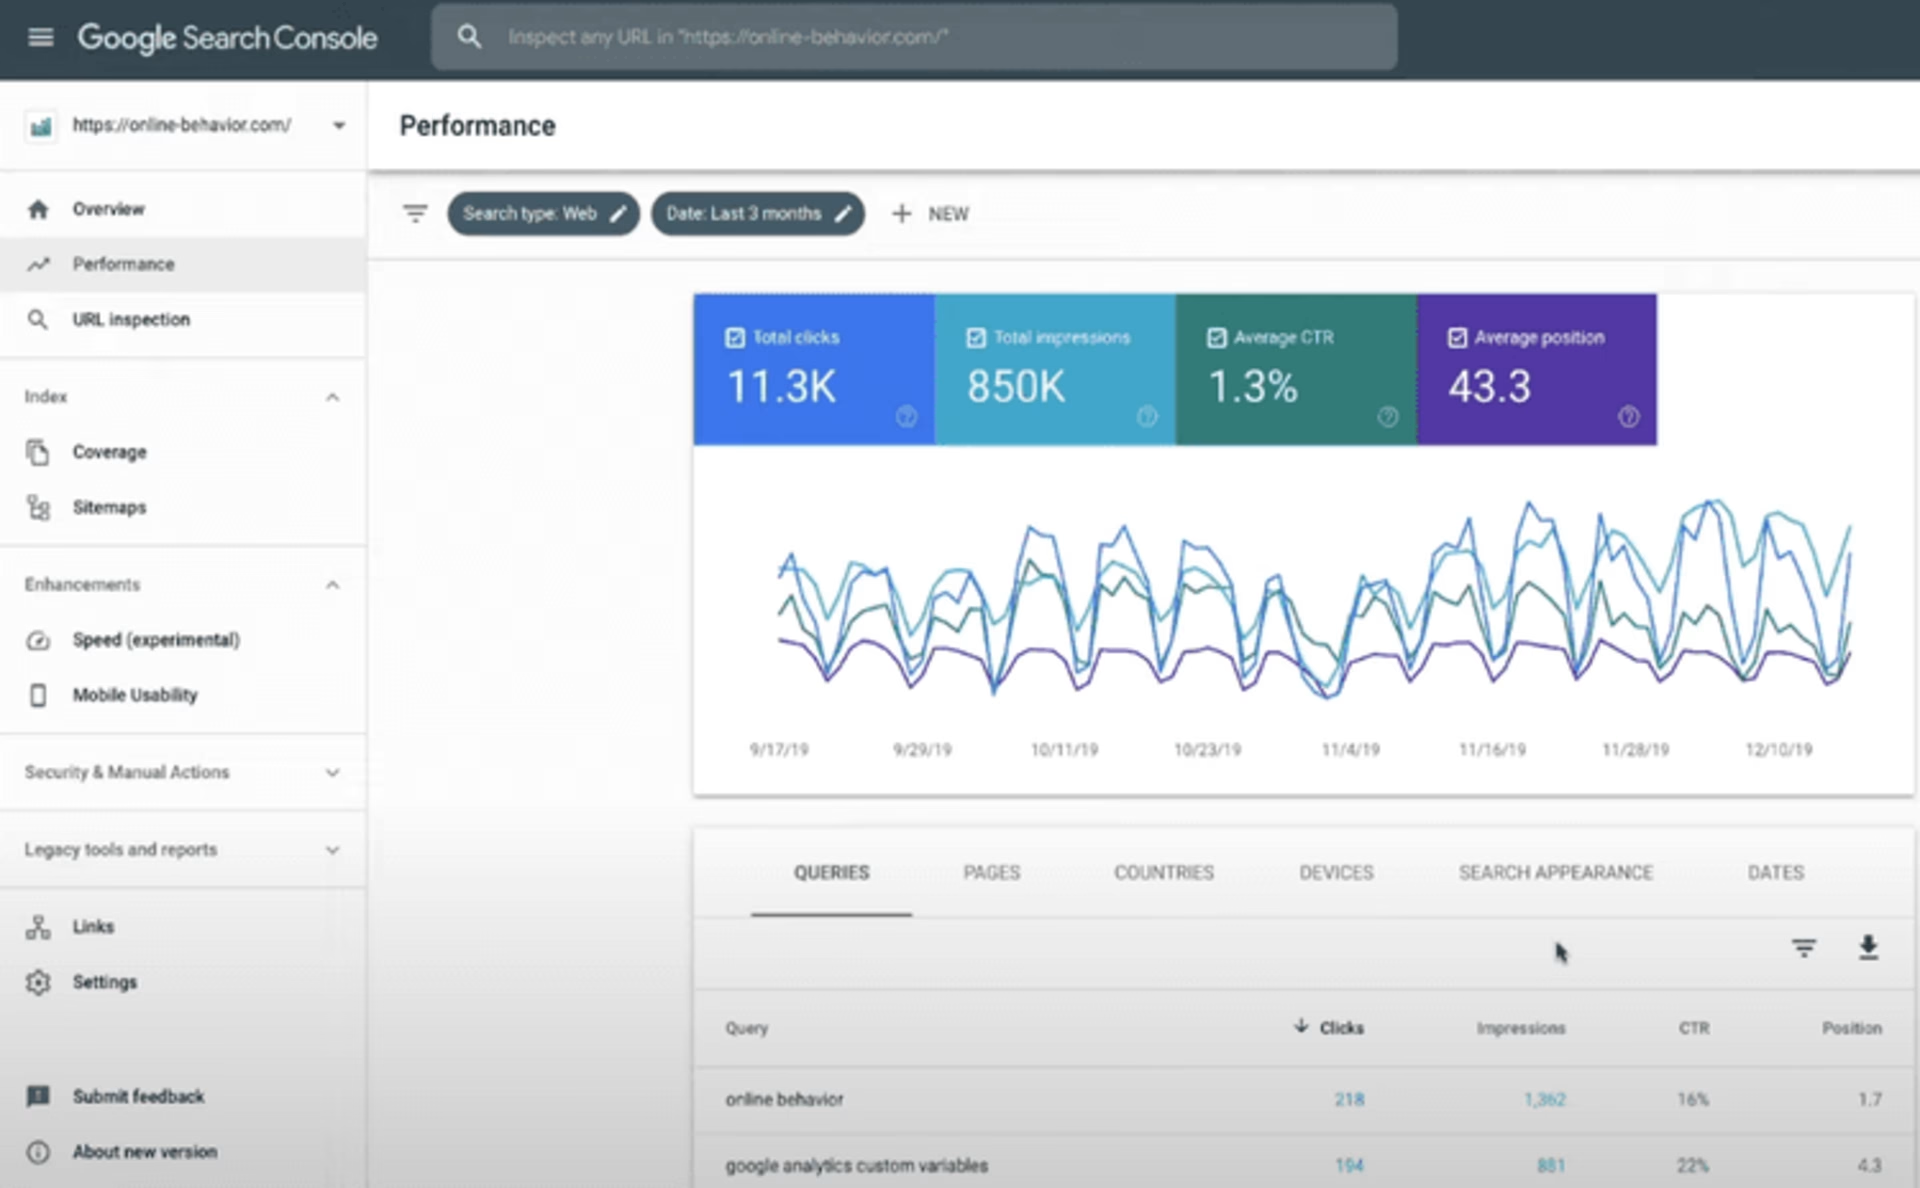
Use Google Search Console to review your site’s CTR
Google says that CTR is not a direct ranking factor. However, NavBoost (a Google algorithm that became mainstream SEO when Google’s documents leaked) suggests that clicks may impact rankings. Google has also confirmed that it uses click data for content evaluation, personalization, and machine learning models like RankBrain.
For example, Gary Illyes, an Analyst on Google’s Search Team, said that Google runs search experiments where it measures how different ranking changes affect user clicks before making updates.
As such, many SEOs believe that CTR is an important user signal and teams should aim to increase clicks from search.
Ways to increase CTR:
Write accurate and enticing meta titles and descriptions
Meet user search intent with your content
Use structured data to make search results stand out (like rich snippets)
2. Dwell time
Dwell time is the amount of time users spend on your web page before heading back to the SERPs, and longer dwell times can signal that your site meets the searcher’s intent and provides a good UX.
Google has never explicitly stated if dwell time improves rankings, but Google’s leaked documents indicate that it tracks the metric. This has led SEO teams to strongly believe that dwell time plays a crucial role in rankings.
Dwell time isn’t a built-in metric you can find in your web analytics tools. But reviewing users’ ‘time on page’ for organic search traffic helps you get a sense of how they engage with certain pages.
![[Visual] contentsquare time spent widget](http://images.ctfassets.net/gwbpo1m641r7/7GLewBEZIcrLNXfWR27K0F/4d5ac9d05b61b9c41f6fe94560001faf/contentsquare_time_spent_widget.png?w=3840&q=100&fit=fill&fm=avif)
You can review time-based metrics like session time and time spent using Contentsquare
Ways to improve site dwell time:
Write valuable content that’s easy to read with clear formatting, bullet points, headings, and visual elements
Simplify your site’s navigation
Add internal links to keep users exploring related content
Pro tip: tools like Contentsquare’s Session Replay help you visualize how users navigate your site and which areas are causing them to leave, contributing to a low dwell time.
And Session Replay Summaries uses AI to analyze user behavior across multiple session replays so you can get instant insights without combing through countless replays.
![[Visual] AI session replay summaries](http://images.ctfassets.net/gwbpo1m641r7/3xrdkhayKftcgj7tXavwVS/bd8b2ea0930743b584316093cd8aab4d/AI_session_replay_summaries.png?w=3840&q=100&fit=fill&fm=avif)
Contentsquare’s Session Replay Summaries give you quick insights on user behavior across your site
3. Bounce rate
Bounce rate, according to Google, is the percentage of people who leave your site within 10 seconds, don’t trigger a conversion event, or don’t click to a new page. And you can view bounce rate in your web analytics platform (like Contentsquare).
![[Visual] contentsquare bounce rate](http://images.ctfassets.net/gwbpo1m641r7/4yErcggF5pQM3JCoEdDOJ6/97f6e90c26db254e409b3f6cfb13bdf6/contentsquare_bounce_rate__1_.png?w=3840&q=100&fit=fill&fm=avif)
Web analytics tools typically show your site’s bounce rate overall and broken up by individual pages
Again, SEO professionals debate whether bounce rate is a user signal that affects rankings. On the one hand, Google says bounce rate is not a ranking factor. However, research by Semrush uncovered a correlation between rankings and bounce rate.
Regardless of whether Google considers bounce rate a ranking factor, a high bounce rate (typically over 50%) indicates user frustration and you should look to improve it.
Ways to reduce bounce rate:
Ensure your site loads quickly
Fix poor UX elements, such as confusing navigation or broken links
Provide relevant, helpful content that aligns with what users are searching for
Ensure your site works smoothly across all devices and screen sizes
Pro tip: knowing your bounce rate percentage isn't going to help much unless you understand why people are leaving your site. Here’s what to do.
Use Contentsquare’s Frustration Score to surface errors causing people to leave your site. Frustration Score also ranks each error with AI-based user frustration scores, so you can decide which ones to fix first.
If high-bounce pages are error-free, ask users why they’re leaving with Contentsquare Surveys. Surveys help you identify user pain points that may be driving potential customers away.

Use Contentsquare Surveys to find out why people hit the back button
3 critical user interactions to monitor to go beyond SEO
If you only review user signals that may impact rankings, you miss out on important user interaction data you can use to improve your site’s overall experience, which helps you inadvertently boost your SEO.
For example, you might decide to focus on creating high-quality content to improve bounce rate, which helps you attract more backlinks—a confirmed ranking factor.
Here are 3 important user interaction metrics to track.
1. Scroll depth
Scroll depth measures how far down your pages users scroll. People who don’t scroll down your pages are likely missing key content, aren’t engaged with your site, and are more likely to bounce.
Heatmaps aggregate scroll depth data to give you a visual of how far users scroll. Review your heatmaps with a platform like Contentsquare to ensure important content sits within the ‘hot’ portion of your heatmap (shown in red). Pair heatmaps with other tools like surveys or session recordings to hypothesize why users aren’t scrolling far (and what you need to do to fix it).
![[Visual] heatmap](http://images.ctfassets.net/gwbpo1m641r7/1scwcfVwTomloyqJ3ZYDZM/b618e3e3f0dd8d59cbb9ccc27a8a77f4/heatmap.png?w=3840&q=100&fit=fill&fm=avif)
View popular areas of your site and ensure users aren’t missing any important info in the ‘cold’ areas (indicated by blue)
Ways to improve scroll depth:
Use clear, engaging subheadings to guide users through content
Break up text with visuals, bullet points, and short paragraphs
Test different layouts and formats to see what keeps users scrolling
2. Pages per session
Pages per session measures how many pages, on average, a user visits in a single session, and you can find this metric within your web analytics. A higher number often means users are finding value in your content and are motivated to explore more of your site.
But pages per session on its own doesn’t tell the whole story. You might know how many pages people visit, but you don’t quite know the paths users take from start to finish. For that, you need a tool that helps you map and track the customer journey, like Contentsquare’s Journey Analysis.
Journey Analysis lets you visualize how users navigate your site by highlighting common paths, including where people drop off, so you can spot points causing user friction. It also lets you dig into pages with high exit rates to hypothesize what might be stopping users from continuing. Are they confused? Missing key info? Fixing these issues encourages deeper exploration and helps boost your pages per session.
![[Customer Story] [Clarins] Journey Analysis](http://images.ctfassets.net/gwbpo1m641r7/4nozxbnvlcRqDnxYjbPNnm/707c4b2a2c0c36077eb336538bb1098c/Complex.svg?w=1920&q=100&fit=fill)
Journey Analysis provides more context behind metrics like ‘pages per session’
Ways to increase session depth:
Use strong internal linking/navigation to direct users to related content
Design intuitive navigation and search functionality
Optimize content to match user intent
3. Conversion rate
Conversion rate measures how often users complete a desired action, such as signing up for a newsletter, making a purchase, or submitting a form.
Use your web analytics tools to pinpoint areas of your site with low conversions and review session replays and heatmaps to understand what blocks users from taking action.
Ways to improve conversion rates:
Simplify forms and reduce unnecessary steps using Contentsquare's Form Analysis
Replace basic CTAs like ‘Sign Up’ with more compelling ones like ‘Book Your Free Consultation’
A/B test different layouts, copy, and offers
Pro tip: use Contentsquare Heatmaps during your A/B testing efforts to dig deeper into each variant and understand why one outperforms the other.
![[Visual] ab test heatmaps](http://images.ctfassets.net/gwbpo1m641r7/71Feljv3nwR0ng3PEiPGEG/c5c4f991ef679e660e08970edb2a894a/ab_test_heatmaps.png?w=3840&q=100&fit=fill&fm=avif)
Heatmaps on your control and variant reveal which areas users pay attention to—and which ones they ignore
Share your insights with other teams so they can optimize conversion rates for other pages—for example, your marketing team may want to increase conversions on product pages.
Finding and fixing site issues
The key to making users and search engines love your site starts with fixing errors that negatively impact UX.
Look at pages with high bounce rates, low conversion rates, and minimal scroll depth, so you can start identifying why users aren’t interacting with your site like they should be.
FAQs about user signals
User signals are metrics that tell search engines how users behave on your site after clicking it within the search results. They show whether users find your website valuable for the query they searched.
![[Visual] Contentsquare's Content Team](http://images.ctfassets.net/gwbpo1m641r7/3IVEUbRzFIoC9mf5EJ2qHY/f25ccd2131dfd63f5c63b5b92cc4ba20/Copy_of_Copy_of_BLOG-icp-8117438.jpeg?w=1920&q=100&fit=fill&fm=avif)