![[visual][Ecommerce analytics] Tools](http://images.ctfassets.net/gwbpo1m641r7/1QIREJa6WCXWftNzRbYGYb/da9e0c9501f2a7abdae07b76209f4d8c/pexels-diva-plavalaguna-6147360.jpg?w=3840&q=100&fit=fill&fm=avif)
The right ecommerce analytics tools help you make data-driven decisions to optimize your ecommerce business and drive sustainable growth. But with so many choices, where should you begin?
If you’re setting out to conduct ecommerce website analysis and have found yourself drowning in tool options, you’re in the right place. This guide takes you through 8 popular (and user-friendly) ecommerce analytics tools, platforms, and software. Discover how these tools benefit your ecommerce store, and set yourself on the path to actionable insights that increase conversions and sales.
8 best ecommerce analytics tools for every budget
Here are 8 popular, easy-to-use ecommerce analytics tools, priced from free to enterprise-level.
Remember: you don’t need to use them all. Pick a couple of tools that generate a mix of quantitative data (like traffic numbers and sales totals) and qualitative data (like customer feedback responses) across the customer journey to get a complete view of what’s happening on your ecommerce website.
1. Google Analytics (G4A)
Google Analytics (GA) is by far the most popular ecommerce analytics tool, used on around 31 million websites. GA4, Google’s latest analytics version, is free—but data sampling kicks in from over 500,000 sessions.
💰 Use Google Analytics to grow your ecommerce store by
Measuring traffic source and volume to see if your marketing strategy is working
Measuring customer engagement and bounce rates to see where visitors drop out of the funnel
Tracking ecommerce metrics like LTV and conversion events
Google Analytics alternatives include
Contentsquare: an experience intelligence platform offering deep insights into user behavior and friction points to optimize digital journeys
Fathom: a simple, cookieless, privacy-focused ecommerce analytics tool
Adobe Analytics: an advanced analytics and business intelligence platform
💡Pro tip: Google Analytics carries somewhat of a learning curve when it comes to configuration (check out our GA glossary to make the most of its features), and the data only shows you what happens on your store (e.g. where visitors bounce)—you're still left wondering why. Instead of guessing why these actions happen, use Contentsquare’s suite of quantitative and qualitative features and get a front-row seat to the real behavior behind the numbers.
2. Contentsquare
Contentsquare (👋 hello!) is the all-in-one experience intelligence platform used on over 1.3 million websites worldwide. Our flexible and scalable platform brings together 4 powerful analytics domains to give you a deep understanding of your customers’ whole online journey.
Experience Analytics: get a visual breakdown of how shoppers interact with your site, from clicks to scrolls, so you can optimize key elements that drive conversions
Product Analytics: dive into user flows and identify which features or pages are making an impact—and which need a little more attention
Voice of Customer: collect real-time feedback from shoppers to uncover their frustrations, needs, and what keeps them coming back
Experience Monitoring: stay on top of your site’s performance, spotting slowdowns or errors in real-time to ensure a smooth shopping experience for every customer
![[Visual] Dashboard conversion and bounce rate](http://images.ctfassets.net/gwbpo1m641r7/3F2OzaDIkGuM3m2tO3lV01/2514a7af51bc3524d9644f3f61ba86da/platform-overview-dashboard.svg?w=3840&q=100&fit=fill)
Contentsquare helps you drive engagement, conversion, and retention across your online store, with a complete understanding of your customer experience
💰 Use Contentsquare to grow your ecommerce store by
Generating heatmaps to visualize where customers click (or don’t): are they missing important CTAs?
Viewing session recordings to see why visitors bounce from product pages or the shopping cart: are they rage-clicking on broken elements?
Running a customer satisfaction survey (CSAT) to measure how happy customers are with their purchase experience and identify areas for improvement: does your business excel at customer retention and loyalty?
Contentsquare alternatives include
Glassbox: session replay and experience analytics for identifying friction points in real-time and driving optimization
CrazyEgg: heatmaps, session recordings, surveys, and A/B testing to improve user engagement
Amplitude: product analytics to understand user behavior, track feature adoption, and drive retention with cohort and funnel analysis
3. Shopify Analytics
Shopify Analytics is the built-in ecommerce tool available to all 4.9 million Shopify stores. Shopify Basic users can access most Shopify Analytics reports for free; advanced and custom reports are only available on higher pricing tiers.
💰 Use Shopify Analytics to grow your ecommerce store by
Monitoring quantitative ecommerce metrics like store sessions (i.e. traffic), online store conversion rate, average order value, and returning customer rate
Comparing the performance of different sales channels, including in-person if you use the Shopify Point of Sale (POS) app
Analyzing where visitors are coming from by region or social media source
Shopify alternatives include
Better Reports: premium Shopify app for advanced reporting
Analyzify: premium Shopify app to integrate Google Analytics, Tag Manager, and Google Ads
💡Pro tip: extend the functionality of Shopify’s analytics data by tracking the confirmation page with Contentsquare. You can identify sessions from users who made a purchase on your Shopify store and study their behavior. Which elements were they engaging with? Which were they not?
You’ll get more valuable insights by combining traditional analytics with user behavior data. Contentsquare’s Heatmaps capability, for example, helps you understand engagement metrics with accessible data visualizations that bring quantitative data to life.
Want to know why a page with a lot of traffic doesn’t convert? Use click and scroll maps to discover what makes people leave before buying, like when customers miss out on a key CTA that’s placed too far down the page.
![[Visual] heatmaps back into action](http://images.ctfassets.net/gwbpo1m641r7/1IqiRyF8JXAyYNnXT3LMyQ/32815c373967d53f2e9e84f400e23830/CSQ-heatmaps.png?w=3840&q=100&fit=fill&fm=avif)
Engagements recorded using Contentsquare Heatmaps
4. WooCommerce Analytics
WooCommerce Analytics is the free, open-source reporting and data analysis tool for over 6 million WordPress websites that use WooCommerce to power their ecommerce platforms. Its functionality is limited to sales analytics, but the tool is easy to customize, and reports can be viewed within the WordPress dashboard.
💰 Use WooCommerce Analytics to grow your ecommerce store by
Viewing and downloading basic reports on your store’s products, revenue, coupons, taxes, and stock levels
Customizing the dashboard to show your most important metrics at a glance
Applying advanced filters to find your most valuable segments
WooCommerce alternatives include
WooCommerce Google Analytics: free plugin extension to integrate GA with WooCommerce
MonsterInsights: Google Analytics plugin for WordPress
💡Pro tip: watching how shoppers navigate your store and collecting feedback from happy (and not-so-happy) customers helps you fix issues and deliver a better user experience for future visitors.
Contentsquare’s Session Replay is effective for revealing customers’ online shopping patterns and other insights into how they engage with your site, beyond isolated sale numbers. Watching your customers as they browse lets you avoid guesswork and gain concrete answers by capturing the real-time interactions of people browsing for products and buying them, or ultimately exiting your site before purchasing.
Harrods did exactly that, achieving significant improvements in their checkout journey—they discovered through session recordings that many users were rage-clicking on the “First Name” field during checkout. After reviewing sessions, they realized customers were confused by an unclear error message. Updating the error copy to clarify acceptable inputs led to a 50% reduction in rage clicks within two months.
![[Visual] The UX issue on Harrods’ checkout page](http://images.ctfassets.net/gwbpo1m641r7/39OTbyicaPS9Ic5j9oowuA/4a9e5ff70bc85c0ef853f24ae4d0f311/harrods_error.png?w=3840&q=100&fit=fill&fm=avif)
Harrods error message before optimization
5. Mixpanel
Mixpanel is a data analytics platform with a free plan for up to 20 million monthly events. Mixpanel collects data on every customer touchpoint with your ecommerce business and integrates with data from other sources so you can analyze all of your store’s metrics in one place.
💰 Use Mixpanel to grow your ecommerce store by
Visualizing product analytics and customer insights with customizable and interactive reports
Tracking ecommerce metrics and KPIs, like product views and add-to-cart conversions
Building custom funnels to identify drop-offs and optimize conversions
Mixpanel alternatives include
Contentsquare: an experience intelligence platform offering advanced product analytics to understand feature adoption and complete user journeys
Glassbox: digital customer experience analytics for tracking real-time user interactions
Amplitude: a product-focused analytics tool designed for insights into user behaviors and trends
💡Pro tip: get actionable insights from your data by choosing what works best for your team and goals.
1. Use Mixpanel and Contentsquare together
With this setup, you can access Contentsquare Session Replay directly from Mixpanel to see what users were doing when a specific event occurred. This lets you combine Mixpanel’s analytical data with Contentsquare’s behavioral insights to uncover and prioritize high-impact issues.
However, toggling between platforms can be time-consuming and may complicate workflows, especially when you need to align teams on findings or investigate further in Mixpanel.
2. Streamline everything with Contentsquare’s unified platform
By using Contentsquare Product Analytics alongside our other capabilities like Session Replay, User Feedback, Error Analysis, and Experience Monitoring, you can track, analyze, and act on both product usage data and behavioral insights—all in one place.
Here’s why this matters
Save time by avoiding the need to switch between tools
Get faster, more cohesive insights across the entire user journey
Enable cross-team collaboration with one unified dataset

Contentsquare’s real-time alerts bring you up to speed with new issues on your online store so you can fix them fast
6. Woopra
Woopra is an advanced customer journey and ecommerce analytics software with a free plan for tracking up to 500,000 actions/month. Woopra collects data on every customer interaction with your store.
💰 Use Woopra to grow your ecommerce store by
Analyzing the customer journey (from marketing channel to conversion) to identify areas for improvement
Measuring trends and segmenting data to find valuable cohorts
Building real-time customer profiles across all touchpoints—including email campaigns, mobile app, and live chat—to find your most engaged customers
Woopra alternatives include
7. Kissmetrics
Kissmetrics is a premium analytics solution designed for online businesses generating between $500,000 and $5M in monthly sales. Prices start at $299/month, and, like Woopra and Mixpanel, Kissmetrics tracks customer-specific data so you can view actions by individual customers.
💰 Use Kissmetrics to grow your ecommerce store by
Viewing your key store metrics at a glance (e.g. total sales, AOV, cart to purchase conversion rate)
Segmenting data into cohorts to find what big spenders have in common and how you acquired them
Analyzing the sales funnel to find drop-off points in the checkout process
Kissmetrics alternatives include
Contentsquare Product Analytics: experience intelligence platform for multi-session journeys
Acoustic Insights: digital marketing experience analytics
Qualtrics: experience management software
💡Pro tip: use Contentsquare Funnel Analysis to track your ecommerce conversion funnels. With this feature, the quantitative funnel data you collect is seamlessly paired with qualitative insights from other tools in the Contentsquare suite.
Want to know why users drop off before completing a purchase? Pair funnel data with insights from tools like Session Replay to see exactly where the friction is, whether it’s confusing navigation or a distracting error message.
If boosting conversions is your goal, Funnel Analysis lets you track drop-offs, identify trends, and compare funnels across traffic sources or customer segments. You’ll uncover which channels drive high-converting visitors and where to focus your energy for maximum impact.
Our goal is to get you actionable insights that help you cut through the noise, fix what matters, and make the buying process smoother for your customers.

Funnel analysis in Contentsquare showing comparisons across funnel views
8. Glew
Glew is all-in-one multichannel ecommerce analytics software with a free plan to track up to 20 metrics. Glew collects ecommerce customer analytics data so you can view how individual customers browse, shop, and react to marketing messages.
💰 Use Glew to grow your ecommerce store by
Tracking ecommerce KPIs and metrics (like LTV and shopping cart abandonment rate) to monitor progress
Analyzing user behavior to find profitable segments and see how specific customers interact with your store over time
Measuring the performance of customer acquisition channels to determine the ROI of your marketing efforts
Glew alternatives include
Adobe Customer Journey Analytics: cross-channel customer insights
DemandJump: marketing analytics platform to analyze SEO and marketing strategies
💡Pro tip: a particularly rewarding way to improve the ecommerce customer experience (and boost conversions) is to analyze the customer data you collect with tools like Glew alongside user behavior insights gathered by surveys and interviews—after all, your customers know more about shopping on your online store than you do.
With Contentsquare’s Surveys capability, you can poll segmented visitor groups and collect feedback centered around specific objectives such as traffic attribution, cart abandonment, or exit intent.
Take things a step further by conducting user interviews with key customer segments—speak to your own customers or explore new leads with users from our diverse pool of 200,000+ participants from 130+ countries and 25 industries. Hearing what customers have to say, whether it’s written or spoken feedback, is guaranteed to uncover new shop features or product ideas you never thought of.
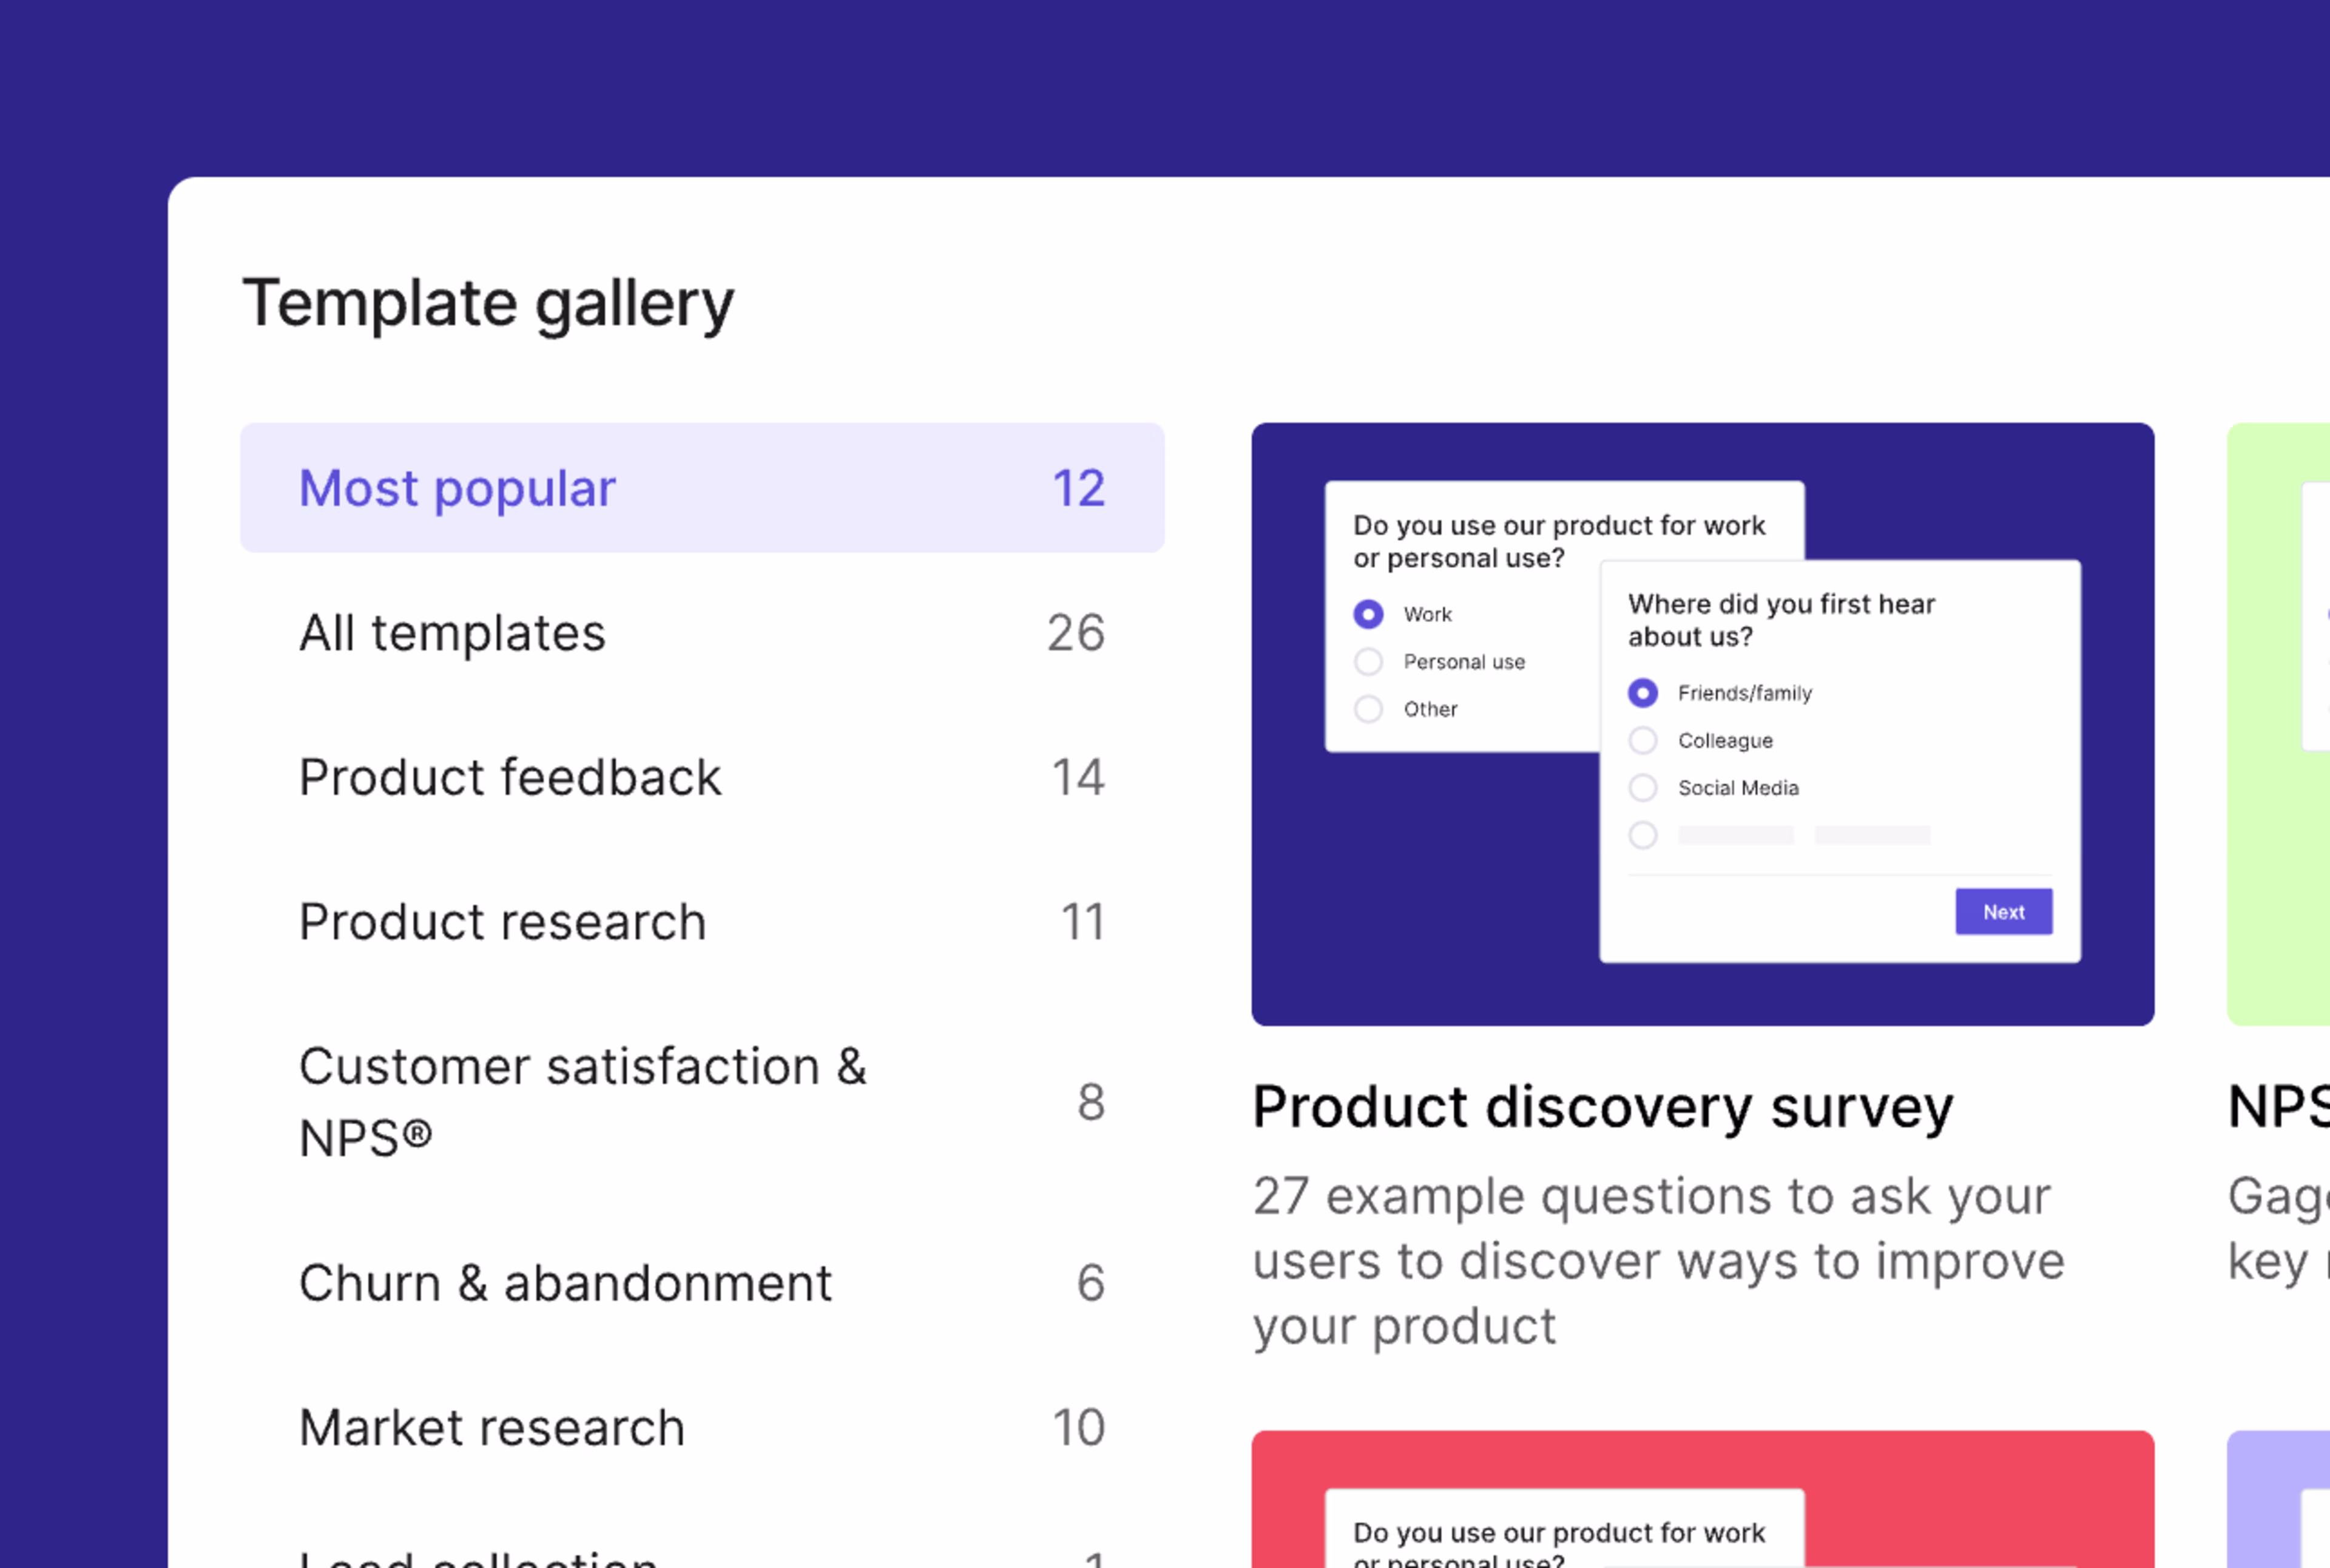
Understand what stops visitors from converting with an exit intent survey from our template gallery
Go beyond traditional ecommerce analytics
You can generate as many colorful charts as you like, but numbers on their own will never speak to you like real customers do. There’s no substitute for reading genuine visitor feedback or watching a user session where a customer struggles to make a purchase.
That’s why we recommend using a platform that pairs quantitative analytics data with visual and qualitative insights to get a full view of the what and the why behind customer behavior in your store. Use the practical examples we present in the pro tips throughout this chapter to inspire you and get the most out of ecommerce analytics.
Ecommerce analytics tools FAQs
Ecommerce analytics tools help you collect, visualize, and analyze information about your store’s performance. This includes website traffic, clicks, conversion rate, sales data, and customer feedback. Use the data you track from analytics tools on your ecommerce site to
Understand how customers interact with your store to identify (and solve) issues and spark A/B testing ideas to improve conversions.
Track metrics and key performance indicators (KPIs) like conversion rate (CVR), average order value (AOV), and customer lifetime value (LTV).
Measure the ROI of your ecommerce marketing campaigns so you can allocate resources more effectively in the future.
![[Visual] Contentsquare's Content Team](http://images.ctfassets.net/gwbpo1m641r7/3IVEUbRzFIoC9mf5EJ2qHY/f25ccd2131dfd63f5c63b5b92cc4ba20/Copy_of_Copy_of_BLOG-icp-8117438.jpeg?w=1920&q=100&fit=fill&fm=avif)