We’ve all been there: waiting for a page to load, watching the spinner spin, and finally giving up in frustration. For your users, every second of delay feels like an eternity—and could mean the difference between a conversion and a bounce.
That’s where digital experience monitoring (DEM) metrics come in. They let you measure and analyze how your website or application performance affects user behavior.
But with dozens of possible metrics, it’s easy to get lost in a sea of numbers—and determine what’s important when making decisions to improve the user experience.
In this article, we give you the top 7 metrics you need to track to reveal actionable insights about your website’s or app’s performance, behavior, and engagement. Discover which numbers deserve your attention—and how to use them to improve performance issues.
Key insights
Digital experience monitoring metrics paint a clear picture of how users interact with your site or mobile app. Track these essential numbers to
Improve user satisfaction: identify and fix issues that frustrate visitors before they abandon your page
Make data-driven decisions: understand how users experience your site so you can focus on the changes that matter most
Rise in the search rankings: aim for Google’s recommended benchmarks for Core Web Vitals to boost search visibility and performance
7 digital experience monitoring metrics to identify and fix performance issues
Want to ensure your website or web applications deliver a great customer experience? Need to monitor the outcomes of your DEM strategy?
Start by tracking and troubleshooting these 7 key performance indicators (KPIs). They help you identify issues early, understand how users interact with your site, and make improvements that really matter to your visitors.
1. Bounce rate
Bounce rate shows how many visitors leave your site after viewing a single page, without clicking further or exploring more content. Think of it as a first impression metric—do users stick around to learn more, or quickly hit the back button? In digital experience monitoring, bounce rate works as an early warning system. By tracking when and where users drop off, you can identify problems like
Slow-loading pages
Confusing layouts
Content that doesn’t fulfill user expectations
Then, you can take action to improve the user journey. The result? More engaged visitors, higher conversion rates, and a stronger digital presence. 💪
🤔 Did you know? Contentsquare’s Benchmarks feature lets you see how you stack up against the competition. It highlights the gap between you and your competitors for each metric and charts your growth against your competitors’ over time.
![[Visual] Contentsquare-Benchmarks](http://images.ctfassets.net/gwbpo1m641r7/5ayw5ut4o4Rzqf18W6LDmk/b6f5b64c0a51544c2ab8ac10a2ce87b5/1-Contentsquare-Benchmarks.png?w=3840&q=100&fit=fill&fm=avif)
Use Contentsquare Benchmarks to see how your metrics compare with your competitors’
2. Session duration
Session duration reveals how long users spend on your site or app during a single visit. It’s a good gauge of how well your content holds users' attention—do they dive deep into your text and videos or scan quickly before exiting? As a DEM metric, session duration measures the quality of user engagement. By analyzing how long users stick around, you discover
Your most engaging pages
The types of content users find useful or valuable
Pages that frustrate users
Navigation issues that cause early exits
Understanding these patterns helps you optimize your digital experience and create content that keeps users engaged—leading to better business outcomes and more customer satisfaction.
💡 Pro tip: use Contentsquare’s Headlines feature to get an overview of metrics like session time, bounce rate, error rate, and more. Updated weekly with custom analysis recommendations, Headlines ensures you find out what’s going on with your site fast! Do you spend most of your day working through email? Use ‘Email settings’ to get these updates sent to your inbox each week.
![[Visual] session information](http://images.ctfassets.net/gwbpo1m641r7/PByOhhWWc0RAMQV7WKhdU/3c586e708a90536a4dd03d41dec83f75/2-Contentsquare-Headline.png?w=3840&q=100&fit=fill&fm=avif)
Click ‘Learn more’ under each metric in Contentsquare Headlines to get root-cause assumptions and recommendations
3. Error rate
Error rate tracks how often users encounter problems on your site or app, from broken links to failed page loads. An error rate is like a reliability score, showing whether users sail smoothly through your content or hit roadblocks along the way.
Monitoring errors lets you spot critical issues like
API, JavaScript, and custom errors that prevent users from completing tasks
Server problems that cause slowdowns or service disruptions
Failed page loads that interrupt the customer journey
Tracking these issues helps you maintain a smooth digital experience. The result? Happier users who accomplish their goals without frustration.
💡 Pro tip: use Contentsquare’s Error Analysis tool to find and fix your most critical technical and non-technical errors. When you spot an issue, jump straight into the relevant session replays. Watch a recording of your user’s session to spot any bugs or error messages that pop up on their screen. Then, with one click, file a Jira ticket to get the issue resolved asap.
![[Visual] Error analysis jump into recordings](http://images.ctfassets.net/gwbpo1m641r7/38KOJcd15EdmN2j1mmc1aZ/834278427bf1b97fc32e7df3a3b8a405/Error_analysis_jump_into_recordings.png?w=3840&q=100&fit=fill&fm=avif)
Jump from Error Analysis right into Session Replay to see what happened from your user’s perspective
4. Page load speed
Page load speed measures how quickly your site springs into action when users arrive. Long load times irritate your visitors—and cause them to head to another site instead.
What’s a ‘good’ page load speed? Digital marketing agency Portent says that ecommerce companies should aim for a web page load time of 1–2 seconds to improve transaction conversions.
Users aren’t much more patient on the go. Statista reports that only 26% of people will wait more than 5 seconds on mobile before leaving.
Tracking load times lets you identify performance factors like
Big images or scripts that cause slow-downs
Server response times that keep users waiting
Mobile performance issues that frustrate people on the go
Resource bottlenecks needing website optimization
Monitoring these metrics helps you deliver the swift, smooth experience users expect. By responding quickly to any issues that arise, you’ll see lower bounce rates and more satisfied visitors. (You may also get a boost in search engine rankings. As one of Google’s Core Web Vitals, page load speed is a signal of good end-user experience, which contributes to ranking.
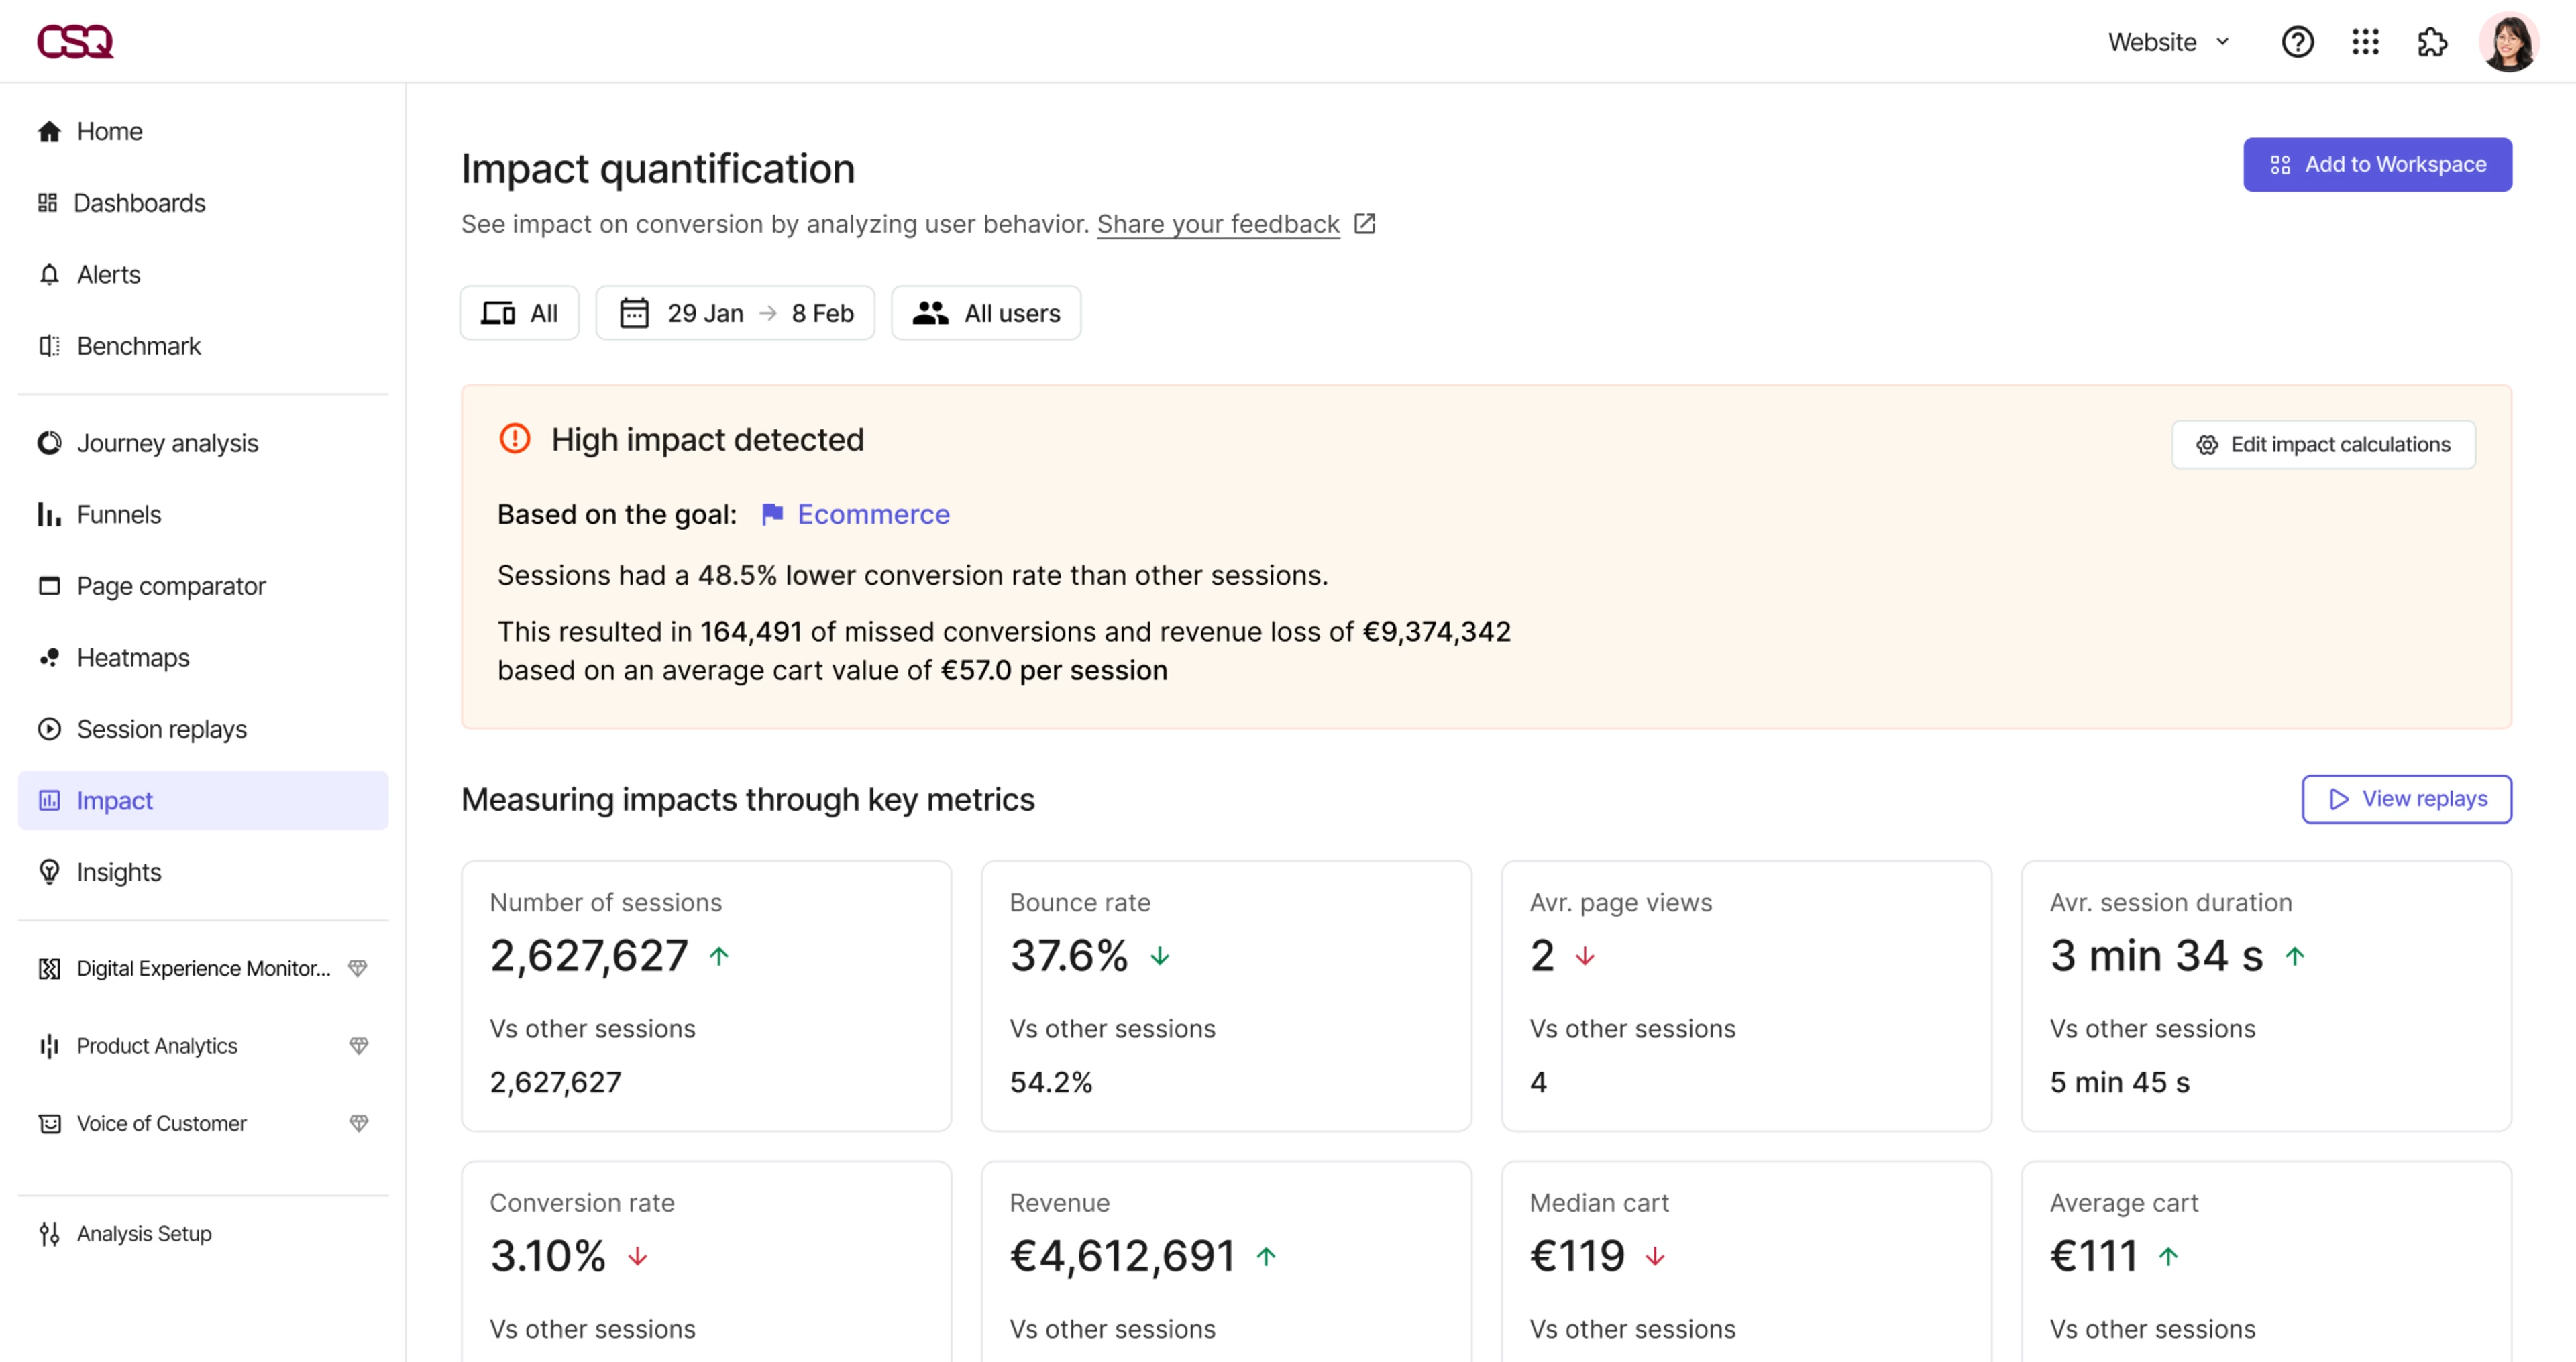
🤔 Did you know? Contentsquare’s Impact Quantification tool helps you understand the impact of good and bad digital experiences. See how many customers experience a specific event or issue—like an API error or a page load speed of 5 seconds or more—and discover how it impacts your conversions and revenue. Then, focus your resources on tasks with the highest impact.

With one click, discover how pages and page elements affect conversions—and your bottom line
5. Largest Contentful Paint (LCP)
Largest Contentful Paint (LCP) shows how quickly your page’s main content, such as a hero image or headline, becomes visible to visitors. It only takes into account items ‘above the fold’ that can be seen without scrolling.
LCP is important in website monitoring because it’s a key factor in overall page load speed. For optimal user experience, Google recommends that LCP—one of the Core Web Vitals—occur within 2.5 seconds.
Monitoring LCP in real time lets you identify which factors slow down your main content, such as
Large, unoptimized images that take a long time to load
Server response delays that affect content delivery
Resources that prevent image rendering, keeping users waiting
Tracking these elements ensures users see the most important elements on your page—fast—helping you reduce user frustration and bounce rates.
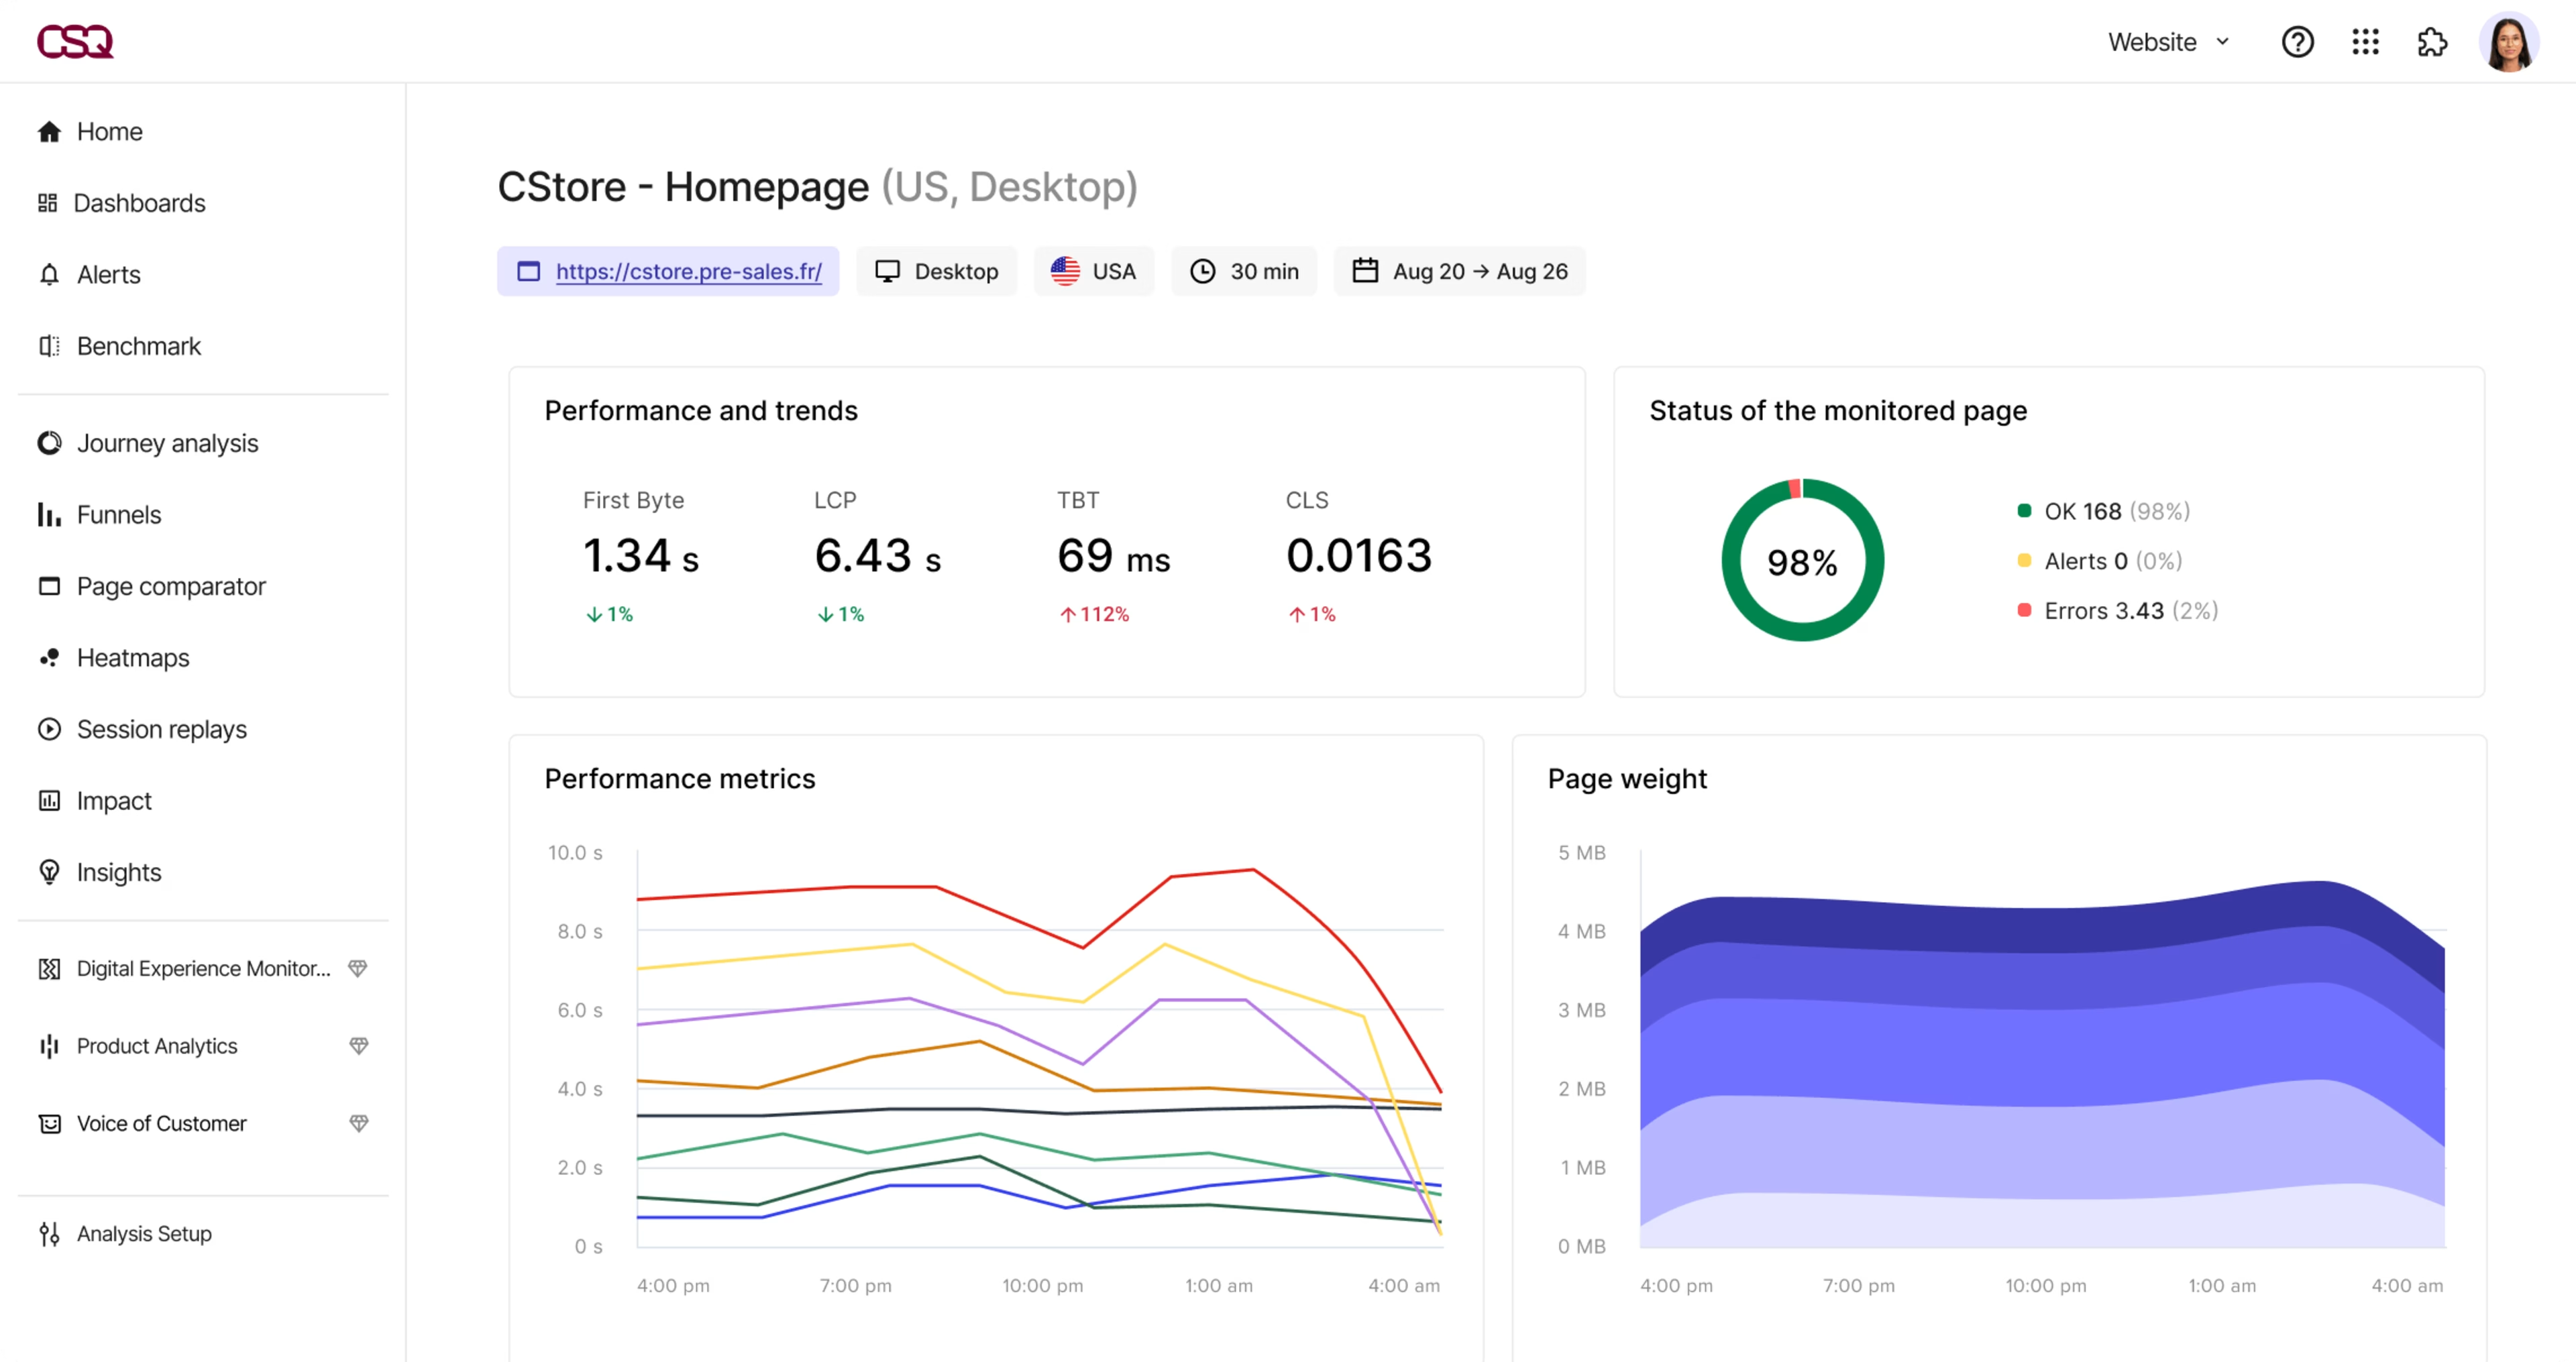
🤔 Did you know? Contentsquare’s Speed Analysis allows you to monitor Core Web Vitals like LCP at a glance. See a quick snapshot of your key metrics, or dive deep into performance data charts to understand how your pages load and find opportunities for optimization.

Track your performance metrics in an organized, visually appealing way with Contentsquare
6. Interaction to Next Paint (INP)
Interaction to Next Paint (INP) measures how quickly your site responds to user actions like clicks, taps, and swipes. Think of it as your site’s reflexes—when users interact with your page, does it hesitate or react instantly?
Like Largest Contentful Paint, INP is a Core Web Vital that affects your search engine result page (SERP) ranking. Google recommends you keep your INP under 200 milliseconds for the best user experience.
By tracking INP you identify latency issues that slow down your site’s responsiveness, like
Long-running JavaScript tasks
A large document object model (DOM), or programming interface that represents your web page’s structure
Big media files or complex animation
Monitoring INP helps you create a more fluid experience, so users feel in control and engaged—and more satisfied with your site or app.
💡 Pro tip: use Contentsquare’s AI Alerts feature to stay on top of your metrics without staying glued to your dashboard. Get smart alerts and recommendations sent straight to your email or a designated Slack channel, so you know the moment your KPIs go up or down.
![[Visual] AI alert](http://images.ctfassets.net/gwbpo1m641r7/6B7s9WebREBOMHkqKx9DH0/dca8abb73291d94bee2e7c7b8eca9127/6-AI_alert.png?w=1920&q=100&fit=fill&fm=avif)
Customize your AI alerts so you get the exact information you need sent where you’re sure to see it fast
7. Cumulative Layout Shift (CLS)
Cumulative Layout Shift (CLS) tracks how much your page elements jump around while loading. It serves as your site’s stability indicator.
If you’ve ever accidentally clicked on a button or an ad because the page loaded in an unexpected way, you know how frustrating big shifts can be. As a result, you want to keep this Core Web Vital at a score of 0.1 or lower.
Monitoring CLS helps you spot common causes of layout shifts like
Images that get resized, moving content as they load
Ads without specified dimensions in the DOM
Dynamic content that loads after the page renders
Issues loading or rendering fonts
Tracking layout shifts lets you deliver a more consistent experience that aligns with users’ expectations. That allows users to navigate your site with ease, free from the frustration of the dreaded misclick.
💡 Pro tip: choose a DEM tool that offers synthetic monitoring in addition to real user monitoring (like Contentsquare 👋) to stay on top of Cumulative Layout Shift changes. With synthetic monitoring, bots periodically test the availability of key pages and workflows across your digital platforms—so you can catch issues before they become problems for real customers. With Contentsquare, this includes reliable digital experience monitoring for mobile, and for users logging on from around the world.
Use synthetic monitoring to check your website or application performance with Contentsquare
Make your metrics matter
These 7 key digital experience monitoring metrics give you a comprehensive view of user interactions with your site or app. Each metric reveals a different aspect of performance, user behavior, or engagement, so you can improve the user journey at every touchpoint, from first impression to final click.
But metrics are only valuable if you act on them. Regular monitoring with a DEM tool helps you spot trends, identify problems early, and make data-driven improvements.
An all-in-one platform like Contentsquare has the digital experience monitoring features and functionalities you need to create an experience your users genuinely enjoy. Plus, it includes product analytics to track multi-session journeys, voice-of-customer tools to get fast feedback, and experience analytics to visualize journeys and improve engagement.
FAQs on digital experience monitoring metrics
Digital experience monitoring metrics are numbers that show how users interact with and experience your website or app. Used by your product, DevOps, IT team—or anyone involved in application performance monitoring (APM) and website tracking—these metrics let you keep an eye on everything from how quickly your pages load to how stable your content is while loading.
![[Visual][FR][Guide] session replay home page](http://images.ctfassets.net/gwbpo1m641r7/1vxDyYRYc5QIcs9mQMhpFu/0d9cccc338ef8f0a4261a5e6489946ff/enregistrements-de-sessions-guide.jpeg?w=3840&q=100&fit=fill&fm=avif)
![[Visual] Contentsquare's Content Team](http://images.ctfassets.net/gwbpo1m641r7/3IVEUbRzFIoC9mf5EJ2qHY/f25ccd2131dfd63f5c63b5b92cc4ba20/Copy_of_Copy_of_BLOG-icp-8117438.jpeg?w=1920&q=100&fit=fill&fm=avif)