![[Visual] marketing performance reporting stock image](http://images.ctfassets.net/gwbpo1m641r7/2EYox1jM4ycSX3VVuHZy0V/0104c7e83e34a8a9bb3263dfe0288842/AdobeStock_553721043.png?w=3840&q=100&fit=fill&fm=avif)
When every team relies on its own isolated data, are decisions truly data-driven—or are they just rolling the dice?
That’s the reality of data silos. Without the full picture, teams are guessing the parts they can’t clearly see. But assumptions don’t make for strong collaborations or steadfast decisions—and customers often feel the ripple effects of mixed messages and disjointed digital journeys.
Don’t leave the outcomes to chance. This guide outlines 5 practical strategies to eliminate data silos and inefficiencies, making it easier for all teams to access complete and consistent data, and turn it into real impact.
Key insights
Data silos are problematic because they establish incomplete and isolated data, which leads to inefficient collaboration, poor decision-making, a lack of data access, and negative customer experience
Breaking down data silos requires structure to ensure consistency at every stage of your data pipeline
A unified view of customer experience—backed by dashboards, collaborative features, and AI-powered insights—helps every team work from the same truth and supports business needs
1. Standardize and synchronize core data
Teams working with siloed data often deal with conflicting formats and metrics, making it hard to align on key decisions. Standardization and synchronization can be combined together to solve this.
Standardization works to convert data from various sources into a consistent format, while synchronization ensures every system reflects those standardized values.
You need to apply both processes to your core data, which falls into 2 types:
Critical data: datasets your company uses to make strategic decisions, such as consumer and product testing insights when entering a new market
Frequently used data: operational and analytical datasets that teams often access to optimize internal processes and enhance customer experience. Examples include real-time customer behavior data that helps support teams quickly step in to resolve issues
There are different ways to polish your data into a standardized and synchronized format. But ideally, you’ll want to start during data collection with any of the following steps:
Create a data dictionary
A great way to standardize data and maintain consistency is to build a data dictionary—a document that defines the elements in a dataset.
Data teams are usually responsible for building the structure of a data dictionary, preferably in a backend database so it automatically aligns with actual data.
And to run it with correct and up-to-date information, they need to consult the owners and frequent users of data—such as sales, marketing, and product management teams—on key business terms, what they measure, and how they’re calculated.
Here’s an example of a business term:
Term | Definition | Formula |
|---|---|---|
ARR | Short for ‘annual recurring revenue’, which refers to all types of recurring revenue projected over 1 year. This can include subscriptions, membership fees, or licensing fees. | ARR = Annual subscriptions + additional ongoing revenue - cancellations |
Data teams then translate business terms into technical rules, such as data type (number, with 2 decimal places), size (up to 12 digits), and format (currency in US dollars, with 2 decimal places). Meanwhile, developers enforce those rules inside the database and validate them across the data pipeline.
Enforce a schema across your data pipeline
Schemas are another critical part of standardization. They ensure your data conforms to expected structures as it moves through the pipeline. Meaning, datasets should carry the right information consistently during collection, transformation, and even reverse Extract, Transform, Load (ETL) (more on that in the next strategy).
This prevents teams and tools from making incompatible structures, one of the main causes of information silos.
Establish your master data
To standardize what counts as ‘truth’ and remove silos, save a master file of data that rarely changes, such as customer information, product details, and financial data.
Once the master data exists, you can then synchronize updates across software systems like customer relationship management (CRM) and enterprise resource planning platforms. This way, simple updates like a user unsubscribing from emails are universally reflected, preventing frustration and loss of trust.
2. Optimize your tech stack—build a data warehouse
Data from various sources—such as inventory management systems, experience intelligence platforms, and sales and marketing databases—should converge in one place: a data warehouse.
A process called ETL (Extract, Transform, Load) makes it possible for these sources to send information straight into this warehouse. This central repository can store both structured (customer lists and spreadsheets) and unstructured (XML and video files) data.
Forget about data silos. Here, teams can access clean and consistent data for business intelligence (BI) reporting, data visualization, and machine learning-based predictive analytics.
💡 Did you know? Data warehouses are an integral part of a data tech stack. Due to their cost efficiency and scalability, cloud-based solutions like Snowflake, BigQuery, and Databricks are more popular now than on-premise ones.
How to build your data stack
Breaking down silos starts with the right foundation. One of the first considerations is whether your data ingestion tool—which helps collect and import your data into a single location—supports the SaaS, banking, or ecommerce products your teams use daily.
Next: document everything. From your dependencies and configurations to golden tables (definitive data sources) and service accounts (non-human accounts that handle automated tasks like accessing cloud data or running databases). Pair this with version control to maintain a clear history of changes so teams stay aligned.
What’s in a data stack?
Once you’ve documented the tools and systems you need, audit your data stack to see what’s been missing. Ensure you have each these components at the least:
Data sources: send CRM data from platforms like Salesforce and HubSpot; behavioral, performance, and error data from Contentsquare’s Data Connect capability
⚡ Pro tip: Data Connect lets you sync data to your warehouse of choice—at scale. Whether it’s related to product usage, customer frustration, or experience monitoring, the datasets land clean, structured, and governed in your centralized data repository warehouse.
Data Connect also connects with the rest of your tech stack to improve analytics and fuel smarter decisions. Combining it with other data sources into one centralized data warehouse creates new use cases, including AI and machine-learning (ML) models for churn prediction and anomaly detection.
Data Connect drives efficiency by requiring less custom development. Most importantly, it provides us with access to frustration data. By having a full view of what’s happening on our website, we can enrich our customer feedback data and better understand our customers.
Data integration tools: extract raw data from the source, transform it by cleaning, joining, and formatting the data, and load it to the warehouse using tools like AWS Glue, Azure Data Factory, and Apache Airflow
Business intelligence (BI) tools: back up strategic decisions with data mined through software like Tableau and Microsoft Power BI
Dashboard and visualization tools: get a complete picture of your digital analytics performance with Contentsquare’s Dashboards or Looker Studio
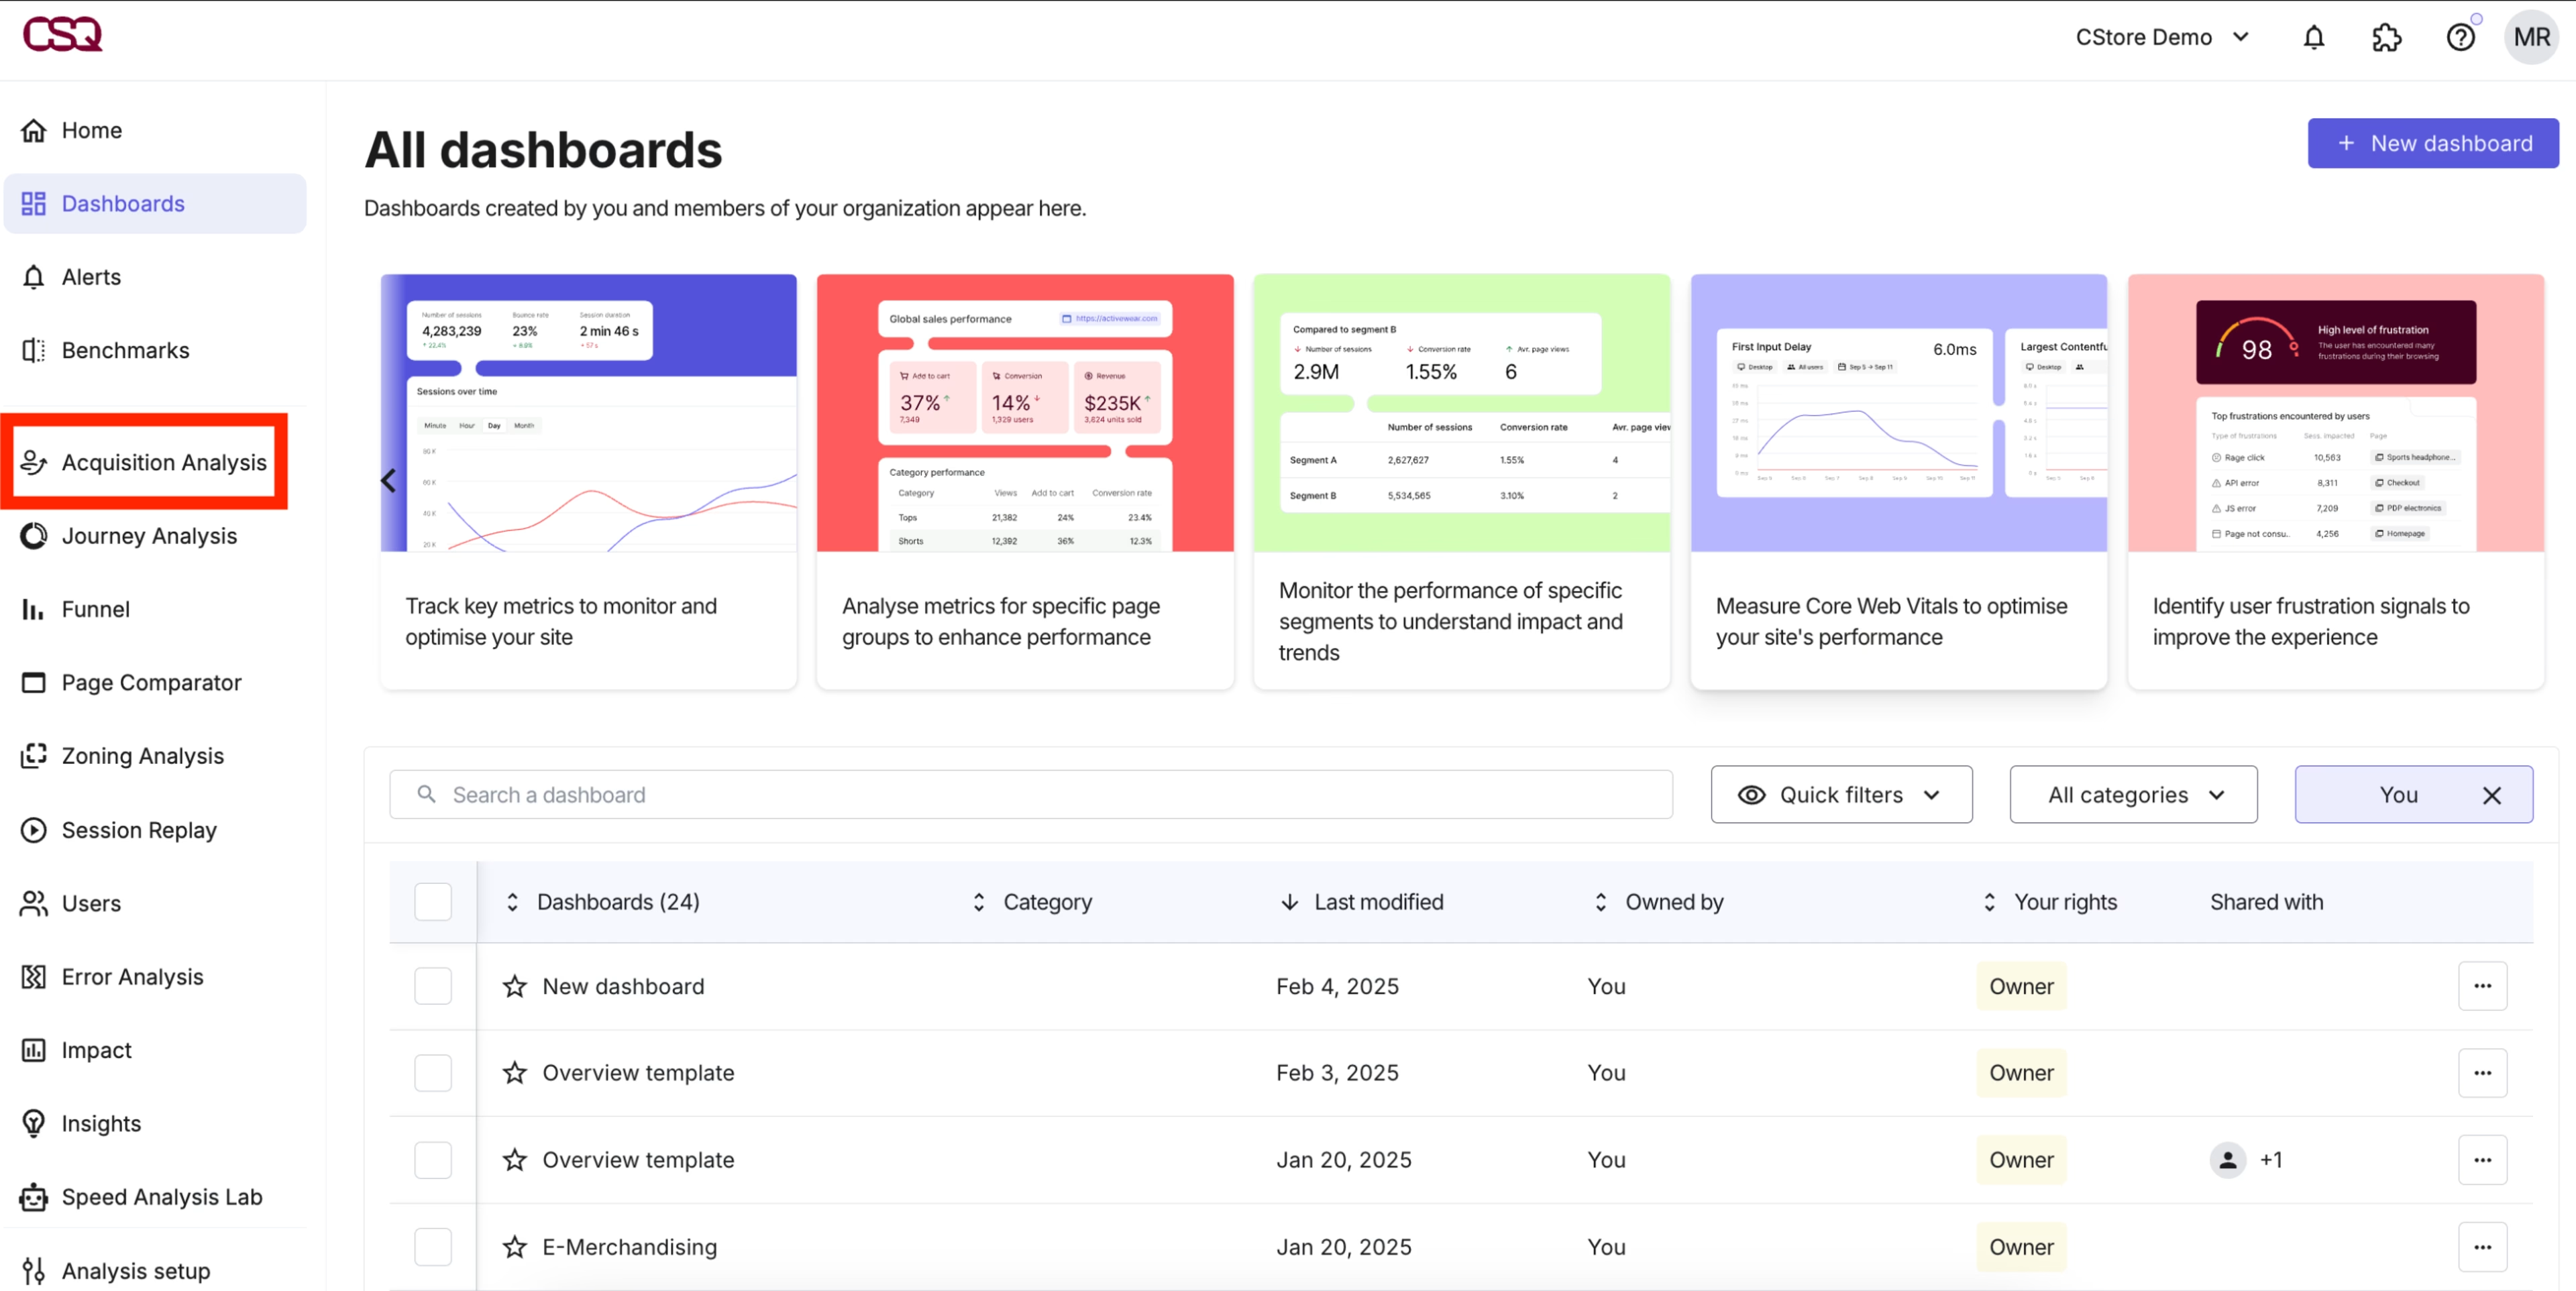
Create shared dashboards in Contentsquare
3. Set up your reverse ETL pipeline
Where ETL is about moving data into your warehouse, reverse ETL or data activation does the opposite, letting you send clean, structured data back to the tools your teams use regularly.
This brings analytics insights directly to the teams that need it most. Marketers use product usage and behavioral insights to power targeted, personalized campaigns. Product and user experience (UX) teams access customer lists to tailor in-app experiences to high-value segments.
Here’s how to build your reverse ETL pipeline:
Choose the right integration tools: match them to your setup requirements and priorities—dedicated reverse ETL platforms for a quick, low maintenance option, change data capture (CDC) tools for real-time syncing, and custom scripts and application programming interfaces (APIs) for flexibility and inclusion of sources that don’t integrate directly with your reverse ETL tool
Prioritize high-impact use cases: identify what will deliver immediate value to teams that need it most
Build, test, and scale: map how data will flow from your warehouse to operational tools. Build your first data stream with the correct source data, transformation, destination targeting, and triggers. Track its performance and adjust triggers or transformations accordingly.
Secure your data: implement data encryption, general access control and authentication, and other security measures during transit and storage
Maintain and communicate: define ongoing maintenance and support processes and don’t forget to let stakeholders know they can access the data they need from the warehouse
⚡ Pro tip: not sure which data to use in your first data stream? Start with behavior analytics data, such as session replays, heatmaps, and journeys—whether from mobile or web.
Sending these insights back to your teams’ everyday tools helps you uncover friction and engagement points. This way, you’ll understand the 'why' behind your customers’ behavior to optimize their digital experiences with greater confidence.
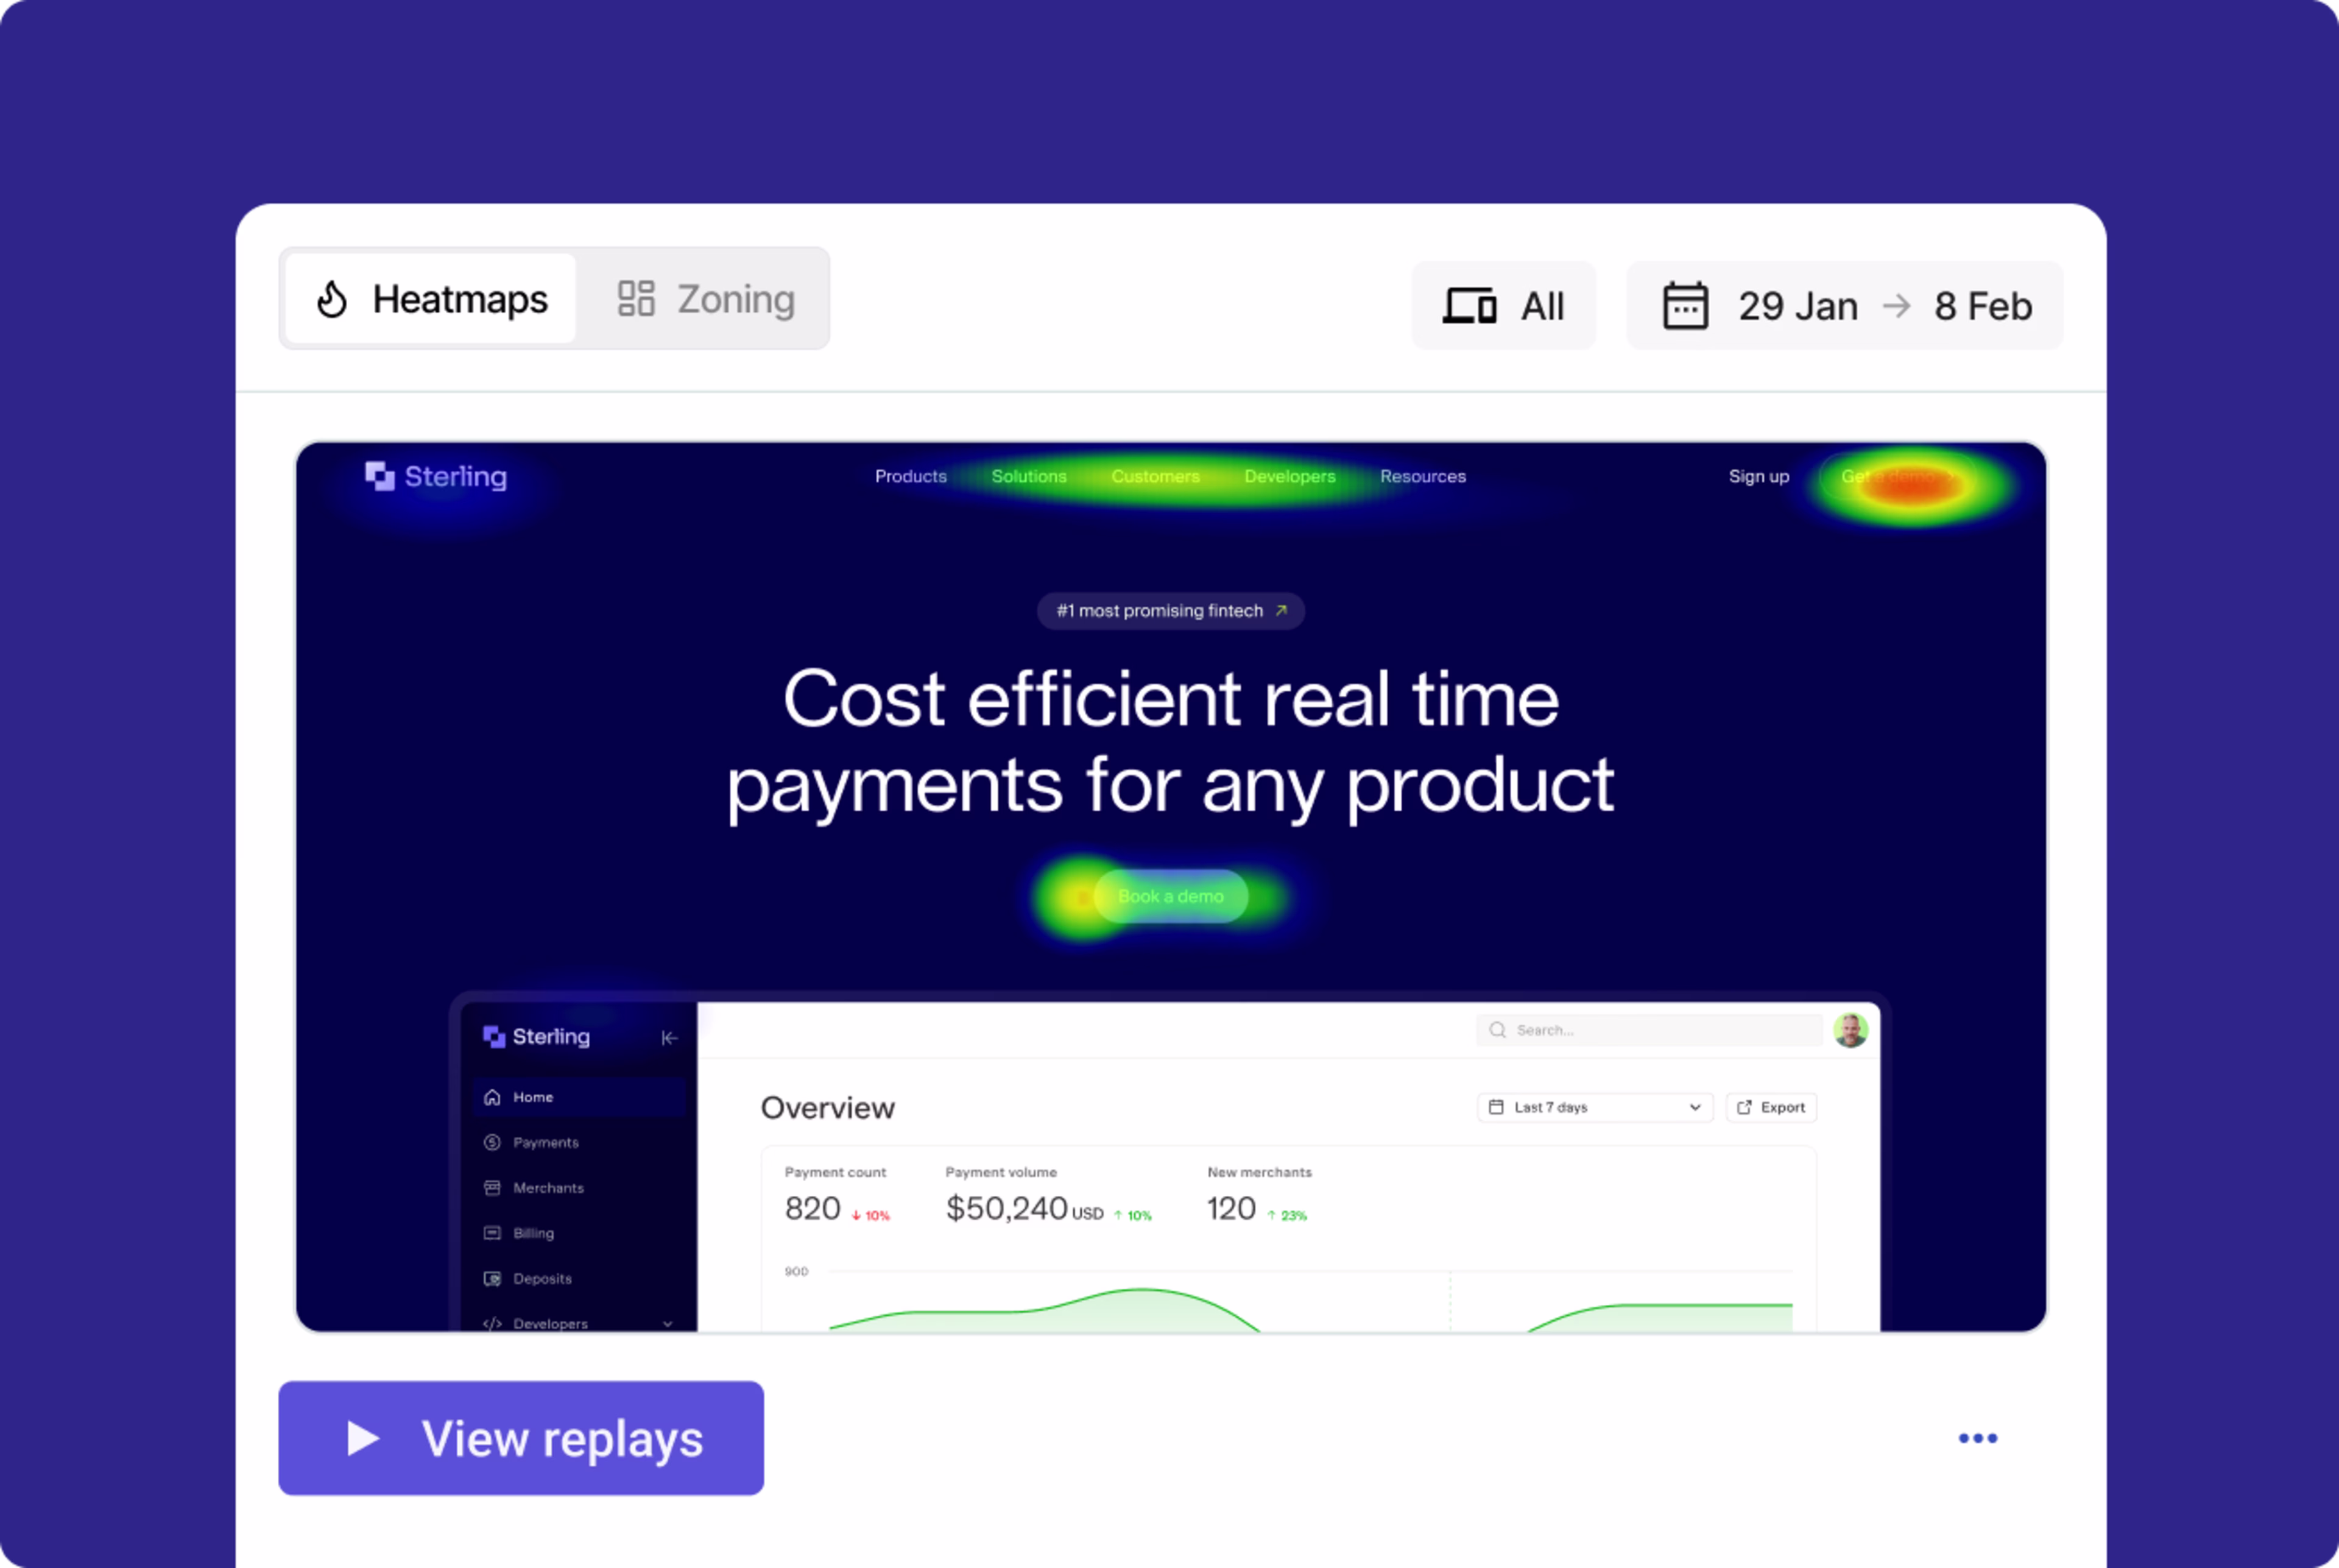
No need to switch between tools: in Contentsquare, you can view heatmaps and then jump to related session replays for a deeper analysis
4. Use data integrity testing
Data integrity testing is the process of systematically evaluating data quality, accuracy, consistency, and completeness. It ensures your data is trustworthy and fit for purpose.
In general, testing focuses on 2 kinds of data integrity:
Physical integrity: detect physical errors or corruption in your hardware or IT infrastructure. This includes disk integrity checks, data transmission tests, backup and recovery validation, and data corruption detection.
Logical integrity: ensure all your data makes logical sense—and that any dependencies or relationships between data points follow your set rules. Common types of testing include domain integrity, entity integrity, referential integrity, logical consistency, and data completeness testing.
To initiate testing, follow these steps:
Set objectives and requirements: identify your critical datasets, prioritize focus areas (Ex: risk and compliance), and work with all stakeholders to define integrity parameters for your data and identify key metrics
Design and implement tests: build comprehensive tests across all levels of granularity, using various testing techniques, and incorporate them into your data pipeline
Choose appropriate tools and technologies: use platforms designed for data quality, data integration, and business intelligence
Establish review and correction processes: assign roles for detecting, categorizing, and resolving errors; and maintain a centralized log to track issues and outcomes
Promote a culture of data integrity: educate and train stakeholders on why data integrity matters and encourage continuous testing
⚡ Pro tip: surface technical and non-technical issues before they get buried in silos.
With Contentsquare’s error-logging capabilities, you can spot and fix issues that may otherwise cost money or damage customer trust. You can even link errors to session replays or Voice-of-Customer (VoC) feedback to get more contextual data and plot your next steps from there.
5. Invest in an all-in-one platform
Finding an all-in-one platform that offers a unified view of the customer experience for all teams is a crucial final step in eliminating data silos. The best ones integrate data from other sources, providing different teams and decision-makers with a 360-degree perspective.
With Contentsquare’s all-in-one experience intelligence platform, everyone gets access to the same behavioral, performance, and error data. Teams can seamlessly switch across and connect insights from 4 core products: Experience Analytics, Product Analytics, Experience Monitoring, and VoC. This allows them to effectively connect and collaborate toward the same business goals.
Here are the key features to look for in a unified platform:
1. Dashboards
Create accurate, real-time data analytics dashboards that cross-functional teams can consult anytime. Contentsquare’s dashboards offer a consistent view of metrics that feed their shared objectives and key results (OKRs), preventing duplicate data and reducing manual reporting.
2. Collaborative features
Break down data silos with features like shared replays and save collections, which are available in Contentsquare’s Session Replay capability. Multiple teams can access and gain insights from the same visual data.
3. AI-powered insights
You don’t have to be a data analyst to get precise, actionable insights from Contentsquare’s AI, Sense. This AI for teams capability means everyone can easily surface patterns, spot anomalies, and uncover opportunities in your data. And act on your findings accordingly, regardless of your data literacy and your company’s data maturity.
![[Visual] diagram](http://images.ctfassets.net/gwbpo1m641r7/7taXPdeI82Yb4jwQoGDomR/999b70899ff6f2b798090e2cedf8f418/contentsquare_diagram.png?w=3840&q=100&fit=fill&fm=avif)
Sense’s speed and flexibility gives you a competitive advantage in industries where you have to optimize digital journeys, improve conversions, and fix errors, fast. Think ecommerce, banking, SaaS, hospitality and travel hospitality, and food services.
Unleash your data’s full potential
Unified data maximizes the power of your data, teams, tools, and systems. This has a wide-ranging impact across your organization: stronger collaboration, more confident decision-making, and more connected experiences.
The benefits trickle down to customers through optimized digital journeys, personalized campaigns, improved products and services—all of which help to fuel business growth.
FAQs about data silos
A data silo is a collection of data stored in separate systems, controlled by one department, and isolated from the rest of the company.
Most often, data silos occur unintentionally as a result of
The company regularly collecting large volumes of data
Growing teams requiring new or additional tools
Data analysis being the domain of a team of specialists
![[Visual] Contentsquare's Content Team](http://images.ctfassets.net/gwbpo1m641r7/3IVEUbRzFIoC9mf5EJ2qHY/f25ccd2131dfd63f5c63b5b92cc4ba20/Copy_of_Copy_of_BLOG-icp-8117438.jpeg?w=1920&q=100&fit=fill&fm=avif)