![[Visual] stock woman with 2 computer screens](http://images.ctfassets.net/gwbpo1m641r7/6vPvGMnUXFrEYOQUzrQhiW/43c9f93a0d1772ff652e6e427ce1af2c/AdobeStock_899206281.png?w=3840&q=100&fit=fill&fm=avif)
If you’ve ever sat in a meeting where marketing presents one set of numbers, product shares another, and UX has yet another story, only to realize no one has the full picture—you’ve felt the pain of data silos.
When data lives in disconnected systems or departments, every team ends up working with a different version of the truth. That means slower decisions, misaligned strategies, and customers who feel the disconnect in their experience.
This guide explains what data silos are, why they happen, what they cost your business, and how removing them unlocks stronger collaboration, faster insights, and better customer journeys.
Key insights
Data silos block collaboration and distort decision-making—teams work in parallel but not in sync. Breaking down silos unlocks better customer insights, faster alignment, and stronger outcomes.
Silos form naturally as companies grow, but they’re not inevitable—they’re a byproduct of disconnected tools, structures, and processes
Modern analytics platforms connect data across teams, eliminating blind spots. Tools like Contentsquare’s Journey Analysis, Session Replay, and Heatmaps help every team work from the same evidence.
What is a data silo?
A data silo—sometimes called an information silo—is a collection of company data that’s only accessible to one team or department. It’s an isolated dataset that prevents different teams from working with the same insights. Instead of a shared source of truth, each group ends up with its own partial view.
Think of it as building walls between teams: marketing sees campaign clicks, product sees feature usage, customer support sees ticket volumes—but no one can see the entire customer journey from start to finish.
In practice, silos look like:
Marketing optimizing ad spend based on campaign metrics
Product teams tracking feature engagement in a separate platform
UX teams analyzing survey feedback in isolation
Without a connected view, insights get lost and opportunities slip through the cracks. Contentsquare closes these gaps by letting teams explore the full journey together—jumping from high-level metrics into the specific sessions behind them.
For example, a sudden spike in errors can be traced back to session replays that show exactly where customers struggled, giving marketing, product, and UX the same insights to act on.
![[Visual] diagram](http://images.ctfassets.net/gwbpo1m641r7/7taXPdeI82Yb4jwQoGDomR/999b70899ff6f2b798090e2cedf8f418/contentsquare_diagram.png?w=3840&q=100&fit=fill&fm=avif)
Unified analytics from Contentsquare brings together trusted data, real-time insights, and team collaboration to deliver measurable business outcomes
Why does data get siloed?
Data silos form as companies grow, adopt new tools, or set up an organizational structure that separates teams. Over time, legacy systems and fragmented workflows make it harder to connect insights.
Here are 5 common causes of data silos.
1. Technology gaps
Teams use different tools that don’t integrate.
For example, marketing might track acquisition in Google Analytics, while the product team measures checkout flows in a custom tool—2 separate pictures of the same journey.
2. Organizational silos
Departments protect their own KPIs and reporting structures, making it harder to share data across functions.
For example, a SaaS company might find its marketing team reports healthy sign-up numbers, but the product team reveals a steep drop during onboarding. Without shared data, the company debates where the problem really lies—wasting time instead of fixing friction.
3. Company culture and processes
Often, silos persist because of company culture. Marketing, product, or sales teams may prioritize their own KPIs, keeping insights in separate dashboards. Without a culture of openness, organizations miss the chance to share information and align around customer needs.
4. Data management gaps
Without consistent governance of data sources, storage, and quality standards, silos form by default. One business unit might store customer data in a cloud-based CRM, while another relies on on-site data warehouses or spreadsheets. These disparate systems make it harder to share information, ensure data quality, and enforce data security.
Weak data management also means unstructured or duplicate data piles up in different data lakes and repositories, creating inefficiencies that slow down initiatives across the company.
Contentsquare’s Data Connect solves this by linking raw event data directly into your data warehouse and BI stack, ensuring teams share consistent definitions and a unified dataset.
5. Growth complexity
New systems and workflows are added quickly, without ensuring connectivity. What worked at 50 employees becomes chaos at 500.
As companies expand, new tools, processes, and teams layer on top of each other—often without a plan for integration. Data that was once easy to track becomes fragmented, and insights get buried.
Until now, traditional analytics have been failing us. They’ve been failing us because of siloed data and different teams using different analytics, because of too much complexity creating analysis paralysis, and because no one has enough time to make sense of those complex analytics. For the last 10 years, Contentsquare has been obsessing about creating better analytics, by disrupting the way of doing analytics.
4 benefits of removing data silos
Breaking down data silos improves efficiency and unlocks growth. Benefits include:
1. Better collaboration
When data flows freely, teams stop working in isolation. Marketing, product, and UX can finally speak the same language instead of translating between tools and reports.
For example, marketing might spot a drop in ad campaign ROI, while product sees a spike in checkout errors. With shared analytics, both teams can trace the issue to the same broken form field and fix it together.
💡 Beware: disconnected metrics and duplicate data lead to inefficiencies, misaligned resources, and wasted spend. For example, marketing might push for more sign-ups, while product teams are focused on feature adoption. Without shared data, one team’s success can cancel out the other’s efforts.
2. More accurate decisions
Unified data eliminates guesswork and empowers data-driven decisions. Teams can focus on relevant data instead of debating conflicting dashboards, where marketing’s attribution model shows one result, product’s funnel metrics suggest another, and leadership doesn’t know which numbers to trust. Instead of marketing working from attribution reports and product relying on in-app metrics, both can consult a shared dataset.
For instance, a SaaS company with a unified view might realize that sign-ups look strong, but trial users aren’t converting because of onboarding friction. With that clarity, budgets and efforts can be redirected from acquisition to activation, where they’ll have more impact.
🔥 How Contentsquare helps: capabilities like Journey Analysis and Session Replay give every team the same clear view of customer behavior, while Data Connect ensures those insights flow into your wider data warehouse and reporting stack. Instead of siloed snapshots, teams collaborate around a unified story of how users actually interact with products—and connect that story directly to business impact.
Watch how industry leaders are breaking down data silos and aligning teams around a single source of truth in this CX Circle session
3. Faster identification
When silos disappear, so does the lag time between noticing a problem and resolving it. UX might catch repeated rage clicks, product sees drop-offs in user journeys, and customer success hears complaints—all tied together in one shared dataset. That alignment means fixes roll out faster, supported by real-time insights and automations that flag issues the moment they appear. Teams can then prioritize A/B tests for the issues that matter most.
In practice, a retailer with unified analytics can spot a broken checkout button within hours, not weeks—saving thousands in lost revenue.
💡 Beware: data silos create constant debates about whose numbers are ‘right’. Marketing’s analytics show one conversion rate, while UX reports a different figure based on session replays. Instead of acting on clear evidence, teams stall in endless meetings reconciling spreadsheets. This slows down fixes, A/B tests, and product launches—costing businesses both time and momentum.
4. Stronger customer experiences and revenue increase
The result of breaking down silos isn’t just happier teams—it’s happier customers. A unified view ensures smoother, more consistent journeys across every channel.
For example, when ecommerce brands combine marketing and product data, they can align promotions with in-stock items, eliminating the frustration of ‘bait-and-switch’ offers. The payoff is tangible: smoother digital experiences translate into higher conversions, repeat visits, and measurable revenue growth.
Stronger data security also builds trust, ensuring customer data is used responsibly. Many use cases show that when organizations unify data, they reduce friction and strengthen loyalty.
💡 Beware: customers feel silos more than anyone—whether it’s a broken form that never gets fixed, or outdated information on a landing page. These repeated frustrations lead to abandoned carts, churn, and negative reviews. Unified analytics helps close the loop so frustrations don’t linger and brand reputation stays intact.
Before Contentsquare, we had no way of tying together website performance metrics like Core Web Vitals and conversion. With Contentsquare, we’re now able to make decisions based on data, and see the direct, quantifiable impact of changes on our customer behavior.
How to overcome data silos in 3 steps
Breaking down silos doesn’t happen by accident—it takes deliberate planning. But the good news is, the playbook is clear. Based on proven industry practices, here are 3 high-level steps to overcome data silos:
1. Invest in tools that integrate data across teams
Silos happen when different departments rely on separate systems without data integration. The fix begins with platforms that feature a scalable data architecture, integrating data across marketing, product, UX, and other teams. Instead of piecing together insights from disconnected tools, everyone can work from one source of truth.
For example, Contentsquare’s Journey Analysis gives teams a shared view of how users move across touchpoints, while Session Replay shows the why behind drop-offs. Together, they replace fragmented reports with a single narrative that all teams can act on.
![[Visual] Session Replay](http://images.ctfassets.net/gwbpo1m641r7/KkSxyZYjfc5rt0lCx78TF/0b54048e9f838565dcab1422efe3bd87/Session_Replay.jpg?w=1920&q=100&fit=fill&fm=avif)
Contentsquare’s Session Replay shows the exact user actions and frustrations—like rage clicks on checkout—so teams can quickly identify and fix blockers
2. Encourage cross-functional collaboration
Even the best tools won’t break silos if teams don’t talk to each other. That’s why process and culture matter just as much as technology. Companies that succeed here create cross-functional squads to address shared goals—like reducing checkout abandonment or improving onboarding.
For example, an ecommerce brand might align marketing, product, and UX around a single OKR: increase mobile conversions. By reviewing heatmaps and session replays together, teams can spot friction points and prioritize fixes—driving measurable gains faster than if they worked in silos.
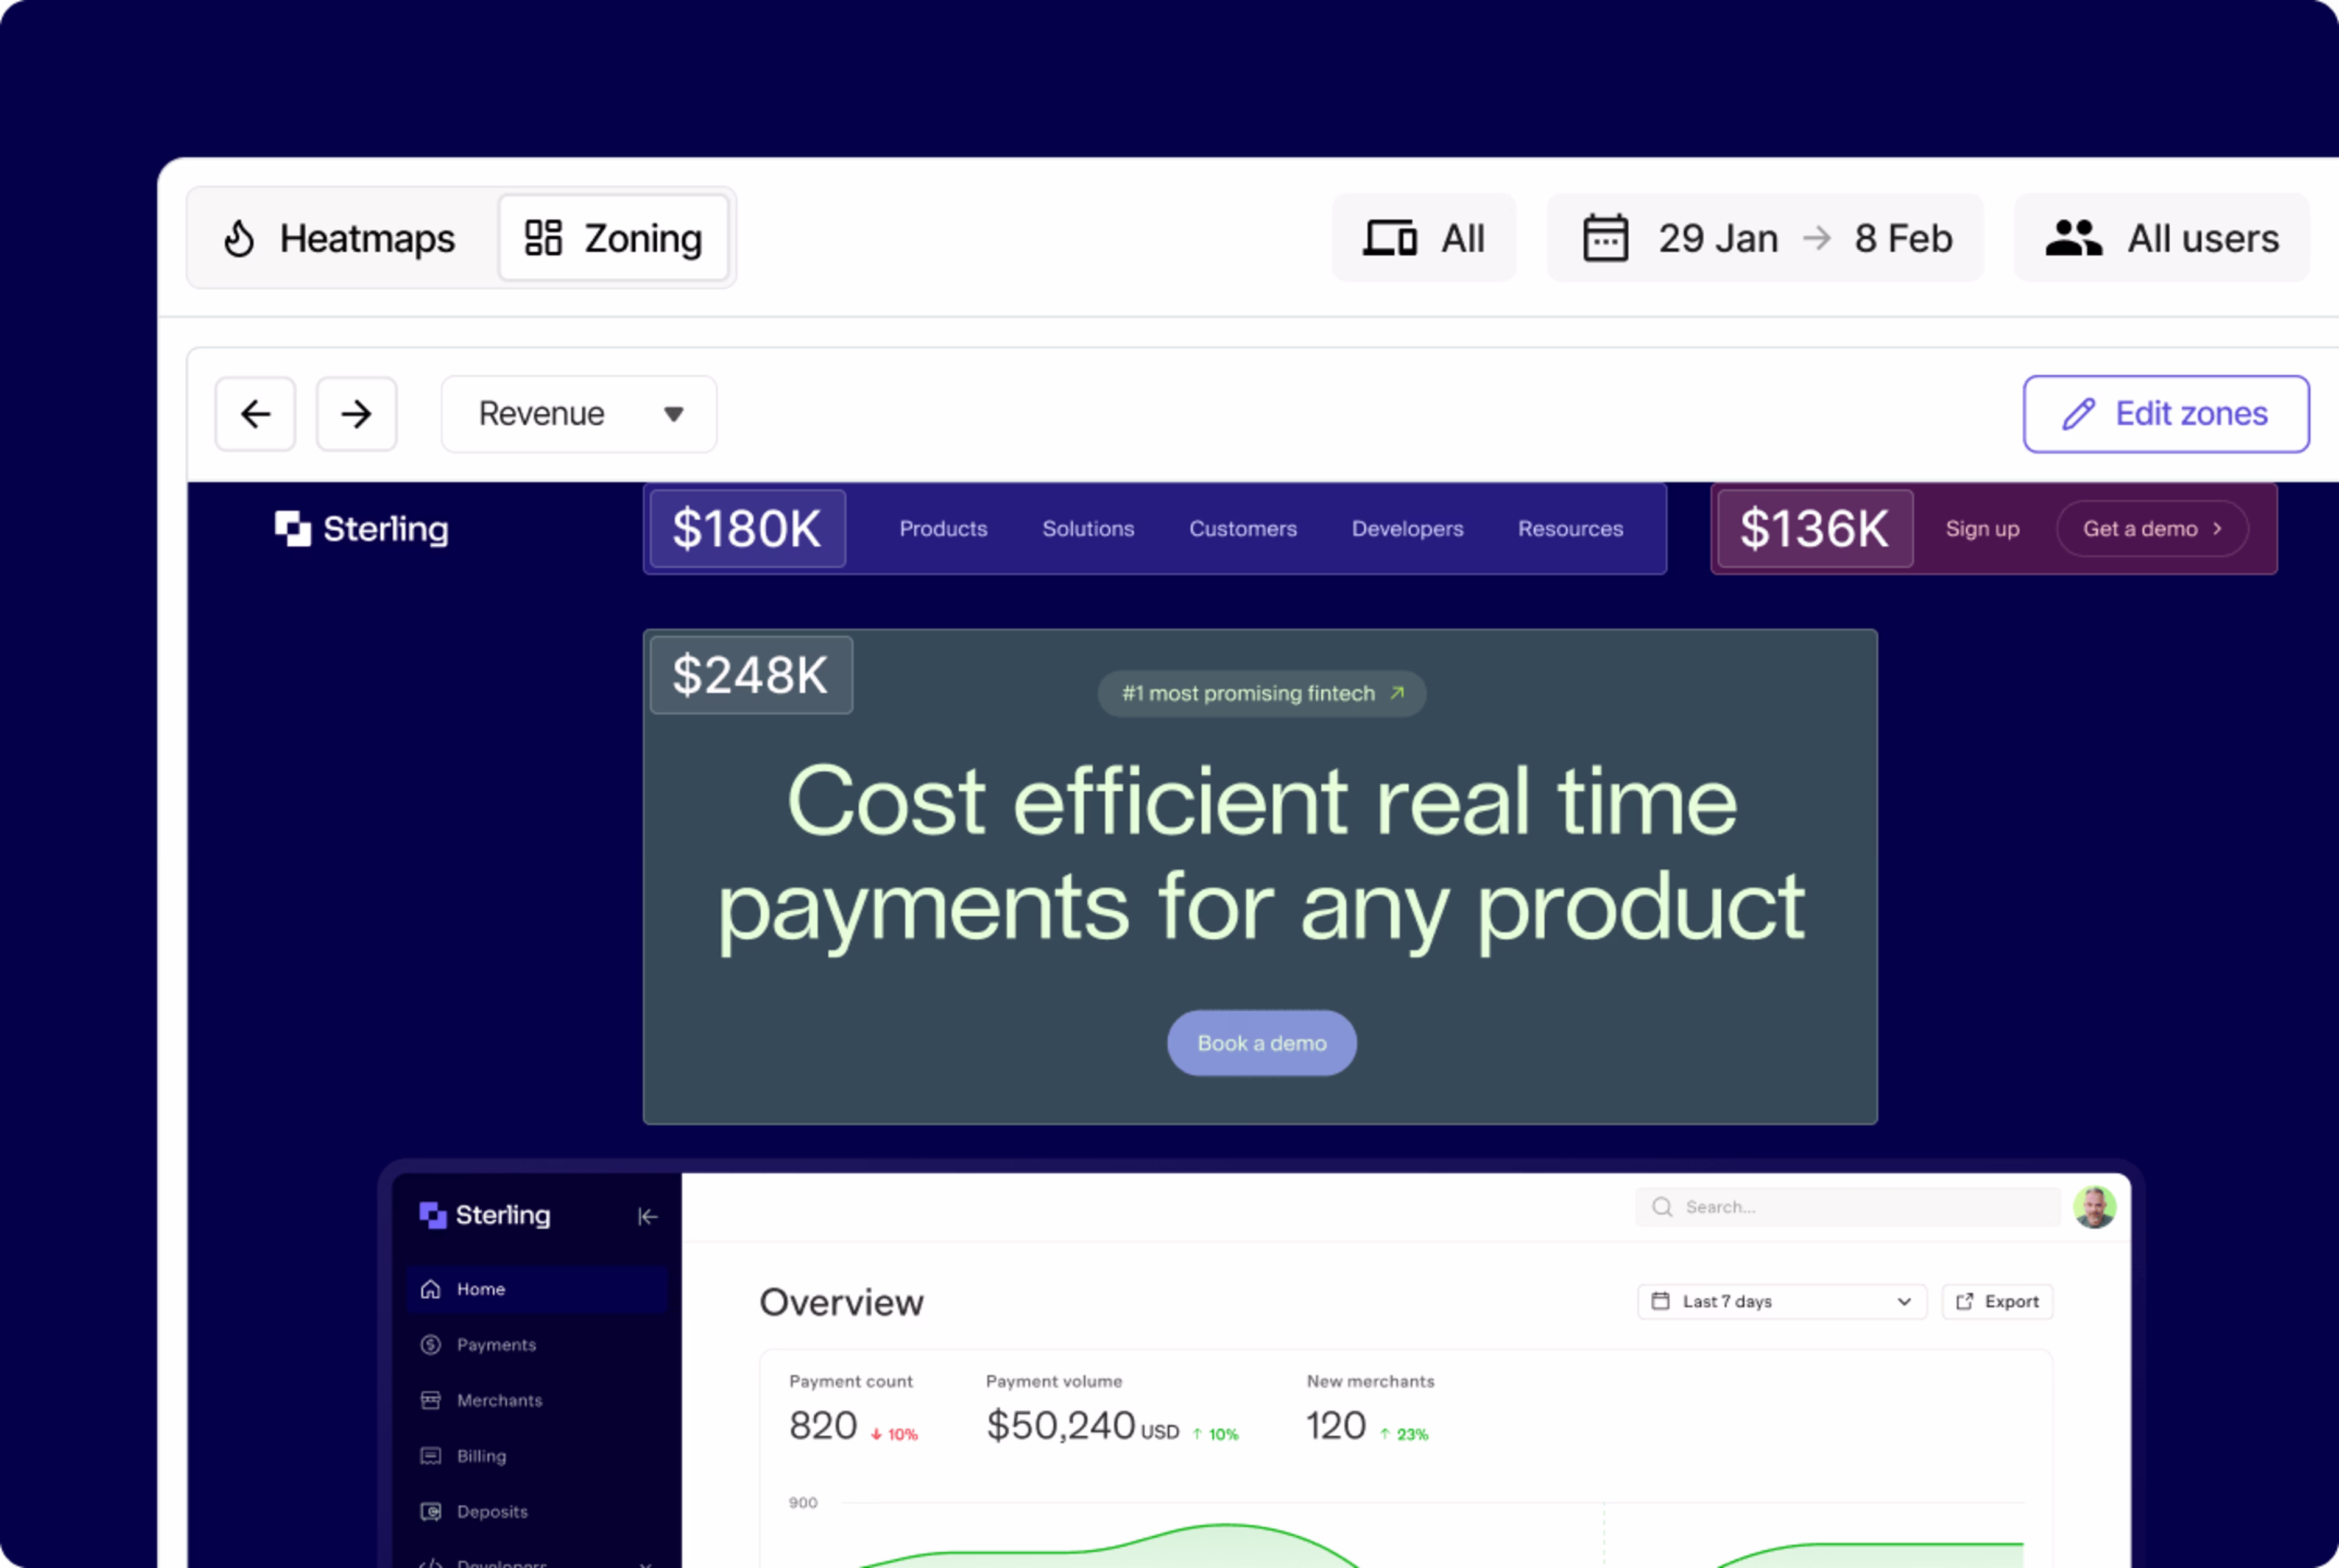
With Heatmaps and Zoning, marketing, product, and UX can review the same evidence together—spotting friction and agreeing on priorities without silos
3. Standardize metrics and definitions
A surprisingly common source of siloed data is disagreement over definitions. Marketing may count a form fill as a conversion, while product only counts paid activations. Without alignment, dashboards contradict each other, and trust erodes.
To avoid this, invest in data governance by documenting and standardizing key terms—conversion, engagement, drop-off—so all business units measure success the same way. Tools like Contentsquare’s Data Connect can help enforce consistent definitions by linking raw event data to unified metrics.

With Data Connect, raw event data flows into warehouses and BI tools, ensuring consistent definitions and eliminating conflicting dashboards
Breaking silos, building alignment
Silos are common—but they’re not inevitable. Left unchecked, they cost time, money, and trust.
By connecting data, aligning teams, and focusing on the full customer journey, organizations move faster, make better decisions, and deliver seamless experiences.
Unified data leads to faster alignment, stronger customer journeys, and higher ROI.
Want to see how unified analytics can help your team break silos? Explore how Contentsquare brings cross-team insights together.
FAQs about data silos
Data silos meaning: isolated data stored in one place and only accessible to a single team or department. Data silos prevent organizations from sharing insights across functions.

![[Visual] Contentsquare's Content Team](http://images.ctfassets.net/gwbpo1m641r7/3IVEUbRzFIoC9mf5EJ2qHY/f25ccd2131dfd63f5c63b5b92cc4ba20/Copy_of_Copy_of_BLOG-icp-8117438.jpeg?w=1920&q=100&fit=fill&fm=avif)